Research Development Cell, Government College of Engineering, Jalagon (M. S), India
ECG Digitzation By Morphological Top-Hat
Transform
R. R. Karhe1, Dr. S. N. Kale2
Research Scholar, Department of Electronics and Telecommunication, Shri Gulabrao Deokar College of Engineering,
Jalgaon, India1
Department of Applied Science, SantGadge Baba Amravati University, Amravati, India 2
ABSTRACT: The electrocardiogram (ECG) is a 2-D signal graph basically printed on thermal grid lined paper showing heart functionality and is sensed by special electrodes attached over the heart surface. Digitization of ECG is a today’s demand for various cardiologists for preserving papered ECG, for easy analysis of previous records, for fast processing, for solving the problems of complex nature of today’s complex machineries that providing various formats of digitized ECG. In this paper a new approach based on morphological Top-hat transform is developed in order to suppress noises from the ECG signals.
KEYWORDS: ECG, Digitization, Mathematical Morphology, Morphological Top-hat transform.
I. INTRODUCTION
Day by day, preserved ECG is affected by blurring effect and various noises on it and cannot be visible after many days. It is also needed to easily handle the critical cases by attending caretakers in any emergency. Unavailability of experts in emergency is major problem so the especially less expensive and less complex system is need to be develop for house hold use and small clinics. The various complex ECG analyzing systems are available but the digitized stored data format is only recognizable by the same machines so the output is unreliable and cannot work on other machine. Need is to develop the reliable system for digitization and even for ECG analysis so that all until now format can be converted into easily readable format. Many researchers had worked on the similar requirements of ECG digitization and all are discussed as follows.
ECG has been used by many cardiologists from many years for cardiac disease identification and cardiac treatment. Many Cardiac processes has been developed until now like beattobeatnoiseremoval[1], non linear adaptation method of elimination of powerline interference[2], powerline interference cancellation in signals[3], ordynamic power line interference subtraction for bio-signals [4] and digitization technique [5].
Research Development Cell, Government College of Engineering, Jalagon (M. S), India
Many available techniques for digitization ECG printout are not flexible to work with many types of paper records captured with different cameras. They are also cost effective with high risk of data loss while processing [1, 2, 3,4]. Need of ECG digitization is shown by many authors within last two decades [15]. Manual evaluation of 12-lead ECGs from paper print is generally performed in modern clinical trials [16]. In this era of fast processing, this task is becoming tedious and may introduce manual error [17]. Now a day’s many instruments are available which can sense real time ECG and can store for automatic or manual prediction for future treatment. Previously printed ECG has been preserved for many days by many cardiologists but the paper may be blurred and may be torn day by day. So in turns, previous history of cardiac functionality is day by day becoming unavailable. It is needed to be digitized for analyzing and interpreting the cardiac history of the patients.
Until now, very little research [17-23] was done in the field of ECG paper digitization and even facing the problems in many aspects like high speed operation, low resolution ECG image retrieval, to extract or remove grid with different color images with clear trace view, to extract or remove grid if trace and grid is of same color with clear trace view etc. Morphological operations [24] like erosion [25,26] dilation [25,26] thinning [27] etc are used already to remove the ECG trace from its grids. Most of the authors used axis identification [28] for trace visualization properly.
Background grid removal with clear trace retrieval is the main aim behind the digitization of ECG paper. Some algorithms like in [22-23] are presented in this field. These algorithms are categorized based on the various aims of improving the standard steps of ECG digitization. Standard steps are given as ECG paper scanning, image enhancement, grid removal, trace detection and enhancement, trace scaling, and trace visualization. Out of all the available algorithms, first types of algorithms are of trace enhancement for reduction of unwanted grid [16,22,23,29], second type of algorithms are based on color segmentation based grid removal [30], third types of algorithms are for grid removal with periodic distance vertical direction through XOR operation [29,31] and fourth type of algorithms are related with feature extractions from ECG papers [17,32]. Image enhancement techniques [16,22,23,29] for reduction of unwanted grid are generally including the binarization process [23], filters like Median filter [19], Iterative Method [32], K-means [33] and Otsu algorithm [33-35]. It also includes thinned [36], tracing using line tracking [13] or snakes filtering [20] after the trace is enhanced. Image enhancing algorithms are mostly becoming non-effective when there is high intensity grid with low intensity trace of ECG. Slightly this problem can be solved with color segmentation based algorithms but other problem this algorithm facing is if trace and grid is having same color or if gay scaled then it will definitely fail. To handle this, horizontal and vertical grid removal based on third category is necessary. In these algorithm proposed in [32] and [37], it is necessary to find the predefined and periodic distance between the grid lines which is more complex task and will be difficult if the ECG is not having periodic grid because of manual image capture. The algorithm to handle the manual error in capturing the ECG image for removal of the grid without affecting the printed ECG trace is needed to even develop. This problem may be called Man Made Problem in ECG Digitization.
To avoid Man Made Problem in ECG Digitization independent of distance between the consecutive grid lines, all
the vertical grid lines detection and removal can be performed to get image of a trace with horizontal lines (1st image)
and all the horizontal lines grid lines can also be removed from original image to get the image of a trace with vertical
lines (2nd line). Instead of XOR operation like in algorithm in [29,31], one can use other operations to combine these
two images so that only a ECG trace remain present in final image. This image can be further processed to get convert the trace on image into the digital form of ECG. Most of the present algorithms used Hough transform [24] based de-skewing the scanned/captured images, it is necessary to rotate the scanned image. Instead if this, image transformation is needed to correct the manual errors occurred while capturing the ECG image which can transform the scanned image in to properly rotated image as well as it can transform uneven distributed grid (due to manual error) into evenly distributed gird lines so that it can be easily removed using proposed grid removal process.
II. MAJOR STEPS IN ECG DIGITIZATION
Many steps are evolved in ECG digitization bur here we discussed the majored steps by combining the various small steps. We considered two steps as 1) ECG paper scanning and trace enhancement and 2) trace detection and display as follows.
A. ECG PAPER SCANNING AND TRACE ENHANCEMENT
Research Development Cell, Government College of Engineering, Jalagon (M. S), India
requires the involvement of linear interpolation [16, 22, 23, 29] in case of low resolution image for adding and replenishing the missing pixels. With various resolutions, comparative study is performed by JalelChebil et al. [23] showing the relation between scanning methods and image enhancement method. So we can make combined efforts for both processes.
Image enhancement process includes scanned image processing techniques like de-skewing [24] the scanned/captured images, color segmentation [30], binarization [23] and trace pixels enhancement with grid pixels de-enhancement. Image enhancement is mainly required to raise the trace of ECG and to degrade the intensity of grid lines in corrected image.
B. TRACE DETECTION AND DISPLAY
Background removal [22-23], image trace detection/extraction [16,29] trace enhancement (trace thinning) [27], extraction of locations of trace pixels for display as digital signal [16], locations interpolation [16,22,23,29] and axis identification [28] are the various steps in the step of trace detection.
ECG display is also important in digitization process. It is required to display it in ECG analysis through the various forms as in normal form of graph and in logarithmic forms like semi log form [38] and log-log form [39].
III. SURVEYONMATHEMATICALMORPHOLOGY
Mathematical morphology can be used for extraction of required information from image. In image processing, morphology is the name of a specific methodology for analyzing the geometric structure within an image. The morphological filter can be constructed on the basis of its corresponding morphological operations that are more suitable for shape analysis than the standard linear filters. It may sometimes distort the underlying geometric form of the image. Some of the salient features regarding the morphological approach are as follows:
1. Morphological operations provide for the systematic alteration of the geometric content of an image while maintaining the stability of the important geometric characteristics [40].
2. There exists a well-developed morphological algebra that can be employed for representation and optimization [40].
3. It is possible to express digital algorithms in terms of a very small class of primitive morphological operations [40].
4. There exist rigorous representations theorems by means of which one can obtain the expression of morphological filters in terms of the primitive morphological operations [40].
Generally with the interaction to the other image of certain shape and size, called the structure element, the morphological operators transform the original image into another image. Geometric feature of the image that are similar in shape and size to the structure element can be preserved, while other features can be easily suppressed. Thus, morphological operations can simplify the image data, preserving their shape characteristics and eliminate irrelevancies and unwanted components from image. In view of applications, morphological operations can be employed for many purposes [41] like including edge detection [42,43], segmentation [44-47], enhancement [48] of images and so on. The basic concept of morphological signal processing is to modify the shape of a signal, equivalently considered as a set, by transforming it through its interaction with another object, called structuring element. In practice, the structuring element is compact and of a simple shape than the original object. The basic operators of morphology transform include dilation, erosion, opening and closing .
Let f (n) be the original 1-D signal, which is the discrete function over a domain
f (n) = {0,1..., N −1}. And let B(m) be the structuring element, which is the discrete function over a domain B(m) = {0,1...,M −1} two basic morphological operators, the erosion and the dilation, can be defined as
(f B)(n)=MIN {f (n+ m)-B (m)}
(F Θ B)(n)= MAX{f (n -m) +B (m)}
Based on de dilation and erosion, two other basic morphological operators, the opening (•) and the Closing (•) can be further defined:
Research Development Cell, Government College of Engineering, Jalagon (M. S), India
A. DILATION
Dilation causes objects to dilate or grow in size. The amount and the way that they grow depends upon the choice of the structuring element. Dilating without specifying the structural element makes no more sense than trying to low pass filter an image without specifying the filter. Dilation of A by B is defined as
D(A B)=AB(A + B. EROSION
Erosion work (at least conceptually) by translating the structuring element to various points in the input image, and examining the intersection between the translated kernel coordinates and the input image coordinates. The erosion of A by B is defined as
E(A,B)=A B= (A -)
C. OPENING
Very simply, an opening is defined as erosion followed by a dilation using the same structuringelement for both operations. The opening operator therefore requires two inputs: an image to beopened, and a structuring element.
(A,B)ABD(E(A,B),B)
The basic effect of an opening is somewhat like erosion in that it tends to remove some of theforeground (bright) pixels from the edges of regions of foreground pixels. However it is lessdestructive than erosion in general.
D. Closing
Closing is defined as an dilation followed by erosion using the same structuring element for bothoperations. The closing operator therefore requires two inputs: an image to be closed, and a structuringelement. Closing is similar in some ways to dilation in that it tends to enlarge the boundaries offoreground (bright) regions in an image (and shrink background color holes in such regions), but it is less destructive of the original boundary shape.
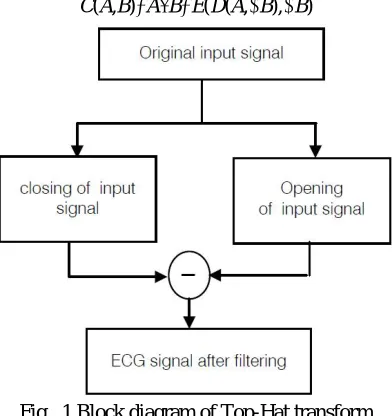
C(A,B)ABE(D(A,B),B)
Fig. 1 Block diagram of Top-Hat transform
IV. PROBLEMDEFINITION
Research Development Cell, Government College of Engineering, Jalagon (M. S), India
V. METHODOLOGY
In proposed work, to avoid Man Made Problem in ECG Digitization independent of distance between the consecutive grid lines, all the verticals grid lines detection and removal can be performed to get image of a trace with
horizontal lines (1st image) and all the horizontal lines grid lines can also be removed from original image to get the
image of a trace with vertical lines (2nd line). Instead of XOR operation like in algorithm in [29,31], one can use other operations to combine these two images so that only a ECG trace remain present in final image. This image can be further processed to get convert the trace on image into the digital form of ECG. Most of the present algorithms used Hough transform [24] based de-skewing the scanned/captured images, it is necessary to rotate the scanned image. Instead if this, image transformation is needed to correct the manual errors occurred while capturing the ECG image which can transform the scanned image in to properly rotated image as well as it can transform uneven distributed grid (due to manual error) into evenly distributed gird lines so that it can be easily removed using proposed grid removal process.
We are using manually captured ECG image from ECG paper so image warping is proposed for the orientation and grid correction purpose. Using image warping, we can transform captured image of ECG paper into parallel lined grid graph. Captured image may have slanted non-parallel lines gridded trace of ECG because of manual error during capturing. If camera is not focused in parallel along the parallel lined paper then parallel lines may be seen as lines of non-uniform rhombus. This type of image is required to correct in to parallel horizontal and vertical lined grid graph so that grid can be easily removed from it.
Initially a basic algorithm is designed with doesn’t consist of image de-skewing or image warping but taken directly corrected image as input. Image of ECG is initially cropped so that the region of interest (i.e. region of ECG trace) is only covered. The colour image is needed to be converted to the image which contents only the component of trace. For this, it is to be converted in to the binary image for reduction of grid line and enhancement of trace pixels.
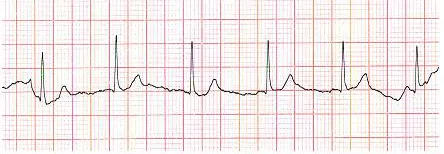
Binarization required converting the colour image in to gray level image initially and then binarized into the black and white (BW) image. Darken pixels identification is more difficult then identification of bright pixels and the trace is darken than the grid lines so it is needed to convert the darken pixels into the bright pixels and vice versa. It needed to use the negation of BW image. Original image and BW image is shown as follows.
Fig. 2 Original Image
Research Development Cell, Government College of Engineering, Jalagon (M. S), India
Fig. 4 Negated BW image (BWn)
We propose to remove horizontal and vertical lined intense pixels by using Top-Hat filter separately. Top-hat filtering calculates the morphological opening and then subtracts the resultant image (C) from the source image (A) as shown in following equations.
T = A – C, and C = (A ʘρ)ϴρi
Where, A, C, ρ, ʘ, ϴand ρi denotes original image, morphological opening, structure element, erosion, dilation and
inverse structure element respectively.
Top-Hat filter with a horizontal structuring element of points equal to the horizontal length of image is considered to remove the horizontal intense lines pixels in given image and similarly for vertical lines.
Input image (BWn) for horizontal top hat filtering is shown below.
Fig. 5 Negated BW image (BWn)
Removal of horizontal lines using Image opening and subtracting from BWn image gives image as,
Fig. 6 Removed horizontal grid lines
Research Development Cell, Government College of Engineering, Jalagon (M. S), India
Fig. 7 Dilated image
Above Fig. enhances the entire components from which small components are reduced using image opening. Image opening consisting of erosion and dilation is performed for reduction of unwanted components. Erosion clears maximum all the small components using given structural elements and again dilation process brings the remaining components to original form. Figure bellow shows the reduction of noise from above Figure.
Fig. 8 Image opening is performed
Now it is needed to remove vertical lines from above image. This image is processed with Top Hat filtering with vertical structural element of points equal to the vertical height of image in which given image is processed with morphological opening followed by subtraction from input image. The final image after removal of horizontal line without noise is used for removing the vertical lines. Output image got may consist of vertical noise. It can be again reduced with morphological processes.
Fig. 9 Removed vertical lines
Image is eroded to remove unwanted components.
Research Development Cell, Government College of Engineering, Jalagon (M. S), India
Then it is again dilated as,
Fig. 11 Dilated image
The unwanted components are removed by using image opening operator as used in horizontal lines removal process. The final image shows the removal of maximum all the vertical and horizontal grid lines with removal of noise generated in process.
Fig. 12 Image opened to remove noise
The bright components are then digitized by finding the locations of it and plotted as shown below.
0 0. 1 0. 2 0.3 0. 4 0.5 0.6 0. 7 0.8 0.9 1
0. 35 0. 4 0. 45 0. 5 0. 55 0. 6 0. 65 0. 7 0. 75
Fig. 13 Final digitized ECG
VI. CONCLUSION
Need of ECG digitization is specified by many cardiologist, researchers and authors in their literature. A new algorithm morphological Top-hat transform for noise suppression using non linear transform was developed. It consists of morphological operator which are closing and opening. These operators are used as structuring element SE. Various problems, needs, requirements and expectations related with various algorithms in ECG digitization are detailed in this work.
REFERENCES
[1] BazhynaA,ChristovI,GotchevA,DaskalovI,EgiazarianK.(2004).Beattobeatnoiseremoval-noninvasive His-bundle electrocardiogram.MedBiol. Eng.Comput. 42:712-720.
[2] ZiaranAK,KonradA.(2002).AnonlinearadaptationmethodofeliminationofpowerlineinterferenceinECG signals. IEEE. Trans. Biomed. Eng. 49:540-547.
[3] DotsinskyI,StoyanovT.(2005).PowerlineinterferencecancellationinECGsignals.Biomed.Instruc.Techn., 39: 155-162.
[4] Christov II. (2000). Dynamic powerlineinterferencesubtraction for biosignals.J. Med.Eng.Tech.,24:169-172. DeSimone DN, KundelHL,ArensonAL. (1988).Effect ofdigitalimagingnetworkonphysicianbehaviorinan intensive careunit.Radiology, 169: 41-44.
Research Development Cell, Government College of Engineering, Jalagon (M. S), India
[6] GravensteinJS.(1986).Isthereminimalessentialmonitoring?AnesthesiaPatientSafetyFoundationewsletter, (March): 2-3.
[7] MetingvanRijn,PeperA,GrimbergenCA.(1990).Highqualityrecordingofbioelectricalevents,Part1. Interferencereduction theory& practice. Med. Biol.Eng.Comput., 28:389-397.
[8] ToweBC.(1981).CommentsonGroundFreeEEGRecordingwithTowElectrodes.IEEETrans.Biomed.Eng., 28: 838-839.
[9] Mc Manus CD, Neuber KD, Cramer E. (1993). Characterization and elimination of AC noises in electrocardiogram: a comparison of digital fillingmethod.Comput Biomed Res,26: 48-67
[10] Arefian NM, SeddighiAS,SeddighiA.(2007). Clinical Analysis ofEEG Parameters In Prediction Of TheDepth OfAnesthesiaInDifferentStages:AComparativeStudyTheInternetJournalofAnesthesiology.Volume15 Number 1;23-26.
[11] SaberiH,SeddighiA,FarmanzadF.(2007).Finiteelementanalysisofanelasticmodelofthebrain:Distortion
duetoacuteepiduralhematoma.Theroleoftheintraventricularpressuregradient.ComputAidedSurg.Mar; 12(2):131-6.
[12] AmirSaiedSeddighi, “Developing a Bedside Softwarefor Digitizing Paper Based MedicalData in Intensive Care Settings,” GlobalJournal ofHealthScience, Vol. 3,No.1;April2011, pp-9-19.
[13] S. M. Lobodzinski, U. Teppner, and M. Laks. State of the art techniques for the preservation and reuse of hard copy electrocardiograms. Journal of Electrocardiology, 36:151–155, 2003.
[14] TanveerSyeda-Mahmood,David Beymer and Fei Wang,"Shape-based
matchingofECGRecordings'',IEEEInterationalConferenceonEngineeringinMediceandBiology, 2007.
[15] “Novel Tool for Complete DigitizationofPaperElectrocardiography Data”Lakshminarayan Ravichandran,ChrisHarless,AmitJ.Shah, CarsonA.Wick, JamesH. Mcclellan,AndSriniTridandapani.
[16] Lawson,WT.,Wagner,GS.,Startt-Selvester, RS., andYbarra, GA., “NewmethodforDigitizationand Computerized Analysisof Paper Recordings ofStandard 12-Lead Electrocardiograms”, Computers in Cardiology, IEEE, pp. 41-44,1995.
[17] “ECG PaperRecordsDigitizationthroughImageProcessing Techniques”, DeepakKumarGarg, Diksha Thakur, SeemaSharma, ShwetaBhardwaj,International Journal of Computer Applications (0975 – 888) Volume 48– No.13,June2012.
[18] “ImageProcessingonECGChartforECGSignalRecovery”,TW Shen,TFLaioTzuChi University,Hualien,Taiwan,Computersin
Cardiology2009;36:725−728.
[19] “ConvertingECG andOtherPaper LegatedBiomedical Maps into DigitalSignals”, A.R.GomeseSilva, H.M.deOliveira,andR.D. Lins,FederalUniversityofPernambuco-UFPE,SignalProcessing Group.
[20] “ECGScan: amethodfor conversionof paperelectrocardiographic printouts to digitalelectrocardiographicfiles”,Fabio Badilini,PhD,T, TanjuErdem,PhD,WojciechZareba,MD,ArthurJ.Moss,F.Badilini etal./Journal of Electrocardiology38(2005)310– 318.
[21] “ElectrocardiogramDisplayDataCapturingandDigitizationBased onImageProcessingTechniques”LaiKhinWee,EkoSupriyanto, New Aspects Of Applied Informatics, Biomedical Electronics &InformaticsAnd Communications,ISBN: 978-960-474-216-5.
[22] Fei Wang Tanveer Syeda-Mahmood David Beymer, “Information Extraction from Multimodal ECG Documents,” 10th International Conference on Document Analysis and Recognition, 2009.
[23] Jalel Chebil, Jamal Al-Nabulsi, Mohammed Al-Maitah, “A Novel Method for Digitizing Standard ECG Papers,” Proceedings of the International Conference on Computer and Communication Engineering, May 2008, Kuala Lampur, Malaysia.
[24] Rafael C. Gonzalez and Richard E. Woods,, “Digital Image Processing (3rd Edition)”, Prentice Hall, 2008.
[25] P. Soille, Morphological Image Analysis: Principles and Applications, Engineering Online Library. Springer, Berlin, Germany, 2nd edition, 2003.
[26] R. L. Stevenson and G. R. Arce, “Morphological filters: statistics and further syntactic properties,” IEEE Transactions on Circuits and Systems, vol. 34, no. 11, pp. 1292–1305, 1987.
[27] Lam, L., Seong-Whan Lee, and Ching Y. Suen, "Thinning Methodologies-A Comprehensive Survey," IEEE Transactions on Pattern Analysis and Machine Intelligence, Vol 14, No. 9, September 1992.
[28] SrinivasanJayaraman,Prashanth Swamy, VaniDamodaranandN.Venkatesh, “ANovelTechniqueforECGMorphology
InterpretationandArrhythmiaDetection BasedonTimeSeriesSignalExtracted fromScannedECGRecord” Innovation Labs, Tata Consultancy Services, Bangalore India.
[29] KaoT,Len-Jon Hwang,Yui-Han Lin,Tzong-HueiLin and Chia-HungHsiao, "Computer AnalysisoftheElectrocardiogramsfrom ECGPaperrecordings",Proceedingsof the23rd AnnualEMBSInternationalConference,Istanbul,Turkey,pp.3232-3234,2001.
[30] L.E.Widman, G.L.Freeman, A-to-Dconversion from paper records with a desktop scanner and microcomputer, Computers and Bio- medical Research22(4) (1989)393–404.
[31] Prashanth Swamy, Srinivasan Jayaraman, and M.Girish Chandra, An Improved Method for Digital Time Series Signal Generation from Scanned ECG Records, International Conference on Bioinformatics and Biomedical Technology, pp. 400-403, 2010.
[32] Morales, E.; Sevilla, D. ; Pierluissi, J.H. ; Nazeran, H. , “Digitization and Synchronization Method for Electrocardiogram Printouts”, Engineering in Medicine and Biology Society, 2005. IEEE-EMBS 2005. 27th Annual International Conference of the, 17-18 Jan. 2006, pp. 1588 – 1591.
[33] HussainK.Khleaf,KamarulHawariGhazali,Ahmed N. Abdalla, “Features ExtractionTechnique forECGRecording Paper,”
ProceedingoftheInternationalConferenceonArtificialIntelligenceinComputerScienceand
ICT(AICS2013),25-26November2013,Langkawi,MALAYSIA.(e-ISBN978-967-11768-3-2).
Research Development Cell, Government College of Engineering, Jalagon (M. S), India
[35] Otsu,N.,(1979).Athresholdselectionmethodfromgray-levelhistograms.IEEETransactions on Systems, Man, and Cybernetics, 9(1):62-66. [36] H. Bhullar, D. deBono, J Forthergill, and N. Jones, “A computer based system for the study of QT intervals,” Computer in Cardiology, pages
533-536, 1992.
[37] ShahSarvilA,V. V. Shete, “DigitizationofBio-MedicalSignalsfromHardPaperPrintouts,”
ITSITransactionsonElectricalandElectronicsEngineering(ITSI-TEEE), 2320 – 8945,Volume-2,Issue-2,2014. [38] Semi-log transformation of data,
http://wmueller.com/precalculus/families/semilog.html
[39] Log–log plot - Wikipedia, the free encyclopedia, https://en.wikipedia.org/wiki/Log-log_plot.
[40] Charles R. Giardina and Edward R. Dougherty. Morphological Methods in Image and Signal Processing. Prentice-Hall, Inc., 1988. [41] Petros Maragos. "Tutorial on Advances in Morphological Image Processing and Analysis". Optical Engineering, 26(7):623{632, July 1987. [42] Malay K. Kundu Bhabatosh Chanda and Y. Vani Padmaja. "A Multiscale Morphologic Edge Detector". Pattern Recognition,
31(10):1469{1478, 1998.
[43] Xudong Song and Yrjo Neuvo. "Robust Edge Detector based on morphological _lters". Pattern Recognition Letters, 14:889{894, 1993. [44] Chuang Gu and Ming-Chieh Lee. "Semantic Video Object Segmentation and Tracking Using Mathematical Morphology and Perspective
Motion Model", IEEE Proceeding, pages 514{517, 1997.
[45] John M. Gauch. "Image Segmentation and Analysis via Multiscale Gradient Watershed Hierarchies". IEEE. Trans. on Image Processing, 8(1):69{79, January 1999.
[46] Dong Yun Sang Ho Park and Sang Uk Lee. "Color Image Segmentation Based on 3D Clustering: Morphological Approach". Pattern Recognition, 31(8):1061- 1076, 1998.
[47] Philippe Salembier. "Morphological Multiscale Sgementation for Image Coding". Signal Processing, 38:359{386, 1994.
[48] Mary L. Comer and Edward J. Delp. "An Empirical Study of Morphological Operators in Color Image Enhancement". Proceedings of the SPIE Conference on Image Processing Algorithms and Techniques III, 1657:314{325, 1992.
[49] J. Serra. Image Analysis and Mathematical Morphological. Academic Press Inc., 1982.
[50] Ravichandran L, Harless C, Shah AJ, Wick CA, McClellan JH, Tridandapani S.. Novel Tool for Complete Digitization of Paper Electrocardiography Data. Translational Engineering in Health and Medicine;2013.
[51] Chiang CC, Yang YC, Tzeng WC, Tseng WD, Hsieh JC. An SCP compatible 12-lead electrocardiogram database for signal transmission storage, and analysis. In Computers in Cardiology; 2004 September;pp. 621-624.
[52] BOUSSAA Mohameda, ATOUF Issama, ATIBI Mohameda, BENNIS Abdellatifa, ECG image classification in real time based on the haar-like featuresand artificial neural networks, 32-39, ELESVER