DOI: 10.1534/genetics.109.109892
Multiple Functional Domains of the Yeast l,3-
b
-Glucan Synthase
Subunit Fks1p Revealed by Quantitative Phenotypic Analysis
of Temperature-Sensitive Mutants
Hiroki Okada,*
,1Mitsuhiro Abe,*
,1Masayo Asakawa-Minemura,* Aiko Hirata,* Hiroshi Qadota,
†Kana Morishita,
†Shinsuke Ohnuki,* Satoru Nogami* and Yoshikazu Ohya*
,2*Department of Integrated Biosciences, Graduate School of Frontier Sciences, University of Tokyo, Kashiwanoha, Kashiwa, Chiba 277-8562, Japan and†Department of Biological Sciences, Graduate School of Science,
University of Tokyo, Hongo, Bunkyo-ku, Tokyo 113-0033, Japan Manuscript received September 23, 2009
Accepted for publication January 20, 2010
ABSTRACT
The main filamentous structural component of the cell wall of the yeastSaccharomyces cerevisiaeis 1,3-b-glucan, which is synthesized by a plasma membrane-localized enzyme called 1,3-b-glucan synthase (GS). Here we analyzed the quantitative cell morphology and biochemical properties of 10 different temperature-sensitive mutants ofFKS1, a putative catalytic subunit of GS. To untangle their pleiotropic phenotypes, the mutants were classified into three functional groups. In the first group, mutants fail to synthesize 1,3-b-glucan at the proper subcellular location, although GS activity is normalin vitro. In the second group, mutants have normal 1,3-b-glucan content but are defective in polarized growth and endocytosis. In the third group, mutations in the putative catalytic domain of Fks1p result in a loss of the catalytic activity of GS. The differences among the three groups suggest that Fks1p consists of multiple domains that are required for cell wall construction and cellular morphogenesis.
T
HE cell wall is a rigid extracellular structure in plants and fungi that defines cell morphology. In the cell wall of the yeast Saccharomyces cerevisiae, the major structural components are 1,3-b-glucan, 1,6-b-glucan, chitin, and mannoproteins (Cabib et al. 2001). 1,3-b -glucan, which is the most abundant component of the cell wall, is essential for the rigidity of yeast cells.The enzyme responsible for synthesis of 1,3-b-glucan is 1,3-b-glucan synthase (GS). Yeast GS is composed of at least two subunits: a putative catalytic subunit and a regulatory subunit. The catalytic subunit is Fks1p, a membrane-localized protein (Douglas et al. 1994). Fks1p and its alternative protein Fks2p share 88% similarity, including the region of the putative catalytic domain (Mazur et al. 1995; Kelly et al. 1996). The simultaneous deletion of both genes results in a lethal phenotype, indicating that yeast GS is essential (Inoue et al.1995). Fks1p is localized to the plasma membrane at the site of cell wall remodeling (Utsugiet al.2002). The regulatory subunit is Rho1p, a Rho-type small GTPase, which is essential for vegetative growth (Drgonovaet al. 1996; Mazurand Baginsky1996; Qadotaet al.1996).
Rho1p acts as a molecular switch and its GTP-bound form specifically activates GS.
In addition to its function in 1,3-b-glucan synthesis, Fks1p has been suggested to have other functions, since deletion of FKS1 results in pleiotropic defects not only in alteration of cell wall structures such as 1,6-b -glucan (Dijkgraaf et al.2002), mannoproteins (Ram et al. 1995), and chitin (Dallies et al. 1998; Garcia -Rodriguezet al.2000), but also in endocytosis, which is unrelated to cell wall biogenesis (deHartet al.2003).
Because GS and its subunits have multiple functions and their absence causes pleiotropic defects, the phys-iological functions of GS in cell morphogenesis have remained unclear. Conditional-lethal mutations have been induced in the regulatory subunit of GS and characterized to elucidate the function of Rho1p (Yamochiet al. 1994; Ozakiet al.1996; Qadotaet al. 1996; Drgonovaet al.1999; Sakaet al.2001; Rohet al. 2002). It has been revealed that the differentrho1 mu-tations cause distinctive effects on cellular growth, likely because Rho1p binds to and activates some effectors including Fks1p and Fks2p (Mazurand Baginsky1996; Inoue et al. 1999). In contrast, few conditional-lethal mutations in the catalytic subunit of GS have so far been investigated (Dijkgraafet al. 2002; Suzukiet al. 2004). To untangle the complex effects of loss of gene functions, quantitative and high-resolution phenotypic analysis is a powerful approach. Yeast cell morphology is one of the most useful phenotypes for such analysis
Supporting information is available online athttp://www.genetics.org/ cgi/content/full/genetics.109.109892/DC1.
1These authors contributed equally to this work.
2Corresponding author:Department of Integrated Biosciences, Graduate
School of Frontier Sciences, University of Tokyo, Bldg. FSB-101, 5-1-5 Kashiwanoha, Kashiwa, Chiba 277-8562, Japan.
E-mail: [email protected]
because it reflects various cellular events, such as cell cycle progression, establishment of cell polarity, and regulation of cell size (Niand Snyder 2001; Giaever et al. 2002; Jorgensen et al. 2007). Previously, we developed an image processing program named CalMorph that automatically processes digital images of each yeast cell into quantitative data (Ohtaniet al. 2004). Cells were photographed with simultaneous staining of mannoproteins (as a cell wall component marker), actin patches, and nuclear DNA for quantifi-cation of cell morphology. By using this system, we analyzed 4718 yeast nonessential gene deletion mutants and showed that approximately half of them have altered cell morphology (Ohyaet al.2005). Moreover, it has been reported that hierarchical cluster analysis based on similarities in cell morphology is a useful method for elucidating functional correlations of gene products (Ohnukiet al.2007).
In this study, to understand the physiological functions of GS, we isolated 10 different temperature-sensitive (ts) fks1 alleles in an fks2D background and characterized the phenotypes associated with the mutations. Quanti-tative and high-resolution phenotypic analysis of the fks1 mutants revealed that they could be statistically classified into three groups. Our results suggested that Fks1p consists of multiple domains required for cellular morphogenesis.
MATERIALS AND METHODS
Media and strains:Yeast growth, tetrad analysis, and mating-type determination were performed as described previously (Kaiseret al.1994). Yeast transformation was carried out using the lithium acetate method (Itoet al.1983). Yeast cells were grown in rich media (YPD) [1% Bacto yeast extract (Difco, Detroit), 2% polypeptone (Wako Chemicals, Osaka, Japan), and 2% glucose (Wako Chemicals)] or in synthetic growth media (SD) [0.67% yeast nitrogen base without amino acids (Difco) and 2% glucose] supplemented appropriately. For Ura or Trp selection, 0.5% casamino acid (Difco) was added to SD. To induce the expression ofGAL1 promoter-driven FKS1, 2% galactose and 0.1% sucrose were used as carbon sources instead of glucose (SGS). Standard procedures were used for all DNA manipulations and Escherichia coli transformation (Sambrooket al.1989). The yeast strains used are listed in Table 1. All strains are isogenic derivatives of YPH499, YPH500, or YPH501 (Sikorskiand Hieter1989). YOC792 and YOC793 were constructed by disruption of both FKS1and FKS2in YPH499 and YPH500 carrying a plasmid pYO916 (GAL1promoter-FKS1,URA3marker), respectively.
Plasmids:The plasmids used in this study are listed in Table 2. pYO973 was generated by cloning theSphI-NheI fragment of YEp-GSC1 into pSN314. pYO975 was generated by replacing the MscI-SalI region of pYO973 with an MscI-SalI linker. pYO976 was generated by replacing theSalI-SacI region of pYO973 with an SalI-SacI linker. pYO977 was generated by replacing theSacI-AatII region of pYO973 with a SacI-AatII linker. pYO978 was generated by replacing the AatII-NarI region of pYO973 with an AatII-NarI linker. pYO979 was generated by deleting the BglII-BglII region of pYO973. pYO980 was generated by blunting theKpnI site of pRS314. pYO981 was generated by cloning theSphI-NheI fragment of
pYO1751 (Inoueet al. 1995), containing the genomicFKS1 gene, into pYO980. pYO982 was generated by deleting the KpnI-KpnI region of pYO981. Construction of plasmids pYO2163–pYO2173 is described below.
Isolation of ts fks1mutants:To isolate tsfks1mutants, the random mutations were introduced across the entire FKS1 region by the error-prone PCR method (Cadwelland Joyce 1992). The procedure involves amplification of the FKS1 region under mutagenic PCR conditions. The mutagenic PCR cycle is as follows: (94°for 20 sec, 68°for 4 min)330 cycles, (92°for 1 min, 60°for 1 min, 72°for 2 min)330 cycles, and (75°for 10 min)31 cycle. The amplified PCR fragment andKpnI-digested vector (YOC982) were used for cotransfor-mation of YOC792 (fks1D fks2D and carrying the pYO916 plasmid). About 8600 transformants were obtained on glucose plates (Trp,Ura). Next, 1000 transformants were chosen, streaked on YPD plates, and incubated at 23°and 37°to screen for ts mutants. The candidates were selected on a plate containing 5-fluoroorotic acid (5-FOA) to eliminate the pYO916 plasmid. After rescue of the mutagenized plasmids, these plasmids were used for retransformation of YOC792 to confirm the phenotype. Finally, 17 alleles were isolated.
Subcloning of tsfks1alleles:To determine the mutation(s) that is responsible for the temperature sensitivity, thefks1ts alleles were subcloned into plasmids pYO975–pYO979 to producefks1alleles that were mutated only in the restricted regions. The resultant plasmids were transformed into the YOC792 strain, and the transformants were selected on SGSTrp plates at 23°. Transformants were patched onto duplicate YPD plates, and the plates were incubated at 23°and 37°. The region responsible for the temperature sensitivity of the original fks1 allele was determined by checking the temperature sensitivity of the subclones.
Out of the 17 originalfks1alleles, 10 showed temperature sensitivity after subcloning. Plasmids carrying the ts mutations were digested withSphI andNheI, and the resultant fragment was cloned into plasmid pYO969 to produce plasmids pYO2163–pYO2173. These plasmids were digested withSacII and transformed into YOC792 to integrate thefks1subcloned allele into theADE3locus. The transformants were selected on SGSTrp11/3Ade plates and white colonies were selected for appropriate integrants. The colonies were patched onto the plate containing 5-FOA to eliminate the original pYO916 plasmid. The resulting strains (YOC1001, -1002, and -1071– 1090) were used for further analysis.
Quantification of cellular morphology: To reduce the possibility that cell morphology was changed by unexpected mutation(s), we quantified the cell morphology of homoallelic diploids of 10fks1mutants (YOC4318–4328). Yeast strains were cultured at 25°in YPD media until the early log phase and shifted for 4 hr at 35.5°. After incubation, cells were fixed and specifically stained for three components: fluorescein isothio-cyanate concanavalin A (FITC-Con A) (Sigma, St. Louis), rhodamine–phalloidin (Invitrogen, Carlsbad, CA), and 49 ,6-diamidino-2-phenylindole (Wako Chemicals) to stain the mannoprotein, actin, and nucleus, respectively. Cells were observed and images were captured using AxioImager M1 with a 1003Plan-Apochromat objective lens (Carl Zeiss, Oberko-chen, Germany) equipped with a CoolSNAP HQ cooled-CCD camera (Roper Scientific) and AxioVision software (Carl Zeiss). The images were analyzed by the image processing software CalMorph version 1.3 as described previously (Ohya et al.2005).
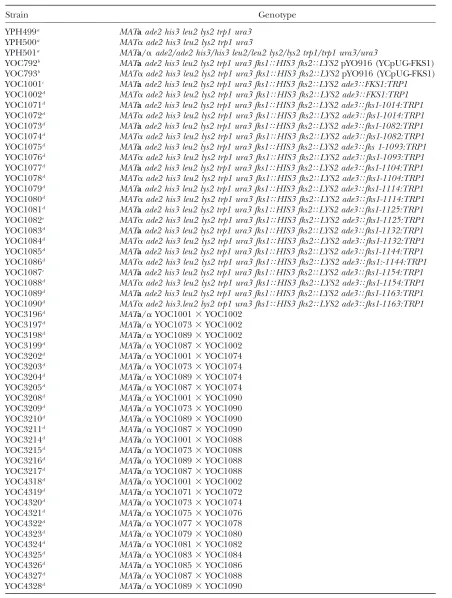
TABLE 1
Yeast strains used in this study
Strain Genotype
YPH499a MATaade2 his3 leu2 lys2 trp1 ura3
YPH500a MATaade2 his3 leu2 lys2 trp1 ura3
YPH501a MATa/aade2/ade2 his3/his3 leu2/leu2 lys2/lys2 trp1/trp1 ura3/ura3
YOC792b MATaade2 his3 leu2 lys2 trp1 ura3 fks1
THIS3 fks2TLYS2pYO916 (YCpUG-FKS1)
YOC793b MATaade2 his3 leu2 lys2 trp1 ura3 fks1
THIS3 fks2TLYS2pYO916 (YCpUG-FKS1)
YOC1001c MATaade2 his3 leu2 lys2 trp1 ura3 fks1
THIS3 fks2TLYS2 ade3TFKS1:TRP1
YOC1002d MATaade2 his3 leu2 lys2 trp1 ura3 fks1
THIS3 fks2TLYS2 ade3TFKS1:TRP1
YOC1071d MATaade2 his3 leu2 lys2 trp1 ura3 fks1
THIS3 fks2TLYS2 ade3Tfks1-1014:TRP1
YOC1072d MATaade2 his3 leu2 lys2 trp1 ura3 fks1
THIS3 fks2TLYS2 ade3Tfks1-1014:TRP1
YOC1073d MATaade2 his3 leu2 lys2 trp1 ura3 fks1
THIS3 fks2TLYS2 ade3Tfks1-1082:TRP1
YOC1074d MATaade2 his3 leu2 lys2 trp1 ura3 fks1
THIS3 fks2TLYS2 ade3Tfks1-1082:TRP1
YOC1075d MATaade2 his3 leu2 lys2 trp1 ura3 fks1
THIS3 fks2TLYS2 ade3Tfks 1-1093:TRP1
YOC1076d MATaade2 his3 leu2 lys2 trp1 ura3 fks1
THIS3 fks2TLYS2 ade3Tfks1-1093:TRP1
YOC1077d MATaade2 his3 leu2 lys2 trp1 ura3 fks1
THIS3 fks2TLYS2 ade3Tfks1-1104:TRP1
YOC1078d MATaade2 his3 leu2 lys2 trp1 ura3 fks1
THIS3 fks2TLYS2 ade3Tfks1-1104:TRP1
YOC1079d MATaade2 his3 leu2 lys2 trp1 ura3 fks1
THIS3 fks2TLYS2 ade3Tfks1-1114:TRP1
YOC1080d MATaade2 his3 leu2 lys2 trp1 ura3 fks1
THIS3 fks2TLYS2 ade3Tfks1-1114:TRP1
YOC1081d MATaade2 his3 leu2 lys2 trp1 ura3 fks1
THIS3 fks2TLYS2 ade3Tfks1-1125:TRP1
YOC1082e MATaade2 his3 leu2 lys2 trp1 ura3 fks1
THIS3 fks2TLYS2 ade3Tfks1-1125:TRP1
YOC1083d MATaade2 his3 leu2 lys2 trp1 ura3 fks1
THIS3 fks2TLYS2 ade3Tfks1-1132:TRP1
YOC1084d MATaade2 his3 leu2 lys2 trp1 ura3 fks1
THIS3 fks2TLYS2 ade3Tfks1-1132:TRP1
YOC1085d MATaade2 his3 leu2 lys2 trp1 ura3 fks1
THIS3 fks2TLYS2 ade3Tfks1-1144:TRP1
YOC1086d MATaade2 his3 leu2 lys2 trp1 ura3 fks1
THIS3 fks2TLYS2 ade3Tfks1:-1144:TRP1
YOC1087c MATaade2 his3 leu2 lys2 trp1 ura3 fks1
THIS3 fks2TLYS2 ade3Tfks1-1154:TRP1
YOC1088d MATaade2 his3 leu2 lys2 trp1 ura3 fks1
THIS3 fks2TLYS2 ade3Tfks1-1154:TRP1
YOC1089d MATaade2 his3 leu2 lys2 trp1 ura3 fks1
THIS3 fks2TLYS2 ade3Tfks1-1163:TRP1
YOC1090d MATaade2 his3.leu2 lys2 trp1 ura3 fks1
THIS3 fks2TLYS2 ade3Tfks1-1163:TRP1
YOC3196d MATa/aYOC10013YOC1002
YOC3197d MATa/aYOC10733YOC1002
YOC3198d MATa/aYOC10893YOC1002
YOC3199d MATa/aYOC10873YOC1002
YOC3202d MATa/aYOC10013YOC1074
YOC3203d MATa/aYOC10733YOC1074
YOC3204d MATa/aYOC10893YOC1074
YOC3205d MATa/aYOC10873YOC1074
YOC3208d MATa/aYOC10013YOC1090
YOC3209d MATa/aYOC10733YOC1090
YOC3210d MATa/aYOC10893YOC1090
YOC3211d MATa/aYOC10873YOC1090
YOC3214d MATa/aYOC10013YOC1088
YOC3215d MATa/aYOC10733YOC1088
YOC3216d MATa/aYOC10893YOC1088
YOC3217d MATa/aYOC10873YOC1088
YOC4318d MATa/aYOC10013YOC1002
YOC4319d MATa/aYOC10713YOC1072
YOC4320d MATa/aYOC10733YOC1074
YOC4321d MATa/aYOC10753YOC1076
YOC4322d MATa/aYOC10773YOC1078
YOC4323d MATa/aYOC10793YOC1080
YOC4324d MATa/aYOC10813YOC1082
YOC4325d MATa/aYOC10833YOC1084
YOC4326d MATa/aYOC10853YOC1086
YOC4327d MATa/aYOC10873YOC1088
YOC4328d MATa/aYOC10893YOC1090 a
Sikorskiand Hieter(1989).
b
Qadotaet al. (1996).
c
Sekiya-Kawasakiet al. (2002).
d
This study.
e
observations were ranked together with the lowest values first. Note that the same values were ranked in average order. Then, we summed the rank order of samples toRiand computedRi9, which is a modifiedRistatistic defined by the function
Ri9¼Ri
niðN11Þ
2 ;
whereniis the number of observations in theith sample and N is the number of observations in all samples combined (Sni).
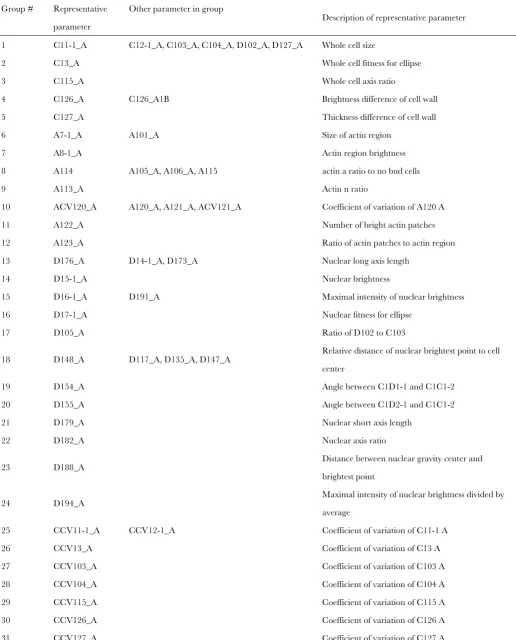
Parameter reduction:Because some of the 501 parameters that are outputs of CalMorph (detailed in SCMD, http:// scmd.gi.k.u-tokyo.ac.jp/datamine/) are not independent (Ohya et al. 2005), we reduced parameters by eliminating redundancy. The redundancy among parameters was esti-mated by Spearman’s rank correlation coefficient (R) between an arbitrary 2 of 501 parameter values obtained by quantifica-tion of cellular morphology of the wild-type (WT) strain (n¼ 20). Two hundred twenty-one of the 501 parameters were regarded to be correlated with at least one other parameter at R . 0.9 (P , 0.01 with Bonferroni correction). The 221 parameters were classified into 75 groups where each group consisted of the parameters whose correlation coefficient to each other is.0.9. Then, the representative parameter of each group was defined as a parameter whose sum of theRvalues was maximum among parameters of each group. Finally, we combined the representative 75 parameters with the resting 280 of 501 parameters into 355 parameters that were used in this study (supporting information,Table S1).
Statistical analysis:All statistical analyses of the quantified morphological data were performed using R ver. 2.7.0 (http:// www.r-project.org/).
Measurement of GS activity of the membrane fraction:The membrane fraction was prepared as described previously (Abe et al.2001). In brief, log-phase cultures were resuspended in 1 mm EDTA and 500 mm NaCl containing 1 mm phenyl-methylsulfonyl fluoride and lysed with glass beads. The crude lysate was centrifuged at 15003gfor 5 min so that cell debris and unbroken cells were separated. After centrifugation at 100,0003gfor 30 min, the pellet was suspended in a buffer containing 50 mmTris–HCl (pH 7.5), 1 mmEDTA, and 33% glycerol, and the suspension was taken as the membrane fraction. GS activity was measured according to the procedure described previously (Inoueet al.1995).
Incorporation of [14C]glucose into 1,3-b-glucan: As
de-scribed previously (Abeet al.2003), cells were grown to early log phase at 25° and were then cultured at either the permissive or the restrictive temperature for 2 hr. The cultured cells were diluted to OD600of 0.5 with 1 ml of 0.5% glucose media containing 10mCi of [14C]glucose and labeled for 2 hr. The labeled cells were harvested and extracted with 1 N NaOH at 80°for 30 min. The insoluble pellets were resuspended in 10 mmTris–HCl, pH 7.5, containing 5 mg/ml Zymolyase 100T (Seikagaku, Tokyo) and incubated at 37° for 20 hr. After digestion, the zymolyase-resistant material was removed by centrifugation (15,0003gfor 20 min) and the supernatant was filtered through an Amicon Centricon YM-10 membrane (molecular weight cutoff is 10,000; Millipore, Bedford, MA). The flow-through fraction was dried by a vacuum evaporator and applied to Unifilter-GF/C (Packard Instrument Co.). The differences in the incorporation rates in strains were normal-ized by DOD600, measured before and after the labeling period. Since a significant value ofDOD600was required for the normalization, we preferred to use the mild condition (34°) as the restrictive temperature.
TABLE 2
Plasmids used in this study
Name Parent plasmid Markers
pYO916 (YCpUG-FKS1)a pRS316 GALp-FKS1,URA3,CEN
pYO969 (YIpTade3SNA)b TRP1
pYO973 (pSN314-GSC1)b pRS314 FKS,TRP1,CEN
pYO975 (pSN314-GSC1MS)b pYO973 TRP1,CEN
pYO976 (pSN314-GSC1DSS)b pYO973 TRP1,CEN
pYO977 (pSN314-GSClDAvrII)b pYO973 TRP1,CEN
pYO978 (pSN314-GSClDAN)b pYO973 TRP1,CEN
pYO979 (pSN314-GSClDB)b pYO973 TRP1,CEN
pYO980 (pQR314DK)b pRS314 TRP1,CEN
pYO981 (pQR314DK-GSCl)b pYO980 FKS1,TRP1,CEN
pYO982 (pQR314DK-GSClDK)b pYO981 FKS1,TRP1,CEN
pYO1751 (YEp-GSC1)a YEp213 FKS1,TRP1, 2morigin
pYO2163 (YIpTade3SNA-FKS1)b pYO969 FKS1,TRP1
pYO2164 (YIpTade3SNA-1014)b pYO969 fks1-1014,TRP1
pYO2165 (YIpTade3SNA-1082)b pYO969 fks1-1082,TRP1
pYO2166 (YIpTade3SNA-1093)b pYO969 fks1-1093,TRP1
pYO2167 (YIpTade3SNA-1104)b pYO969 fks1-1104,TRP1
pYO2168 (YIpTade3SNA-1114)b pYO969 fks1-1114,TRP1
pYO2169 (YIpTade3SNA-1125)b pYO969 fks1-1125,TRP1
pYO2170 (YIpTade3SNA-1132)b pYO969 fks1-1132,TRP1
pYO2171 (YIpTade3SNA-1144)b pYO969 fks1-1144,TRP1
pYO2172 (YIpTade3SNA-1154)b pYO969 fks1-1154,TRP1
pYO2173 (YIpTade3SNA-1163)b pYO969 fks1-1163,TRP1
a
Inoueet al. (1995).
b
Morphological observations: For cell wall staining of yeast cells, early log-phase cells were harvested by centrifugation. For aniline blue staining, the cells were washed twice with PBS and mildly sonicated for 10–20 sec. The washed cells were incubated in 0.05% aniline blue (Wako Chemicals) for 5 min and observed by fluorescence microscopy with an Olympus (Tokyo) U-MNV DM455 filter set (excitation wavelength, 400– 410 nm; emission wavelength, 455 nm). For calcofluor white staining, the cells were washed twice in distilled water (DW) and mildly sonicated. The washed cells were incubated in 1 mg/ml calcofluor white (Sigma) for 5 min, washed twice with DW, and then observed. For FITC-Con A staining, the cells were washed twice with P buffer (10 mmsodium phosphate, pH 7.2, 150 mmNaCl). The washed cells were incubated in 0.1 mg/ml FITC-Con A in P buffer for 10 min, washed twice with P buffer, and then observed.
Cells were viewed on an Olympus BX-FLA microscope or a Leitz DMR microscope (Leica, Wetzlar, Germany). Images were captured using a CoolSNAP HQ CCD camera (Nippon Roper, Tokyo) and Metamorph Imaging software (Universal Imaging). All images were processed for publication using Adobe Photoshop software.
Immunoelectron microscopic analysis: Thin sections of yeast cells were prepared by the freeze-substituted fixation method as described previously (Abe et al. 2003). For 1,3-b-glucan immunolabeling, a mouse monoclonal antibody against 1,3-b-glucan (Biosupplies, Parkville, Australia) and a secondary antibody conjugated with 10-nm gold particles were used. The labeled thin sections were viewed under an H7600 electron microscope (Hitachi, Tokyo) at 100 kV.
RESULTS
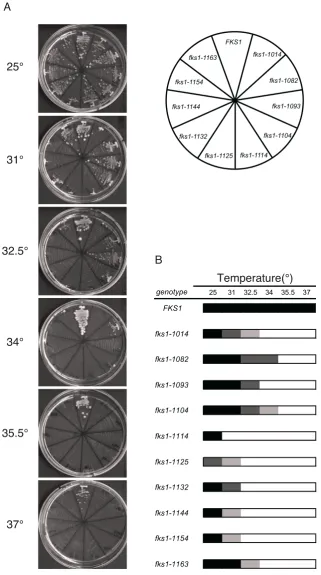
Isolation of 10fks1ts mutants:Yeast strains harboring
fks1ts mutations were generated by random mutagen-esis of theFKS1gene (seematerials and methods). Although all the mutants grew normally at 23°, they failed to grow above 35.5°(Figure S1). Subcloning and sequence analysis revealed that each mutant possessed from one to five mutations conferring temperature sensitivity (Table 3).
Cluster analysis of the cell morphology of the fks1
mutants: To classify thefks1mutants, we applied
hierar-chical cluster analysis based on cell morphology of mutants and the FKS1WT strain. Homoallelic diploids were incubated at 35.5°, stained with fluorescent dyes, and photographed (see materials and methods). In each sample, values for 501 morphological parameters were obtained by the CalMorph image-processing pro-gram (Figure S2). The experiments were replicated 5 times for mutants and 20 times for the WT. For using cluster analysis, we averaged the replicated data for each parameter value of each strain to obtain a standardized value (Ohnukiet al.2007, seematerials and methods). By hierarchical cluster analysis of the 501 parameters, we identified three classes with an approximately unbiased probability value (AUP-value: calculated using a multi-scale bootstrap technique) (Suzuki and Shimodaira 2006).0.95 (Figure 1A). Class I containsfks1-1082, fks1-1132, and WT; class II containsfks1-1163,fks1-1014, and fks1-1104; and class III containsfks1-1114,fks1-1144, fks1-1154, andfks1-1125. Onlyfks1-1093did not belong to any
of these classes. Interestingly, three of four class III mutants (fks1-1114,fks1-1144, andfks1-1154) possessed mutations in the putative catalytic domain (aa 829–973) (Kellyet al.1996).
In vitroGS activity of thefks1mutants:The GS activity in a membrane fraction of the class III (fks1-1114, fks1-1144, fks1-1154, and fks1-1125) cells was virtually re-duced after cultivation at 23°and 37°(Figure 2). Kinetic analysis of GS activity in these four mutants revealed a decreasedVmaxvalue at 37°(Table 4). Immunoblotting
analysis with an anti-Fks1p antibody revealed that the Fks1p levels of these four mutants were normal (data not shown), suggesting that none of the mutations affect Fks1p stability. These results suggested that the four class III mutants had lost the catalytic activity of GS. In contrast to these mutants, the other mutants did not show a clear decrease in the GS activity or theVmaxvalue,
suggesting that these mutations affect activities of GS other thanin vitroglucan synthesis.
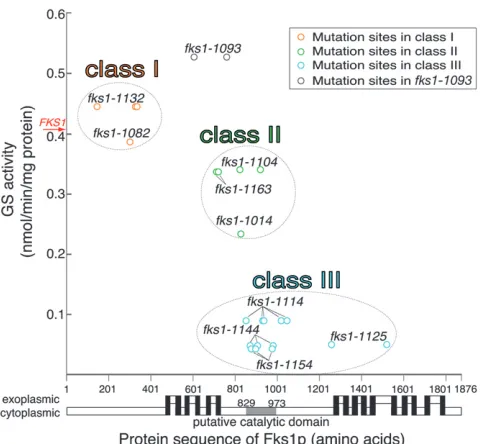
Correlation between in vitro GS activity and cell
morphology: To clarify the relationship between
muta-tion sites and GS activity, the GS activity of all mutants at the restrictive temperature was plotted along with the Fks1p protein sequence (Figure 3). In the diagram, mutants in the same class appeared near one another. Mutations of class I, which showed GS activity equivalent to WT, were located near amino acid 300. Although the class II and III mutations overlapped in location, they displayed difference in GS activities. Taken together, these data indicated that GS activity and mutation site location influence cell morphology.
To find cell morphological traits that are affected by GS activity, we scanned correlations between GS activity and the morphological parameters of all strains. To avoid redundancy among all 501 parameters, we reduced parameters according to the method described pre-viously (Ohya et al. 2005) (Table S1, see materials and methods). Then, 355 parameters were selected for further analysis. By linear regression analysis between values of GS activity at 37° and 355 parameters, 6 parameters were detected with a squared correlation
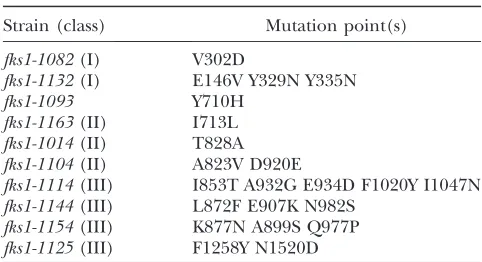
TABLE 3
Mutation points of the tsfks1mutants
Strain (class) Mutation point(s) fks1-1082(I) V302D
fks1-1132(I) E146V Y329N Y335N fks1-1093
fks1-1163(II) I713L fks1-1014(II) T828A fks1-1104(II) A823V D920E
fks1-1114(III) I853T A932G E934D F1020Y I1047N fks1-1144(III) L872F E907K N982S
fks1-1154(III) K877N A899S Q977P fks1-1125(III) F1258Y N1520D
coefficient (R2
).0.718 (P,0.001) (Table 5); the false discovery rate (FDR) estimated that,1 such parameter would have been detected by chance (Storeyet al.2004). Among the 6 parameters, 3 parameters were related to actin localization. For instance, a scatter plot of GS activity valuesvs.the values of morphological parameter A114 (proportion of cells with delocalized actin patches in unbudded cells, Figure 4) indicates a negative correlation between GS activity and actin localization. To confirm this result, we quantified the cell morphology of WT cells following echinocandin B (GS inhibitor)
treatment with concentrations of 0, 1, 2, 3, and 4 mg/liter (n ¼5) (S. Ohnuki, S. Oka, S. Nogamiand Y. Ohya, unpublished results). The parameter A114 was detected to show a significant dose-dependent increase atP-value ,0.01 by a Jonckheere–Terpstra trend test. Another actin-related parameter, A7-1_A1B (proportion of actin region in budded and mononucleic cells), also showed a significant dose-dependent increase. These results in-dicated that the GS activity influences actin localization.
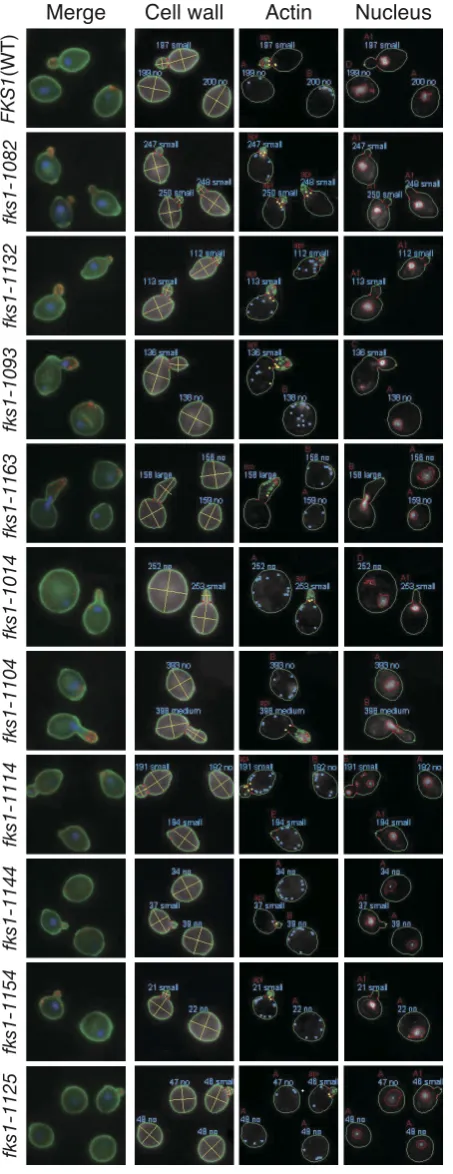
Morphological alteration in thefks1mutants: To test
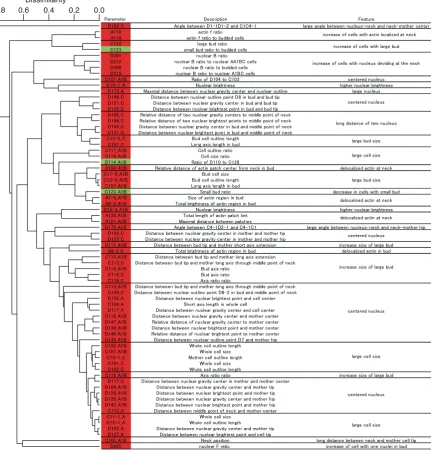
for other functional defects in each mutant, we charac-Figure1.—Cluster analysis of thefks1mutants based on similarities in cell morphology. (A) Three classes detected by cluster analysis. Dissimilarity indicates a positive angle (0°–180°) between the vectors of the 501 parameter values. Blue values indicate the AUP-value (calculated with the multiscale bootstrap technique) in the dendrogram. Orange rectangles indicate robustly clustered mutant classes with an AUP-value.0.95. Red and green boxes indicate modifiedRi9statistics reflecting morphological differences between cells (seematerials and methods). Positive and negative values of the modifiedR
terized the cell morphology of each class as shown in Figure 1A. We searched for morphological parameters showing similar values within the same class according to the method described previously (Ohnukiet al.2007) (P,0.001, Figure 1B). The numbers of such parameters were 96 in class I, 84 in class II, and 109 in class III; the FDR estimated that ,1 such parameter of each class would have been detected by chance. For example, class I mutants shared a smooth elliptical cell shape, a high population of budded cells, and localized actin cytoskel-eton; class II mutants shared a large depolarized cell shape, delocalized actin cytoskeleton in bud, a high population of cells with large buds, actin delocalization in bud, and irregular nuclear migration; class III mu-tants shared a small round cell shape, a high population of cells with small buds, and delocalized actin cytoskel-eton (Figure S3). These differences in representative features may indicate the existence of distinct functional defects among the classes offks1mutants. Then, we chose three mutants from each class as class-representative mutants (fks1-1082from class I,fks1-1163from class II, andfks1-1154from class III) for further analyses.
The class II and III mutants shared delocalized actin phenotype; we further observed the distribution of Spa2p, which localizes at the incipient bud site and bud tip and regulates polarized actin cytoskeleton (Ayscough et al. 1997). In the class II mutants, the Spa2p localization was lost (data not shown), suggesting that the class II mutants likely lose cell polarity leading to delocalized actin cytoskeleton.
In vivo 1,3-b-ghican synthesis in fks1 mutants: To investigate in vivo 1,3-b-glucan synthesis, [14C]glucose incorporation was measured at 25°or after being shifted to 34° for 2 hr (Figure 5A). At 25°, [14C]glucose
in-corporation into 1,3-b-glucan was highly decreased in class III fks1-1154cells. In contrast, at 34°1,3-b-glucan synthesis was slightly reduced infks1-1082andfks1-1163 cells and significantly reduced infks1-1154cells. These results suggest that in vivo 1,3-b-glucan synthesis was mildly reduced in mutants of both classes I and II.
To monitor the localization of synthesized 1,3-b-glucan, we stained cells with aniline blue (Figure 5B). The WT Figure2.—In vitroGS activity of membrane fractions
iso-lated fromfks1cells. Membrane fractions were isolated from cells cultured at 23°, and GS activity was assayed at 23°(left). Membrane fractions were isolated from the cells cultured at 23°and shifted to 37°for 2 hr, and GS activity was assayed at 30°(right). The data represent the means and standard de-viations of at least four experiments.
TABLE 4
KmandVmaxvalues of GS activity
Strain (class)
Km(mM)
Vmax
(nmol/min/mg protein)
23° 37° 23° 37°
FKS1(I) 0.38 0.62 5.64 4.16
fks1-1082(I) 0.49 0.79 4.11 4.74 fks1-1132(I) 0.40 0.71 5.63 5.19
fks1-1093 0.53 1.55 7.17 7.94
fks1-1163(II) 0.57 0.98 4.23 5.91 fks1-1014(II) 0.56 0.80 3.52 3.39 fks1-1104(II) 0.76 1.50 4.20 5.39 fks1-1114(III) 0.80 0.95 2.51 0.98 fks1-1144(III) 0.96 0.95 1.08 0.56 fks1-1154(III) 0.63 0.81 1.04 0.64 fks1-1125(III) 1.77 1.25 3.15 0.63
cells exhibited uniform staining of 1,3-b-glucan across the entire cell surface. At the restrictive temperature, the class Ifks1-1082 cells appeared to lose staining specifi-cally in the small bud. Although the class IIfks1-1163 cells had abnormal morphology, the cells exhibited the normal staining pattern across the entire cell surface. The class IIIfks1-1154cells displayed a tiny bud-like pro-jection and lost aniline blue staining at this propro-jection. These results suggested that the glucan in class I and III mutants is not synthesized at the proper locations.
Alteration of cell wall components in fks1 mutants:
To monitor the alteration of cell wall components, we stained mannoproteins and chitin, using FITC-Con A and calcofluor white, respectively (Figure 5B). Staining with FITC-Con A showed that signals were distributed uniformly on the cell surface at a higher level than WT, suggesting that the mutants have increased mannopro-teins. Staining with calcofluor white showed that strong chitin-staining signal appeared in the class IIfks1-1163 and the class IIIfks1-1154cells but not in the class I fks1-1082cells. These results suggested that cell wall struc-ture in thefks1mutants was altered.
Alteration was also observed in the ultrastructure of the cell wall in thefks1mutants by electron microscopy (Figure 6). In the class IIfks1-1163and class IIIfks1-1154 cells, the thickness of the cell wall was increased, and an abnormal layer was observed other than the 1,3-b-glucan layer.
Endocytosis defect in the fks1 mutants: Since actin
plays roles in endocytosis (Robertson et al. 2009), mutants defective in actin localization such as the class II and III mutants may have defective endocytosis. As expected, the class II fks1-1163 and class III fks1-1154 cells showed reduced levels of Lucifer yellow uptake in the vacuole, indicating that endocytosis is defective in these mutants (Figure 7). In contrast, in WT and class I fks1-1082 cells, Lucifer yellow was accumulated in the vacuole as a result of endocytosis. Defective endocytosis is known to induce a longer lifetime of Sla1-GFP (Kaksonenet al.2003). The Sla1-GFP lifetime infks1 mu-tants in classes II and III but not in class I was prolonged, suggesting defects in endocytosis (data not shown).
Intragenic complementation betweenfks1mutations:
Intragenic complementation is a genetic phenomenon in which diploid strains homozygous for the parental alleles do not grow at the restrictive temperature, but diploids bearing different recessive alleles (heteroallelic diploids) are able to grow. Intragenic complementation is often observed in mutants of multifunctional proteins (Ohya and Botstein 1994; Sakaet al. 2001; Yahara et al. 2001). At 34°, homoallelic diploids of the fks1 ts alleles grew weakly (class I: fks1-1082/fks1-1082) or did not grow (class II,fks1-1163/fks1-1163; and class III, fks1-1154/fks1-1154) (Table 6). Among heteroallelic diploids, the pairs fks1-1082/fks1-1163 and fks1-1163/ fks1-1154exhibited weak intragenic complementation. A different heteroallelic pair (fks1-1082/fks1-1154) did not show intragenic complementation. Thus, intragenic TABLE 5
Morphological parameters correlated with GS activity
Parameter Description R2value P-value
A114 Proportion of cells with delocalized actin patches in unbudded cells 0.858 4.22E-05 ACV8-1_A Coefficient of variation of A8-1 A (sum of the actin brightness in a mother cell) values 0.818 1.31E-04 DCV154_A1B Coefficient of variation of D154 A1B (angle between nucleus center to mother cell
center and mother cell hip to mother cell center) values
0.812 1.54E-04
D154_A1B Angle between nucleus center to mother cell center and mother cell hip to mother cell center in budded and mononucleic cells
0.760 4.72E-04
D155_A1B Angle between nucleus center to mother cell center and mother cell hip to mother cell center in budded and mononucleic cells
0.744 6.35E-04
A105 Proportion of cells with delocalized actin patches 0.718 9.97E-04
complementation dividesfks1mutants into at least two classes.
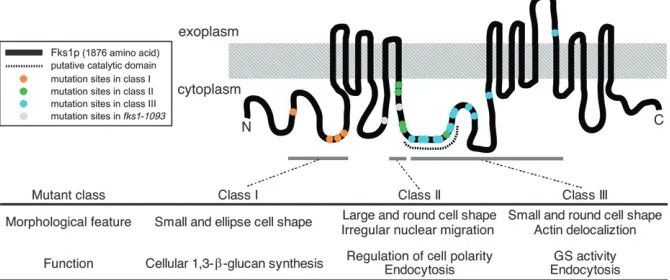
DISCUSSION
Fks1p, a putative catalytic subunit of GS, was function-ally dissected on the basis of quantitative and high-dimensional phenotyping of ts mutants. By hierarchical
cluster analysis of 501 morphological traits, we classified mutants into three functional groups. Extensive analyses of the mutants in each group revealed multiple func-tions of Fks1p that are required for cell wall construc-tion, organization of a cell polarity, and endocytosis (Figure 8). The N-terminal domain or the site of the class I mutations is responsible for cellular glucan syn-thesis. The N-terminal part of the central cytoplasmic region, to which class II mutations are localized, func-tions in polarized growth and endocytosis. The class III mutations localize to the putative catalytic domain at the cytoplasmic region, which is required for in vitro GS activity.
GS activity in class III mutants: Class III mutants
exhibited reduced GS activity with small Vmax values.
Since three of four class III mutations (fks1-1114, fks1-1144, and fks1-1154) are localized to the putative catalytic domain (aa 829–973) (Kellyet al.1996), the mutations likely affect the polymerization reaction, leading to reduced GS activity. The remaining class III mutant (fks1-1125) has mutations near the membrane-spanning region of the C terminus. Since this mutant exhibited an increasedKmvalue for GS activity at 23°,
this region may be required for high affinity with the substrate, UDP-glucose, although a consensus binding motif for UDP-glucose has not been identified in Fks1p. Linear regression analysis and experiment of GS inhibitor treatment indicated correlation between GS activity and actin localization. Several reports suggest that cell wall construction and actin organization are related. First, coordinated cell wall construction re-quires an actin cytoskeleton (Kopecka and Gabriel 1995). Second, absence ofbgs41
, anFKS1homolog of the Figure5.—In vivo1,3-b-glucan synthesis in fks1mutants.
(A) Incorporation of [14C]glucose into 1,3-b-glucan of fks1 mutants. Cells were incubated at 25°(solid bars) or shifted to 34° for 2 hr (open bars), labeled with [14C]glucose for 2 hr, and incorporation of glucose into 1,3-b-glucan was mea-sured. Data represent the means and standard deviations from at least three experiments. (B) Cell wall staining in fks1mutants. WT,fks1-1082,fks1-1163, andfks1-1154were in-cubated at 37°for 4 hr. 1,3-b-glucan, mannoproteins, and chi-tin were stained with aniline blue, FITC-Con A, and calcofluor white, respectively. All cells were stained without fixation.
yeastS. pombe, results in dispersed actin patches (Cortes et al.2005), and because the cell wall stress induces actin depolarization (Delleyand Hall1999), it is possible that the cell wall damage due to defective 1,3-b-glucan synthesis causes actin delocalization.
Cellular glucan synthesis in class I mutants:Although
class I mutants did not show clear reduction ofin vitroGS activity, they have reduced levels ofin vivo glucan in-corporation and weak glucan-staining signal specifically in the small bud at the restrictive temperature. These results imply that the mutants have a defect in the syn-thesis of cellular glucan. Failure of intragenic comple-mentation between class I and III mutants also supports this idea because it can be interpreted that defective cellular glucan synthesis in class I mutants is not com-plemented by glucan-synthesis-defective class III mu-tants. A possible explanation for the reducedin vivoGS activity is the defect in localization of Fks1p. However,
this is unlikely because Fks1p localization in an FKS2 background was not altered in class I or III mutants (data not shown). According to hydropathy analysis, class I mutation sites are located in the cytoplasmic region (Douglas et al. 1994; Kelly et al. 1996), leading to another possible speculation that the region interacts with a factor(s), which is necessary for 1,3-b-glucan synthesis. However, immunoprecipitation of GS with an anti-Fks1p antibody showed none of the mutants altered the level of interaction with Rho1p (data not shown). Thus, the class I mutants might have a defect in the interaction of Fks1p with a factor(s) other than Rho1p.
Between class I and III mutants, intragenic comple-mentation was not detected and we discussed the pos-sible reasons above. However, we could not rule out the alternative possibility. The difference between class I and III mutants might be caused by the difference of threshold of cellular response for the level of GS activity, other than the difference of functional domains. This idea would explain the result that the class I mutants exhibited normal-cell-like morphology. Further study is necessary to test this possibility.
Polarized growth and endocytosis in class II mutants:
The class II mutants were found to be defective in cell polarity and endocytosis. It should be noted thatbgs11 (anotherFKS1homolog) is also implicated in polarized growth in fission yeast (Ishiguro et al. 1997; Cortes et al. 2002). Thus, in both the budding and the fission yeasts, polarized growth is somehow involved in the GS Figure7.—Endocytosis infks1 mutants. (a) WT, (b)
fks1-1082, (c)fks1-1163, and (d)fks1-1154were incubated at 37° for 4 hr in YPD media and further incubated in YPD contain-ing Lucifer yellow at 37°for 30 min. Cells were washed and observed with fluorescence microscopy.
TABLE 6
Intragenic complementation
Strain FKS1 fks1-1082 fks1-1163 fks1-1154
FKS1 111 111 111 111
fks1-1082 111 1 11 1
fks1-1163 111 11 1
fks1-1154 111 1 1
Growth was examined on YPD plates at 34°.111, WT growth; 11, growth slower than WT;1, very slow growth (single-colony formation);, no growth.
function. The class II mutants may be defective in the interaction with a factor(s) involved in cell polarity leading to abnormal cell wall structure and loss of cell polarity. Loss of cell polarity explains why the mutants exhibit a large and round morphology. However, at the moment, we could not exclude the possibility that the primary defect of the mutants is in endocytosis. It has been reported that mutants defective in endocytosis exhibit an abnormal cell wall and cell polarity in the mother cell (Pruyneand Bretscher2000).
Interestingly, the endocytosis defect was observed in Dfks1 but not in Dfks2 cells irrespective of their high similarity (deHartet al. 2003). In addition, existence of Fks2p suppresses temperature sensitivity of both class I fks1-1082and class IIIfks1-1154cells, but not class II fks1-1163cells (data not shown), suggesting that the func-tion in endocytosis is specific to Fks1p.
The class II and III mutants showed increased chitin levels, consistent with the previous reports showing that cell-wall-deficient mutants such asDgas1orDfks1show increased chitin synthesis (Garcia-Rodriguez et al. 2000; Carotti et al. 2002). Interestingly, these fks1ts mutants also showed defects in endocytosis. It was previously reported that blockade of endocytosis stops internalization of Chs3p, the chitin synthase subunit, leading to a significant increase in chitin synthesis (Reyeset al. 2007). Therefore it is possible that loss of Fks1p function induces chitin accumulation due to defective endocytosis, to repair cell wall damage caused by 1,3-b-glucan shortage.
In summary, the present study has demonstrated that the putative catalytic subunit of GS, Fks1p is composed of multiple functional domains. This study has also demon-strated that Fks1p is involved in many cell morphological processes including actin regulation and polarized cell growth. Although further study is necessary to elucidate physiological functions of Fks1p, the present method based on cell morphology is a useful approach to un-tangle the pleiotropic functions of a protein.
We are grateful to Osamu Kondoh and Yukako Kondoh for technical advice on measurement of GS activity. We are also grateful to current and former members of the Laboratory of Signal Transduction, especially to Takahiko Utsugi and Mariko Sekiya-Kawasaki for techni-cal support and discussion at the initial stage of this work. We also thank the community of R developers for their work. This work was supported by grants from the Ministry of Education, Science and Sports and Culture of Japan.
LITERATURE CITED
Abe, M., I. Nishida, M. Minemura, H. Qadota, Y. Seyamaet al.,
2001 Yeast 1,3-beta-glucan synthase activity is inhibited by phy-tosphingosine localized to the endoplasmic reticulum. J. Biol. Chem.276:26923–26930.
Abe, M., H. Qadota, A. Hirataand Y. Ohya, 2003 Lack of
GTP-bound Rho1p in secretory vesicles of Saccharomyces cerevisiae. J. Cell Biol.162:85–97.
Ayscough, K. R., J. Stryker, N. Pokala, M. Sanders, P. Crewset al.,
1997 High rates of actin filament turnover in budding yeast and roles for actin in establishment and maintenance of cell polarity
revealed using the actin inhibitor latrunculin-A. J. Cell Biol.137:
399–416.
Cabib, E., D. H. Roh, M. Schmidt, L. B. Crottiand A. Varma,
2001 The yeast cell wall and septum as paradigms of cell growth and morphogenesis. J. Biol. Chem.276:19679–19682. Cadwell, R. C., and G. F. Joyce, 1992 Randomization of genes by
PCR mutagenesis. PCR Methods Appl.2:28–33.
Carotti, C., L. Ferrario, C. Roncero, M. H. Valdivieso, A. Duran
et al., 2002 Maintenance of cell integrity in the gas1 mutant of Saccharomyces cerevisiae requires the Chs3p-targeting and acti-vation pathway and involves an unusual Chs3p localization. Yeast
19:1113–1124.
Cortes, J. C., J. Ishiguro, A. Duranand J. C. Ribas, 2002 Localization
of the (1,3)beta-D-glucan synthase catalytic subunit homologue Bgs1p/Cps1p from fission yeast suggests that it is involved in septa-tion, polarized growth, mating, spore wall formation and spore ger-mination. J. Cell Sci.115:4081–4096.
Cortes, J. C, E. Carnero, J. Ishiguro, Y. Sanchez, A. Duranet al.,
2005 The novel fission yeast (1,3)beta-D-glucan synthase cata-lytic subunit Bgs4p is essential during both cytokinesis and polar-ized growth. J. Cell Sci.118:157–174.
Dallies, N., J. Francoisand V. Paquet, 1998 A new method for
quantitative determination of polysaccharides in the yeast cell wall. Application to the cell wall defective mutants of Saccharo-myces cerevisiae. Yeast14:1297–1306.
deHart, A. K., J. D. Schnell, D. A. Allen, J. Y. Tsaiand L. Hicke,
2003 Receptor internalization in yeast requires the Tor2-Rho1 signaling pathway. Mol. Biol. Cell14:4676–4684.
Delley, P. A., and M. N. Hall, 1999 Cell wall stress depolarizes
cell growth via hyperactivation of RHO1. J. Cell Biol.147:163– 174.
Dijkgraaf, G. J., M. Abe, Y. Ohyaand H. Bussey, 2002 Mutations in
Fks1p affect the cell wall content of beta-1,3- andbeta-1,6-glucan in Saccharomyces cerevisiae. Yeast19:671–690.
Douglas, C. M., F. Foor, J. A. Marrinan, N. Morin, J. B. Nielsenet al.,
1994 The Saccharomyces cerevisiae FKS1 (ETG1) gene encodes an integral membrane protein which is a subunit of 1,3-beta-D-glucan synthase. Proc. Natl. Acad. Sci. USA91:12907–12911.
Drgonova, J., T. Drgon, K. Tanaka, R. Kollar, G. C. Chenet al.,
1996 Rho1p, a yeast protein at the interface between cell polar-ization and morphogenesis. Science272:277–279.
Drgonova, J., T. Drgon, D. H. Rohand E. Cabib, 1999 The
GTP-binding protein Rho1p is required for cell cycle progression and polarization of the yeast cell. J. Cell Biol.146:373–387. Garcia-Rodriguez, L. J., J. A. Trilla, C. Castro, M. H. Valdivieso,
A. Duranet al., 2000 Characterization of the chitin biosynthesis
process as a compensatory mechanism in the fks1 mutant of Saccharomyces cerevisiae. FEBS Lett.478:84–88.
Giaever, G., A. M. Chu, L. Ni, C. Connelly, L. Riles et al.,
2002 Functional profiling of the Saccharomyces cerevisiae ge-nome. Nature418:387–391.
Inoue, S. B., N. Takewaki, T. Takasuka, T. Mio, M. Adachi et al.,
1995 Characterization and gene cloning of 1,3-beta-D-glucan syn-thase from Saccharomyces cerevisiae. Eur. J. Biochem.231:845–854. Inoue, S. B., H. Qadota, M. Arisawa, T. Watanabeand Y. Ohya,
1999 Prenylation of Rho1p is required for activation of yeast 1, 3-beta-glucan synthase. J. Biol. Chem.274:38119–38124. Ishiguro, J., A. Saitou, A. Duranand J. C. Ribas, 1997 cps11, a
Schizosaccharomyces pombe gene homolog of Saccharomyces cerevisiae FKS genes whose mutation confers hypersensitivity to cyclosporin A and papulacandin B. J. Bacteriol.179:7653–7662. Ito, H., Y. Fukuda, K. Murataand A. Kimura, 1983 Transformation
of intact yeast cells treated with alkali cations. J. Bacteriol.153:163– 168.
Jorgensen, P., N. P. Edgington, B. L. Schneider, I. Rupes, M. Tyers
et al., 2007 The size of the nucleus increases as yeast cells grow. Mol. Biol. Cell18:3523–3532.
Kaiser, C. A., S. Michaelisand A. Mitchell, 1994 Methods in Yeast
Genetics: A Laboratory Course Manual.Cold Spring Harbor Labora-tory Press, Cold Spring Harbor, NY.
Kaksonen, M., Y. Sunand D. G. Drubin, 2003 A pathway for
asso-ciation of receptors, adaptors, and actin during endocytic inter-nalization. Cell115:475–487.
Kelly, R., E. Register, M. J. Hsu, M. Kurtz and J. Nielsen,
in Aspergillus nidulans and purification of the corresponding protein. J. Bacteriol.178:4381–4391.
Kikuchi, Y., E. Mizuuchi, S. Nogami, S. Morishitaand Y. Ohya,
2007 Involvement of Rho-type GTPase in control of cell size in Saccharomyces cerevisiae. FEMS Yeast Res.7:569–578. Kopecka, M., and M. Gabriel, 1995 Actin cortical cytoskeleton and
cell wall synthesis in regenerating protoplasts of the Saccharomy-ces cerevisiae actin mutant DBY 1693. Microbiology141(Pt. 6): 1289–1299.
Kruskal, W. H., and W. A. Wallis, 1952 Use of ranks in one-criterion
variance analysis. J. Am. Stat. Assoc.47:583–621.
Mazur, P., and W. Baginsky, 1996 In vitro activity of 1,3-beta-D-glucan
synthase requires the GTP-binding protein Rho1. J. Biol. Chem.
271:14604–14609.
Mazur, P., N. Morin, W. Baginsky, M.el-Sherbeini, J. A. Clemas
et al., 1995 Differential expression and function of two homol-ogous subunits of yeast 1,3-beta-D-glucan synthase. Mol. Cell. Biol.15:5671–5681.
Ni, L., and M. Snyder, 2001 A genomic study of the bipolar bud site
selection pattern in Saccharomyces cerevisiae. Mol. Biol. Cell12:
2147–2170.
Ohnuki, S., S. Nogami, H. Kanai, D. Hirata, Y. Nakataniet al.,
2007 Diversity of Ca21-induced morphology revealed by mor-phological phenotyping of Ca21-sensitive mutants of Saccharo-myces cerevisiae. Eukaryot. Cell6:817–830.
Ohtani, M., A. Saka, F. Sano, Y. Ohya and S. Morishita,
2004 Development of image processing program for yeast cell morphology. J. Bioinform. Comput. Biol.1:695–709.
Ohya, Y., and D. Botstein, 1994 Structure-based systematic
isola-tion of condiisola-tional-lethal mutaisola-tions in the single yeast calmodu-lin gene. Genetics138:1041–1054.
Ohya, Y., J. Sese, M. Yukawa, F. Sano, Y. Nakataniet al., 2005
High-dimensional and large-scale phenotyping of yeast mutants. Proc. Natl. Acad. Sci. USA102:19015–19020.
Ozaki, K., K. Tanaka, H. Imamura, T. Hihara, T. Kameyamaet al.,
1996 Rom1p and Rom2p are GDP/GTP exchange proteins (GEPs) for the Rho1p small GTP binding protein in Saccharomy-ces cerevisiae. EMBO J.15:2196–2207.
Pruyne, D., and A. Bretscher, 2000 Polarization of cell growth in
yeast. J. Cell Sci.113(Pt. 4): 571–585.
Qadota, H., C. P. Python, S. B. Inoue, M. Arisawa, Y. Anraku
et al., 1996 Identification of yeast Rho1p GTPase as a regula-tory subunit of 1,3-beta-glucan synthase. Science272:279–281. Ram, A. F., S. S. Brekelmans, L. J. Oehlen and F. M. Klis,
1995 Identification of two cell cycle regulated genes affecting the beta 1,3-glucan content of cell walls in Saccharomyces cere-visiae. FEBS Lett.358:165–170.
Reyes, A., M. Sanz, A. Duranand C. Roncero, 2007 Chitin
syn-thase III requires Chs4p-dependent translocation of Chs3p into the plasma membrane. J. Cell Sci.120:1998–2009.
Robertson, A. S., E. Smytheand K. R. Ayscough, 2009 Functions
of actin in endocytosis. Cell. Mol. Life Sci.66:2049–2065. Roh, D. H., B. Bowers, H. Riezmanand E. Cabib, 2002 Rho1p
mu-tations specific for regulation of beta(1/3)glucan synthesis and the order of assembly of the yeast cell wall. Mol. Microbiol.44:
1167–1183.
Saka, A., M. Abe, H. Okano, M. Minemura, H. Qadota et al.,
2001 Complementing yeast rho1 mutation groups with distinct functional defects. J. Biol. Chem.276:46165–46171.
Sambrook, J., E. F. Fritschand T. Maniatis, 1989 Molecular
Clon-ing: A Laboratory Manual.Cold Spring Harbor Laboratory Press, Cold Spring Harbor, NY.
Sekiya-Kawasaki, M., M. Abe, A. Saka, D. Watanabe, K. Konoet al.,
2002 Dissection of upstream regulatory components of the Rho1p effector, 1,3-beta-glucan synthase, inSaccharomyces cerevi-siae.Genetics162:663–676.
Sikorski, R. S., and P. Hieter, 1989 A system of shuttle vectors and
yeast host strains designed for efficient manipulation of DNA in Saccharomyces cerevisiae.Genetics122:19–27.
Storey, J. D., J. E. Taylorand D. Siegmund, 2004 Strong control,
conservative point estimation and simultaneous conservative consistency of false discovery rates: a unified approach. J. R. Stat. Soc. Ser. B66:187–205.
Suzuki, M., R. Igarashi, M. Sekiya, T. Utsugi, S. Morishitaet al.,
2004 Dynactin is involved in a checkpoint to monitor cell wall synthesis in Saccharomyces cerevisiae. Nat. Cell. Biol.6:861– 871.
Suzuki, R., and H. Shimodaira, 2006 Pvclust: an R package for
as-sessing the uncertainty in hierarchical clustering. Bioinformatics
22:1540–1542.
Utsugi, T., M. Minemura, A. Hirata, M. Abe, D. Watanabeet al.,
2002 Movement of yeast 1,3-beta-glucan synthase is essential for uniform cell wall synthesis. Genes Cells7:1–9.
Yahara, N., T. Ueda, K. Satoand A. Nakano, 2001 Multiple roles
of Arf1 GTPase in the yeast exocytic and endocytic pathways. Mol. Biol. Cell12:221–238.
Yamochi, W., K. Tanaka, H. Nonaka, A. Maeda, T. Musha et al.,
1994 Growth site localization of Rho1 small GTP-binding pro-tein and its involvement in bud formation in Saccharomyces cerevisiae. J. Cell Biol.125:1077–1093.
Supporting Information
http://www.genetics.org/cgi/content/full/genetics.109.109892/
Multiple Functional Domains of the Yeast l,3-
β
-Glucan Synthase
Subunit Fks1p Revealed by Quantitative Phenotypic Analysis
of Temperature-Sensitive Mutants
Hiroki Okada, Mitsuhiro Abe, Masayo Asakawa-Minemura, Aiko Hirata, Hiroshi
Qadota, Kana Morishita, Shinsuke Ohnuki, Satoru Nogami and Yoshikazu Ohya
H. Okada et al. 2 SI
TABLE S1
Correlated parameters
Group # Representative
parameter
Other parameter in group
Description of representative parameter
1 C11-1_A C12-1_A, C103_A, C104_A, D102_A, D127_A Whole cell size
2 C13_A Whole cell fitness for ellipse
3 C115_A Whole cell axis ratio
4 C126_A C126_A1B Brightness difference of cell wall
5 C127_A Thickness difference of cell wall
6 A7-1_A A101_A Size of actin region
7 A8-1_A Actin region brightness
8 A114 A105_A, A106_A, A115 actin a ratio to no bud cells
9 A113_A Actin n ratio
10 ACV120_A A120_A, A121_A, ACV121_A Coefficient of variation of A120 A
11 A122_A Number of bright actin patches
12 A123_A Ratio of actin patches to actin region
13 D176_A D14-1_A, D173_A Nuclear long axis length
14 D15-1_A Nuclear brightness
15 D16-1_A D191_A Maximal intensity of nuclear brightness
16 D17-1_A Nuclear fitness for ellipse
17 D105_A Ratio of D102 to C103
18 D148_A D117_A, D135_A, D147_A Relative distance of nuclear brightest point to cell
center
19 D154_A Angle between C1D1-1 and C1C1-2
20 D155_A Angle between C1D2-1 and C1C1-2
21 D179_A Nuclear short axis length
22 D182_A Nuclear axis ratio
23 D188_A Distance between nuclear gravity center and
brightest point
24 D194_A Maximal intensity of nuclear brightness divided by
average
25 CCV11-1_A CCV12-1_A Coefficient of variation of C11-1 A
26 CCV13_A Coefficient of variation of C13 A
27 CCV103_A Coefficient of variation of C103 A
28 CCV104_A Coefficient of variation of C104 A
29 CCV115_A Coefficient of variation of C115 A
30 CCV126_A Coefficient of variation of C126 A
H. Okada et al. 3 SI
32 ACV7-1_A ACV101_A Coefficient of variation of A7-1 A
33 ACV8-1_A Coefficient of variation of A8-1 A
34 ACV122_A Coefficient of variation of A122 A
35 ACV123_A Coefficient of variation of A123 A
36 DCV176_A DCV14-1_A, DCV173_A Coefficient of variation of D176 A
37 DCV15-1_A Coefficient of variation of D15-1 A
38 DCV16-1_A DCV191_A Coefficient of variation of D16-1 A
39 DCV17-1_A Coefficient of variation of D17-1 A
40 DCV102_A Coefficient of variation of D102 A
41 DCV105_A Coefficient of variation of D105 A
42 DCV117_A DCV147_A Coefficient of variation of D117 A
43 DCV127_A Coefficient of variation of D127 A
44 DCV135_A DCV148_A Coefficient of variation of D135 A
45 DCV154_A Coefficient of variation of D154 A
46 DCV155_A Coefficient of variation of D155 A
47 48
DCV179_A DCV182_A
Coefficient of variation of D179 A Coefficient of variation of D182 A
49 DCV188_A Coefficient of variation of D188 A
50 DCV194_A Coefficient of variation of D194 A
51 C11-1_A1B C12-1_A1B Mother cell size
52 C11-2_A1B
C12-2_A1B, C101_A1B, C102_A1B, C107_A1B, C117_A1B, C118_A1B, C123_A1B, A7-2_A1B, A102_A1B, ACV102_A1B
Bud cell size
53 C13_A1B Mother cell fitness for ellipse
54 C103_A1B Long axis length in mother
55 C104_A1B Short axis length in mother
56 C106_A1B C105_A1B, C110_A1B Bud direction
57 C108_A1B Short axis length in bud
58 C109_A1B Neck width
59 C111_A1B Distance between bud tip and mother short axis
extension
60 C112_A1B Distance between middle point of neck and mother
center
61 C113_A1B Distance between bud tip and mother long axis
through middle point of neck
62 C114_A1B Bud axis ratio
63 C115_A1B Mother axis ratio
64 C116_A1B Axis ratio ratio
65 C121 C124_A1B, A108, A117, C124 medium bud ratio
H. Okada et al.
4 SI
67 C127_A1B Thickness difference of cell wall
68 C128_A1B Distance between middle point of neck and mother
hip
69 A7-1_A1B Size of actin region in mother
70 A8-1_A1B Total brightness of actin region in mother
71 A8-2_A1B Total brightness of actin region in bud
72 A9_A1B ACV9_A1B Proportion of actin region at neck
73 A101_A1B Actin region ratio in whole cell
74 A103_A1B Relative distance of actin patch center from neck in
mother
75 A104_A1B Relative distance of actin patch center from neck in
bud
76 A107_A1B A108_A1B Actin c ratio
77 A109_A1B A112_A1B Actin e ratio
78 A110_A1B Actin f ratio
79 A113_A1B Actin n ratio
80 A120_A1B A121_A1B Total length of actin patch link
81 A122_A1B Number of bright actin patches
82
83
A123_A1B
D14-3_A1B D181_A1B
Ratio of actin patches to actin region
Nuclear size
84 D15-3_A1B Nuclear brightness
85 D16-3_A1B D193_A1B, DCV16-3_A1B, DCV193_A1B Maximal intensity of nuclear brightness
86 D17-3_A1B D190_A1B Nuclear fitness for ellipse
87 D104_A1B
D107_A1B, D110_A1B, D114_A1B, D118_A1B,
D126_A1B, D129_A1B, D132_A1B, D136_A1B,
D142_A1B
Distance between nuclear gravity center and
mother tip
88 D143_A1B Distance between nuclear outline point D6-1 and
middle point of neck
89 D145_A1B Distance between nuclear outline point D7 and
mother hip
90 D147_A1B Relative distance of nuclear gravity center to
mother center
91 D148_A1B Relative distance of nuclear brightest point to
mother center
92 D152_A1B Mobility of nucleus in mother
93 D154_A1B Angle between C1D1-1 and C1C1-2
94 D155_A1B Angle between C1D2-1 and C1C1-2
95 D161_A1B Angle between D3-1D4-1 and C1-1C1-2 or
between D3-3D4-3 and C1-1C1-2
H. Okada et al. 5 SI
D3-3D4-3 and C1C4-1
97 D169_A1B D170_A1B Angle between C4-1D1-1 and C4-1C1
98 D172_A1B Angle between C4-1D4 and C4-1C1
99 D175_A1B D178_A1B Maximal distance between nuclear gravity center
and nuclear outline
100 D184_A1B DCV184_A1B Nuclear axis ratio
101 D196_A1B Maximal intensity of nuclear brightness divided by
average
102 CCV11-1_A1B Coefficient of variation of C11-1 A1B
103 CCV118_A1B CCV11-2_A1B, CCV12-2_A1B, CCV107_A1B,
CCV117_A1B, ACV7-2_A1B Coefficient of variation of C118 A1B
104 CCV12-1_A1B Coefficient of variation of C12-1 A1B
105 CCV13_A1B Coefficient of variation of C13 A1B
106 CCV101_A1B Coefficient of variation of C101 A1B
107 CCV102_A1B Coefficient of variation of C102 A1B
108 CCV103_A1B Coefficient of variation of C103 A1B
109 CCV104_A1B Coefficient of variation of C104 A1B
110 CCV105_A1B Coefficient of variation of C105 A1B
111 CCV106_A1B Coefficient of variation of C106 A1B
112 CCV108_A1B Coefficient of variation of C108 A1B
113 CCV109_A1B Coefficient of variation of C109 A1B
114 CCV110_A1B Coefficient of variation of C110 A1B
115 CCV111_A1B Coefficient of variation of C111 A1B
116 CCV112_A1B Coefficient of variation of C112 A1B
117 CCV113_A1B Coefficient of variation of C113 A1B
118 CCV114_A1B Coefficient of variation of C114 A1B
119 CCV115_A1B Coefficient of variation of C115 A1B
120 CCV116_A1B Coefficient of variation of C116 A1B
121 CCV126_A1B Coefficient of variation of C126 A1B
122 CCV127_A1B Coefficient of variation of C127 A1B
123 CCV128_A1B Coefficient of variation of C128 A1B
124 ACV7-1_A1B Coefficient of variation of A7-1 A1B
125 ACV8-1_A1B Coefficient of variation of A8-1 A1B
126 ACV8-2_A1B Coefficient of variation of A8-2 A1B
127 ACV101_A1B Coefficient of variation of A101 A1B
128 ACV103_A1B Coefficient of variation of A103 A1B
129 ACV104_A1B Coefficient of variation of A104 A1B
130 ACV120_A1B ACV121_A1B Coefficient of variation of A120 A1B
131 ACV122_A1B Coefficient of variation of A122 A1B
H. Okada et al. 6 SI
133 DCV14-3_A1B Coefficient of variation of D14-3 A1B
134 DCV15-3_A1B Coefficient of variation of D15-3 A1B
135 DCV17-3_A1B Coefficient of variation of D17-3 A1B
136 DCV104_A1B DCV107_A1B, DCV126_A1B Coefficient of variation of D104 A1B
137 DCV110_A1B DCV114_A1B Coefficient of variation of D110 A1B
138 DCV118_A1B Coefficient of variation of D118 A1B
139 DCV129_A1B DCV142_A1B Coefficient of variation of D129 A1B
140 DCV132_A1B Coefficient of variation of D132 A1B
141 DCV136_A1B Coefficient of variation of D136 A1B
142 DCV143_A1B Coefficient of variation of D143 A1B
143 DCV145_A1B Coefficient of variation of D145 A1B
144 DCV147_A1B Coefficient of variation of D147 A1B
145 DCV148_A1B Coefficient of variation of D148 A1B
146 DCV152_A1B Coefficient of variation of D152 A1B
147 DCV154_A1B Coefficient of variation of D154 A1B
148 DCV155_A1B Coefficient of variation of D155 A1B
149 DCV161_A1B Coefficient of variation of D161 A1B
150 DCV165_A1B Coefficient of variation of D165 A1B
151 DCV169_A1B Coefficient of variation of D169 A1B
152 DCV170_A1B Coefficient of variation of D170 A1B
153 DCV172_A1B Coefficient of variation of D172 A1B
154 DCV175_A1B DCV178_A1B Coefficient of variation of D175 A1B
155 DCV181_A1B Coefficient of variation of D181 A1B
156 DCV190_A1B Coefficient of variation of D190 A1B
157 DCV196_A1B Coefficient of variation of D196 A1B
158 C11-1_C C12-1_C Mother cell size
159 C12-2_C C11-2_C, C107_C Bud cell outline length
160 C13_C Mother cell fitness for ellipse
161 C101_C C102_C Whole cell size
162 C103_C Long axis length in mother
163 C104_C Short axis length in mother
164 C106_C C105_C, C110_C, C111_C, D158_C, D159_C Bud direction
165 C108_C Short axis length in bud
166 C109_C Neck width
167 C112_C C128_C Distance between middle point of neck and mother
center
168 C113_C Distance between bud tip and mother long axis
through middle point of neck
169 C114_C Bud axis ratio
H. Okada et al. 7 SI
171 C116_C Axis ratio ratio
172 C117_C C118_C Cell outline ratio
173 C123_C Small bud ratio
174 C124_C C125_C Medium bud ratio
175 C126_C Brightness difference of cell wall
176 C127_C Thickness difference of cell wall
177 A7-1_C Size of actin region in mother
178 A7-2_C Size of actin region in bud
179 A8-1_C Total brightness of actin region in mother
180 A8-2_C Total brightness of actin region in bud
181 A9_C Proportion of actin region at neck
182 A101_C Actin region ratio in whole cell
183 A102_C A104_C, A112_C, ACV104_C Bud actin region ratio to total region
184 A103_C Relative distance of actin patch center from neck in
mother
185 A107_C Actin c ratio
186 A108_C Actin d ratio
187 A109_C Actin e ratio
188 A110_C Actin f ratio
189 A113_C Actin n ratio
190 A120_C A121_C Total length of actin patch link
191 A122_C Number of bright actin patches
192 A123_C Ratio of actin patches to actin region
193 D176_C D14-1_C, D173_C Nuclear long axis length in mother
194 D14-2_C D174_C, D177_C, D180_C Nuclear size in bud
195 D14-3_C Nuclear size in whole cell
196 D15-1_C Nuclear brightness in mother
197 D15-2_C Nuclear brightness in bud
198 D15-3_C Nuclear brightness in whole cell
199 D193_C D16-1_C, D16-2_C, D191_C, D192_C Average of nuclear brightness in whole cell
200 D16-3_C Maximal intensity of nuclear brightness in whole
cell
201 D17-1_C Nuclear fitness for ellipse in mother
202 D17-2_C Nuclear fitness for ellipse in bud
203 D103_C D106_C, D125_C, D128_C, D130_C, D141_C, D145_C, D152_C
Distance between nuclear gravity center in mother
and mother tip
204 D108_C D112_C Distance between nuclear gravity center in mother
and middle point of neck
205 D109_C D131_C Distance between nuclear gravity center in bud and
H. Okada et al.
8 SI
206 D121_C D113_C, D123_C, D139_C, D146_C, D153_C Distance between nuclear gravity center in bud and
bud tip
207 D116_C Distance between two nuclear gravity centers
208 D117_C D147_C Distance between nuclear gravity center in mother
and mother center
209 D119_C Distance between nuclear gravity center in bud and
bud center
210 D134_C Distance between two nuclear brightest points
211 D135_C Distance between nuclear brightest point in mother
and mother center
212 D137_C Distance between nuclear brightest point in bud
and bud tip
213 D143_C Distance between nuclear outline point D6-1 in
mother and middle point of neck
214 D144_C Distance between nuclear outline point D6-2 in bud
and middle point of neck
215 D148_C Relative distance of nuclear brightest point in
mother to mother center
216 D149_C Relative distance of nuclear gravity center in bud to
bud center
217 D150_C Relative distance of nuclear brightest point in bud
to bud center
218 D151_C Ratio of distance between each nucleus and middle
point of neck
219 D154_C Angle between C1D1-1 and C1C1-2
220 D155_C Angle between C1D2-1 and C1C1-2
221 D156_C Angle between C2D1-2 and C2C4-2
222 D157_C Angle between C2D2-2 and C2C4-2
223 D162_C D163_C Angle between D1-1D1-2 and C1C4-1
224 D166_C D167_C Angle between D1-1D1-2 and C4-1C4-2
225 D169_C Angle between C4-1D1-1 and C4-1C1
226 D170_C Angle between C4-1D2-1 and C4-1C1
227 D179_C Nuclear short axis length in mother
228 D182_C Nuclear axis ratio in mother
229 D183_C Nuclear axis ratio in bud
230 D185_C Relative distance of two nuclear gravity centers to
middle point of neck
231 D186_C Relative distance of two nuclear brightest points to
middle point of neck
H. Okada et al. 9 SI
brightest point in mother
233 D189_C Distance between nuclear gravity center and
brightest point in bud
234 D194_C Maximal intensity of nuclear brightness divided by
average in whole cell
235 D195_C Maximal intensity of nuclear brightness divided by
average in mother
236 D196_C Maximal intensity of nuclear brightness divided by
average in bud
237 D197_C D198_C Ratio of nuclear size
238 CCV11-1_C Coefficient of variation of C11-1 C
239 CCV11-2_C Coefficient of variation of C11-2 C
240 CCV12-1_C Coefficient of variation of C12-1 C
241 CCV12-2_C CCV107_C Coefficient of variation of C12-2 C
242 CCV13_C Coefficient of variation of C13 C
243 CCV101_C Coefficient of variation of C101 C
244 CCV102_C Coefficient of variation of C102 C
245 CCV103_C Coefficient of variation of C103 C
246 CCV104_C Coefficient of variation of C104 C
247 CCV110_C CCV105_C, CCV106_C Coefficient of variation of C110 C
248 CCV108_C Coefficient of variation of C108 C
249 CCV109_C Coefficient of variation of C109 C
250 CCV111_C Coefficient of variation of C111 C
251 CCV112_C Coefficient of variation of C112 C
252 CCV113_C Coefficient of variation of C113 C
253 CCV114_C Coefficient of variation of C114 C
254 CCV115_C Coefficient of variation of C115 C
255 CCV116_C Coefficient of variation of C116 C
256 CCV117_C CCV118_C Coefficient of variation of C117 C
257 CCV126_C Coefficient of variation of C126 C
258 CCV127_C Coefficient of variation of C127 C
259 CCV128_C Coefficient of variation of C128 C
260 ACV7-1_C Coefficient of variation of A7-1 C
261 ACV7-2_C Coefficient of variation of A7-2 C
262 ACV8-1_C Coefficient of variation of A8-1 C
263 ACV8-2_C Coefficient of variation of A8-2 C
264 ACV9_C Coefficient of variation of A9 C
265 ACV101_C Coefficient of variation of A101 C
266 ACV102_C Coefficient of variation of A102 C