IOP Conf. Series: Earth and Environmental Science 18(2014) 012069 doi:10.1088/1755-1315/18/1/012069
Comparison of pixel -based and artificial neural networks
classification methods for detecting forest cover changes in
Malaysia
B R Deilmai, K D Kanniah1, A W Rasib and A Ariffin
Department o f Geoinformation, Faculty o f Geoinformation and Real Estate, Universiti Teknologi Malaysia, 81310 Johor, M alaysia
E-mail: kasturi@ utm.my
Abstract. According to the FAO (Food and Agriculture Organization), Malaysia lost 8.6% of its forest cover between 1990 and 2005. In forest cover change detection, remote sensing plays an important role. A lot of change detection methods have been developed, and most of them are semi-automated. These methods are time consuming and difficult to apply. One of the new and robust methods for change detection is artificial neural network (ANN). In this study, (ANN) classification scheme is used to detect the forest cover changes in the Johor state in Malaysia. Landsat Thematic Mapper images covering a period of 9 years (2000 and 2009) are used. Results obtained with ANN technique was compared with Maximum likelihood classification (MLC) to investigate whether ANN can perform better in the tropical environment. Overall accuracy of the ANN and MLC techniques are 75%, 68 % (2000) and 80%, 75 % (2009) respectively. Using the ANN method, it was found that forest area in Johor decreased as much as 1298 km2 between 2000 and 2009. The results also showed the potential and advantages of neural network in classification and change detection analysis.
1. Introduction
Land use and land cover (LULC) change detection is important for many decisions making and management activities related to the earth surface like hydrological modeling and environmental management [1]. LULC provides key environmental information for many scientific purposes, and also to a range o f human activities such as urban planning [2]. The growth o f population associated with the climate change is found to be the main reason for the loss o f forest cover over time [3]. Deforestation in particular has a large impact on the catchment process and biochemical cycles like carbon and nitrogen, soil erosion and flood [1]. Remote sensing is a valuable tool to get quick information about various LULC types and to monitor their changes over time [4]. In this paper, we have employed two Landsat Thematic M apper images covering years 2000 and 2009 to (i) classify different LULC types in the state o f Johor using traditional pixel based and Artificial Neural Network image classification techniques and (ii) to detect the LULC changes using a post classification method. Pixel based classification is implemented based on statistical probability method [5]. Neural network is a supporting tool for image processing and remotely sensed change detection. It is based on back propagation training algorithm [6]. Many researches [7, 8, 9, 10, and 11] showed that the classification accuracy is improved by neural network in comparison to the pixel based method mainly because the data distributions are strongly non-Gaussian in ANN whereas; the MLC uses Gaussian distribution parameter [12].
2. D a ta an d m eth o d o lo g y
2.1. Study area
1 To whom any correspondence should be addressed.
IOPConf. Series: Earth and Environmental Science 18(2014) 012069 doi:10.1088/1755-1315/18/1/012069 The study area considered in this study is the entire state o f Johor. Johor is one o f the developed states in Peninsular M alaysia (Figure 1). In term o f the area and population, Johor is the fifth largest and second populous state in Malaysia, with a total area o f 19,210 km2 and population o f 3,233,434 in 2010 [13]. The largest land uses in Johor are oil palm and forest; however, most o f the forested areas had been changed to oil palm plantations in recent years [14].
Figure 1. Study area showing the state o f Johor [15]. 2.2. Data used
Enhanced Thematic M apper (ETM +) (2000) and Landsat Thematic M apper (2009) data were used to perform the LULC classification. These data (level 1T) were downloaded from the Earth Explorer website [16], and they are corrected for geometric and topographic errors. We used 6 spectral bands (visible, near infra-red and shortwave infra-red) except for the thermal band to perform the classification. These data with 30 m spatial resolution enable the generation o f moderate resolution LULC classes covering the entire state o f Johor.
2.3. Methods
In order to obtain more accurate results, before performing the change detection both images were atmospherically corrected (because o f the difference in months and sun angle) using Atcor2 program available in the Erdas Imagine software. Subsequently mosaicking and finally co-registration of ETM+ and TM data were performed. Before classification, the land cover types in the study area were defined with the help o f a land use map produced by the department o f Agriculture M alaysia (year 2008). The main land cover types are forest, oil palm, urban area, rubber and water bodies. After that, each mosaicked images were classified using maximum likelihood (ML) and neural network classification techniques. M L algorithm was performed as supervised classification, and it is based on user defined spectral signature (training area). Training areas were selected according to the land use maps o f years 2000 and 2008. Finally, the ML supervised classification was performed. This classification is a standard pixel based technique which is based on a multivariate probability density function o f classes [6]. Whilst, Artificial Neural N etwork (ANN) is a technique that can simulate functions and it is synonymic to human brain [9]. Three types o f networks are commonly used in remote sensing namely: Hopefield networks, Kohonen networks, and the multi-layered feed forward networks [5]. Unsupervised and semi-supervised classifications commonly use Kohonen networks, whilst Hopfield network is used in stereo matching [4].
IOPConf. Series: Earth and Environmental Science 18(2014) 012069 doi:10.1088/1755-1315/18/1/012069 a post classification change detection technique was adopted to detect the LULC changes in Johor between 2000 and 2009 [6].
3. Results and discussions
3.3. Landuse/landcover classification
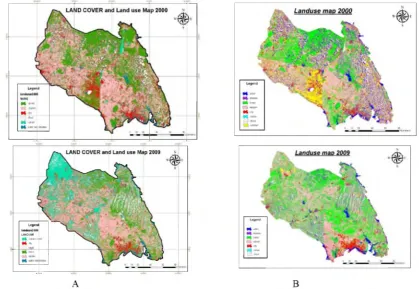
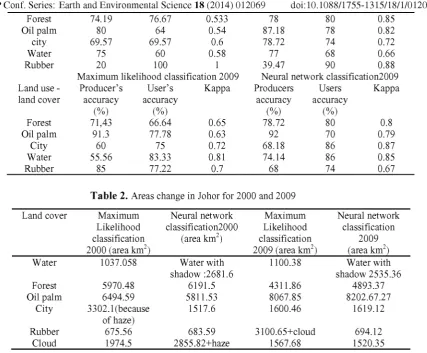
The final LULC (Land use and land cover) maps presented in figure 2 and figure 3 show that the major classes are forest, oil palm, rubber, city and water. An evaluation o f accuracy of the classified images (table 1) shows that the overall accuracy for Artificial Neural Network (ANN) classification is 75% (year 2000) and 80% (year 2009), and it is higher than the pixel based classification result of 68% (2000 image), and 75% (2009 image).
3.2. Change detection
Since the ANN technique provided higher accuracy compared to the MLC classifier, we used the classified images with ANN technique to detect the forest cover changes between 2000 and 2009. The total forested area as estimated using ANN technique in year 2000 is 6191 km2, and this number decreased to 4461 km 2 in year 2009 (table 2). The reason for the changes is mostly due to the development o f oil palm plantation that plays a major role in the country’s economy. Moreover, development o f the Iskandar M alaysia region in Johor could have claimed some forested areas for the development o f urban areas.
Figure 3. Land use/land cover maps produced using (A) maximum likelihood and (B) artificial neural network classifiers for year 2000 and 2009.
Table 1. Accuracy assessment of maximum likelihood and artificial neural network classifiers Maximum likelihood classification 2000 Neural network classification
2000
Land use - Producer’s User’s Kappa Producers Users Kappa
land cover accuracy accuracy accuracy accuracy
IOPConf. Series: Earth and Environmental Science 18(2014) 012069 doi:10.1088/1755-1315/18/1/012069
Forest 74.19 76.67 0.533 78 80 0.85
Oil palm 80 64 0.54 87.18 78 0.82
city 69.57 69.57 0.6 78.72 74 0.72
Water 75 60 0.58 77 68 0.66
Rubber 20 100 1 39.47 90 0.88
Maximum likelihood classification 2009 Neural network classification2009
Land use - Producer’s User’s Kappa Producers Users Kappa
land cover accuracy accuracy accuracy accuracy
(%) (%) (%) (%)
Forest 71,43 66.64 0.65 78.72 80 0.8
Oil palm 91.3 77.78 0.63 92 70 0.79
City 60 75 0.72 68.18 86 0.87
Water 55.56 83.33 0.81 74.14 86 0.85
Rubber 85 77.22 0.7 68 74 0.67
Table 2. Areas change in Johor for 2000 and 2009 Land cover Maximum
Likelihood classification 2000 (area km2)
Neural network classification2000 (area km2) Maximum Likelihood classification 2009 (area km2)
Neural network classification
2009 2 (area km2)
Water 1037.058 Water with 1100.38 Water with
shadow :2681.6 shadow 2535.36
Forest 5970.48 6191.5 4311.86 4893.37
Oil palm 6494.59 5811.53 8067.85 8202.67.27
City 3302.1(because 1517.6 1600.46 1619.12
of haze)
Rubber 675.56 683.59 3100.65+cloud 694.12
Cloud 1974.5 2855.82+haze 1567.68 1520.35
4. C o n clu sio n
This study used two classification methods, namely Artificial Neural Networks (ANN) and Maximum likelihood (ML) to classify different land use and land cover types in the state o f Johor. The highest classification accuracy was obtained by ANN, and the Landsat images classified using this method was used to detect the change notably in forest cover between 2000 and 2009. It was found that during a period o f 10 years Johor lost approximately 28% o f forested areas. It is suggested that the forested areas must be monitored on a continuous manner to detect any illegal deforestation. Also, the state government should make all forested areas as protected forest in order to prevent further loss o f this valuable natural resource in the state.
Acknowledgements
This study is funded by the Ministry o f Higher Education, M alaysia and Universiti Teknologi M alaysia research grant (Q.J130000.2527.03H23) and we acknowledge Earth Explorer (http://earthexplorer.usgs.gov) for providing the Landsat images.
References
[1] Ahmad F 2012 A review o f remote sensing data change detection: Comparison o f Faisalaba and M ultan Districts, Punjab Province, Pakistan J. Geography.REG. Plan 5236-251
[2] Janetos A and Justice C 2000 Land cover and global productivity: A measurement strategy for the NASA programme Int .J. Remote. Sens 21 1491-1512
[3] Lang S 2008. Object-based image analysis for remote sensing applications: modeling reality-dealing with complexity. Object-based image analysis (B erlin Springer)chapter 1.1 3- 27. [4] Lee J J, Shim J C and Ho Ha Yand 1994. Stereo correspondence using the Hopfield neural network o f a new energy function. Pattern. Recogn 27 1513-1522 [5] Lewis DJ, Corr DG , Gent CR and Sheppard CP 1992 Semi-supervised artificial neural
networks for classification o f remotely sensed images. Remote. Res Oper. Remote Sensing
IOPConf. Series: Earth and Environmental Science 18(2014) 012069 doi:10.1088/1755-1315/18/1/012069 [6] Lillesand T M., Kiefer R W and Chipman, J 2008 Remote sensing and image interpretation
6th edition (New York:John W iley & Sons Ltd)
[7] Macleod R D and Congalton R G 1998 A quantitative comparison o f change-detection algorithms for monitoring Eelgrass from remotely sensed data. Photogramm. Eng Rem S 64 207-216
[8] Mas J F and Flores J J 2008 The application o f artificial neural networks to the analysis o f remotely sensed data. J. R em o te. Sens 29 617-663
[9] Neagoe V E, Neghina M, and Datcu M 2012 Neural N etwork Techniques for Automated Land-Cover Change Detection in M ultispectral Satellite Time Series Imagery. Int. J. Math.
Models Methods. Appl. Sci 131-139.
[ 10] Pajares G 2012 A Hopfield neural network for image change detection IEEE . T. Neural.
Network 17 1250-1264
[11] Pijanowski, B C Brown D G Shellito B A and M anik G A 2002 Using neural networks and GIS to forecast land use changes: a land transformation model. Comput, Environ. Urban. Syst, 26 553-575
[12] Yuan H , Van Der Wiele C F and Khorram S. 2009 An automated artificial neural network system for land use/land cover classification from Landsat TM imagery. Remote. Sens
1
243-265[13] http://en.wikipedia.org/wiki/Johor_Bahru \
[14] http://homeguides.sfgate.com/major-reasons-deforestation-malaysia-78510.html [15] https://maps.google.com/
![Figure 1. Study area showing the state of Johor [15].](https://thumb-us.123doks.com/thumbv2/123dok_us/1192091.1149708/2.595.129.440.164.288/figure-study-area-showing-state-johor.webp)