Shutdown Dose Rate Analysis for the long-pulse D-D Operation
Phase in KSTAR
Jin Hun Park1, Jung-Hoon Han1.a, D. H. Kim2, K. S. Joo3 and Y. S. Hwang1,2
1 Center for Advance Research in Fusion Reactor Engineering (CARFRE), Seoul National University, Seoul, 08826, Korea 2 Department of Nuclear Engineering, Seoul National University, Seoul, 08826, Korea
3 Department of Physics, Myongji University, Yongin, 17058, Korea
Abstract. KSTAR is a medium size fully superconducting tokamak. The deuterium-deuterium (D-D) reaction in the KSTAR tokamak generates neutrons with a peak yield of 3.5x10¹⁶ per second through a pulse operation of 100 seconds. The effect of neutron generation from full D-D high power KSTAR operation mode to the machine, such as activation, shutdown dose rate, and nuclear heating, are estimated for an assurance of safety during operation, maintenance, and machine upgrade. The nuclear heating of the in-vessel components, and neutron activation of the surrounding materials have been investigated. The dose rates during operation and after shutdown of KSTAR have been calculated by a 3D CAD model of KSTAR with the Monte Carlo code MCNP5 (neutron flux and decay photon), the inventory code FISPACT (activation and decay photon) and the FENDL 2.1 nuclear data library.
1 Introduction
KSTAR started its operation from 2008 by creating first plasma and successfully completed its 1st phase of
operation for 5 years by achieving H-mode plasma. Now it is in its 2nd phase operation aiming heating power of
28MW and developing Advanced Tokamak (AT) operation technology. At its 3rd operation stage from year
2018 with heating power of 28MW KSTAR is aiming for stable AT operation mode with full D-D plasma. At the last operation stage KSTAR would be utilized as a DEMO relevant facility.
The equally probable D-D fusion reactions are occurring in a deuterium plasma, one producing 2.45MeV neutrons and the other producing tritium, which are confined in the plasma and undergo D-T reactions, and produce 14.1MeV neutrons. Since the tritium population is quite small compared to deuterium ions, the 14.1MeV neutron production are about 2% of the 2.45MeV neutrons.
When these fusion reaction generated neutrons are irradiated onto the internal structure of tokamak all of the components are activated and give a serious radiation safety cause to human beings and delicate internal components. And as accurate as possible prediction of the amount of activation is very much required for operation licenses of KSTAR at its 3rd stage high power
operation.
A 90° sector model developed at KAIST and
POSTECH had a rather simplified Tokamak structure [1]. In particular, structurally simple PFC, vacuum vessel and port were adopted. Also material information used
for in vessel components and most of structure were not reflecting most updated material component data. This research specifically reduce the calculation error by implementing a more refined and accurate structural data with updated tokamak structure material information.
2 Calculation
A Monte-Carlo model for KSTAR was developed for the analysis of neutron activation. A 3D CAD of the KSTAR [2] was converted into a geometrical input file for Monte-Carlo calculation through CAD interface program, MCAM [3].
This model is based on a 90° sector of KSTAR tokamak which contains the symmetry of both the vacuum vessel and in-vessel components. Smaller MCNP cells are added to have a neutron spectra at the various locations. Neutron analysis are performed for the central solenoid(CS) coil, toroidal field(TF) coil and poloidal field(PF) coil and nuclear heating.
Calculation of the shutdown dose rate are the so alled Rigorous two-step method (R2S) developed by FZK [4,5] and the second is the Direct one-step method (D1S) [6,7] developed by the ITER team and ENEA.
Both method, even if with different approches use the MCNP Monte Carlo Code[8], for transport calculation, and the FISPACT [9] inventory code.
calculation (FISPACT) using of the MCNP neutron flux spectra and the irradiation history, finally, a decay gamma transport calculation (MCNP, 2nd step) based on
FISPACT decay gamma source distribution provieds the dose rate at the specified locations.
D1S method is based on the assumption that the decays gammas of the radioactive nuclides are promptly emitted ; hence, the neutrons and decay gammas are transported in a single MCNP run. The time correction factors required to take into account the build-up and the decay time of each radionuclide according to the real irradiaion history are calculated using FISPACT.
For these neutronics calculation FENDL 2.1 nuclear data library and special libraries for D1S are used.
The simulation assumed 100s pulse length for eachs hot with 30 minute shot to shot intervals and 10 shots per day during 7 days per week operation.
For a neutron source profile for MCNP calculation FTU neutron profile is adopted [10]. FTU neutron emission profile, obtained from ohmic and pellet fueled discharges, shows the neutron brightness profile, obtained by averaging data from 5 consecutive ohmic discharges with similar operation parameters. The solid line is a fit on the experimental data assuming a neutron
emission profile of , where
.
Fig. 1. Neutron emission profile resulted from ohmic discharge of FTU
3 Results
3.1. Central Solenoid coil (CS coil) shutdown dose rate calculation
Calculated the shutdown dose rate using the D1S and R2S methods.
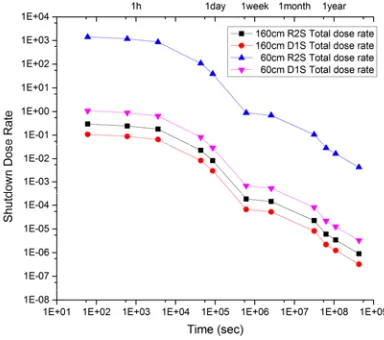
Figure 2 is to show the shutdown dose rate of the CS coils. The measurement locations are 60cm (coil central) and 160cm (coil uppermost) from the center of plasma core. Although D1S and R2S results in a similar trend, they show a difference of approximately double. If the
about a year to access the center of the coil. But, estimated that the R2S method will be accessible in about three days.
Fig. 2. CS coil shutdown dose rate of 60 and 160cm point from plasma center
The half-life of major radioactive materials is as follws : 60Co 5.27years, 58Co 70.86days, 51Cr 27.7days, 94Nb 2.03x10⁴ years. Figure 3 and 4 represent of each
radioactive material, depending on the distance from plasma center.
ITER uses Nb3Sn and NbTi superconducting
magnets such as KSTAR. The 60Co, 58Co, 51Cr, and 94Nb
isotopes were produced by the reaction of the NbSn3
superconducting magnet.
From Figure 3 and 4, can see that the 60Co and 94Nb
have a long lasting dose after shutdown. 60Co emits
0.324MeV beta radiation and 1.17MeV, 1.33MeV gamma rays and main contribute to the total shutdown dose rate after 1month, 51Cr emits 320keV gamma ray
and 5keV X-ray and disappear after 1-month. 60Co and 51Cr D1S and R2S method results error is relatively
small. 58Co and 94Nb are small contributors to total
shutdown dose rates. However, the dose rate difference varies considerably according to analysis methods. 58Co
emits 810.8keV gamma-ray and 474keV maximum beta+ decay. 94Nb emits 2.045MeV beta- decay.
3.2. Toroidal Field coil (TF coil) shutdown dose rate calculation
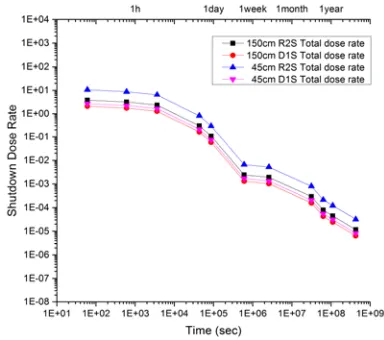
The inner part of the CS and TF coils are located in a similar distance from the plasma. But TF coil is located close to plasma a little more than CS coil. The analytic locations are an inboard side of 45cm and outboard side of 150cm from the center of the plasma core. Closer the distance from plasma, it is possible to verify that the shutdown dose rate difference is increasing.
Fig. 5 TF coil shutdown dose rate of 45 and 150cm point from plasma center
Figure 5 is to show the shutdown dose rate of the TF coils. Depending on the calculation method the shutdown dose rate of 45cm points of out a difference of about 3 times, in the case of 150cm points difference of about 1.5 times. However, there is not much difference in shutdown dose rates compared to the overall CS coils. If the dose rate for the maintenance is 10-3 Sv/h, at the all
of the TF coils, then it is estimated that it will be accessible for approximately fewer than three days after shutdown.
Fig. 6. The main nuclide dose rate of TF coil of 150cm point from the plasma center
Fig. 7. The main nuclide dose rate of TF coil of 45cm point from the plasma center
Looking at the 94Nb graph in figure 6 and 7, D1S and
R2S method results difference are bigger than 160cm distance from plasma core the CS coil result. The reason for difference can be assumed to be dependent on the distance from the plasma. One more specific detail, 58Co
has almost same results using both methods. When comparing the CS coils and the TF coils, it is possible to ascertain that only 60cm distance from plasma core dose rate trend results of the CS coil is different.
3.3. Poloidal Field coil (PF coil) shutdown dose rate calculation
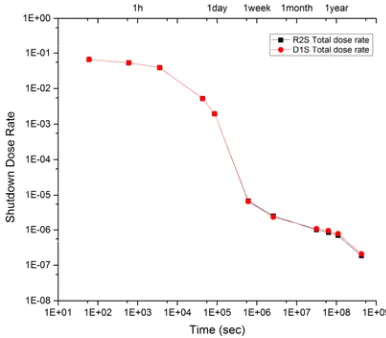
Fig. 8. TF coil shutdown dose rate of 240cm point from plasma center
The results of shutdown after one month are very similar to the two methods. After a month, shutdown dose rates vary slightly. However, both methods require approximately two days of access for maintenance. Figure 9 below shows the dose rate for the four major radioactive materials.
Fig. 9. The main nuclide dose rate of TF coil of 240cm point from the plasma center
The 60Co, 94Nb, 51Cr three radioactive material dose
rate results can be found to have small difference in the analysis methods. However, the 58Co although the total
dose rate contributes to small, the difference in dose rates can be found to be much better than the other coils. The total shutdown dose rate of the PF coils depends on
60Co, like CS coils. But PF coils are more quickly
stabilized than CS coils. Attention to the results of 94Nb,
we can show that low error rates at 1day after shutdown. This results seems a big difference in CS coils results. Especially CS coil is exposed to the high dose rates, we suspect the error in the high-dose rate Niobium libraries. Relatively low dose rate PF coils can be said to be relatively accurate results.
Fig. 10. Nuclear heating of main parts of Tokamak structure
Figure 10 shows time variation of nuclear heating for the major components KSTAR tokamak after shutdown. TF coils which are closer to the core plasma than CS coils shows less nuclear heating than that of CS coils due to its material composition difference. About 3 days after the nuclear heating appears to have been investigated by 10-9 kW/kg level. This means the temperature change of
the nano-pico level, the heating of the superconducting magnet according to the nuclear heating can be seen that very little.
4 Summery and future work
By assuming KSTAR full D-D operation phase plan activation analysis are performed.
For a maintenance of KSTAR, from this analyses it take about a week after shutdown of tokamak operation to access tokamak core while for an access to the outside of KSTAR cryostat it needs 3 days after plasma operation.
For Niobium superconducting magnet there is increasing SDR results differences from two different analysis method as analysis points approaches to the plasma center. Especially for 94Nb SDR results from
two methods differences increasing as analysis points approaches to plasma center while for 58Co trend is
reversed. For these outcome further analyses are required by adopting different nuclear data libraries.
In addition since the above analyses excluded the effect of high dosage gamma rays from 16N of cooling
water it need further analyses which include the additional influences from the outside of magnet system.
Acknowledgments
This work was supported by the Ministry of Science, ICT and Future Planning of the Republic of Korea under the Korean ITER project contract.
References
1. Hyunduk Kim et al., Radioactivity evaluation for the KSTAR TOKAMAK, Radiation Protection Dosimetry, Vol. 116, No. 1-4 pp. 24-27 (2005)
2. M.S. Cheon et al., Diagnostic neutron activation system for KSTAR, 2nd International Workshop on
Fast Neutron Detectors and Applications (2011)
3. FDS TEAM collaboration, Y. Wu, CAD-based
interface program for fusion neutron transport simulation, Fusion engineering and Design 84 (2009) 4. Y. Chen, U. Fischer, ITER-FEAT, Shutdown dose
rate analysis by Rigorous method final report on Contract EFDA/00-564 FZK Internet Bericht IRS Nr. 9/01, FUSION Nr. 177 (2001)
5. Y. Chen, U. Fischer, Rigorous MCNP based
shutdown dose rate calculations: computational scheme, verification calculations and applications, ITER Fusion Eng. Des. 63/64 107-114 (2002) 6. H. Iida, D. Valenza, R. Plenteda, R. T. Santoro
AND J. Dietz, Radiation Shielding for ITER to allow for Hands-on Maintenance inside the Cryostat, J. of Nuc. Sci. and Tech., Supplement 1. 235-242 (2000)
7. L. Petrizzi, H. Iida, D. Valenza and P. Batistoni, Improvement and benchmarking of the new shutdown dose estimation method by Monte Carlo code, Advanced Monte Carlo for Radiation Physics, Particle Transport Simulation and Applications, Proceedings of the MC2000 conference 23-26 Oct. 2000 Lisbon, Portugal. Springer 865-870 (2001) 8. J. F. Briestmaister, Ed, MCNPTM,--a general Monte
Carlo N-particle transport code, Version 4C3, Los Alamos Nat. Lab. Report, LA13709-M (2000)
9. R. Forrest, FISPACT-2007 User Manual EASY
2007 Documentation Series UKAEA FUS 534 (2007)