Journal of Nuclear Materials 139 (1986) 185-190 North-Holland, Amsterdam
185
THE FREQUENCY DEPENDENT RESPONSE OF THE ELECTRICAL IMPEDANCE OF UO,
R.N. HAMPTON, G.A. SAUNDERS
.%hool of Ph~wics, Unruersity of Bath. Cluverton Down. Bath. BA-7 7A K United Kingdom
and
A.M. STONEHAM
Theoretical P@sics Division, A. E. R. E. Narwei~, Didcot, Oxot~, OXI I ORA, United ISingdom
Received 17 February 1986; accepted 5 March 1985
AC impedance techniques in the frequency range 5 Hz to 5 MHz have been employed to measure dielectric properties of single crystal UO, in the form of plate specimens. The dielectric constant has been measured down to 4 K, giving results consistent with previous reports. Both barrier and volume effects have been shown to contribute to the measured Impedances. The barrier effects account for the anomalously large capacitances observed in previous attempts to measure the dielectric constant by the conventional plate technique. Activation energies for carriers in both boundary and bulk regions are similar [&I8 to 0.25 eV). The behaviour is consistent with the presence of electronic holes present in the concentrations to be expected from stnall deviations from stoichiometry
1. In~~uction
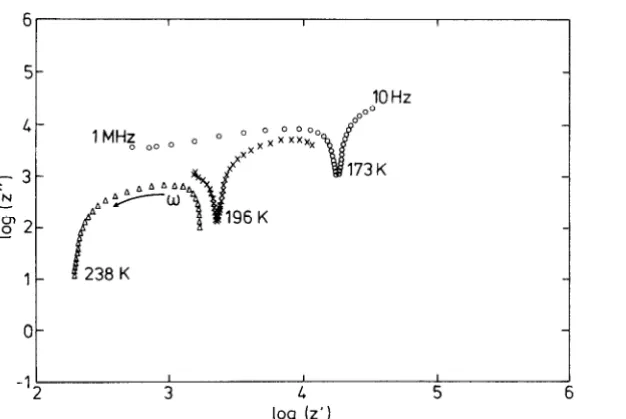
The static dielectric constant tSt of UO, has been measured by a number of workers (l-6]. Typical values of f,, (24 [I] and 21.5 (51) obtained from optical mea- surements are confirmed by recent microwave measure- ment (21 [6]). However, the conductivity of UO, lies in such a range that ac bridge measurements made on a standard sample in the form of two parallel col~ducting plates with UO, as the dielectric medium give rise to an anomalously large capacitance and hence an unreaiisti- tally large value of rSt j1.41. As the temperature is reduced the impedance changes in such a way that the measured E,, tends towards the accepted value of about 21; increasing the bridge measurement frequency has the same effect [4]. In the previous work [4] on the response of UO, to an ac electric field only a limited number of frequencies were available. Impedance mea- surements have now been extended to cover a much wider freyuency range. This has enabled us to tap a much greater body of data for the frequency dependent response of UO, when in the form of plate samples. This data is extensive enough to allow detailed analysis by projection onto the complex impedance plane. De- tails of the procedures adopted are given in ref. [7]:
previously such techniques have been successfully usea [8] in studies of the ac electrical properties of yttria- stabiliscd zirconia.
2. Experimental
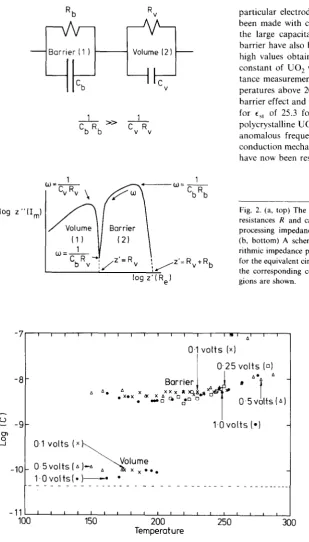
is normally attributed to a thin barrier layer, which is characterized by high values of capacitance and resis- tance. Region 1 represents the bulk properties of the sample having the larger time constant due to a more conducting nature and the larger dimensions of the bulk of the crystal itself. The logarithmic representation of the complex impedance plot anticipated for the equiv- alent circuit in figure 2a is sketched in fig. 2b. This illustrates the features which enable extraction of the capacitance and resistance values corresponding to the barrier and volume circuit elements. In the present study complex impedance plots of the type given in fig. I have been measured at temperatures between 100 K and 300 K and preliminary measurements have been made at 4.2 K. Values of the two capacitances C, and C, calculated from these data are shown in fig. 3. Above about 200 K in the frequency range studied the imped- ance is dominated by the barrier element alone and the capacitance obtained cannot be regarded as repre- senting the dielectric properties of the UO, crystal. Below about 200 K the region due to the volume effect also comes into play so that the volume capacitance can also be obtained. These results are consistent with a dielectric constant est of 36, somewhat larger than that (in the range of 20) obtained by microwave [6] or optical [1,5] measurements. However the frequency re- sponse method described here has now been extended
down to low temperature measurements and does gtvc ;i value of 24 for fit at 4.2 K and at 77 K. The difference
(AC\, - 12) between the values obtained for e,, a: 150 K and above and 77 K may be attributable to drpolc orientational effects becoming less important \v ith de- creasing temperature. On the basis of the Clausius Mosotti approach (including a local field correction), for dipoles comprised of a hole and an oxygen intersti- tial, a deviation from stoichiometry at most of about 0.005 would be sufficient to lead to a dipolar contribu- tion large enough to account for the measured dif- ference dr,,. Such a deviation is well within the limits of the possible range of oxygen concentration in the UC& crystals used to make the measurements. Low tempera- ture (< 80 K) dielectric measurements have not been made on the Norton crystal. so an estimate of the excess stoichiometry for this crystal is not available.
Measurement of the dependence of the hurrrcr capacitance C, upon the voltage I;‘, applied across the barrier enables the barrier properties to be investigated further. The technique used has beeen to plot dV,,:d C‘, ’ against e,,c,/C,. following the method used previously- to analyse barrier contributions to the conductivity of rutile and hence find the barrier thickness [9]. In the present instance, the barrier thickness of a UO, crystal at 291 K has been estimated as being about 600 .A. ‘To find out whether the effects observed are due to the
6 1 I ,
5-
F 3- N - g 2-
l-
O-
-‘2
I I I
3 1 5 6
log (2’)
R.N. Hampton et al. / AC impedance measurements on UO, angle oystals 187
log z ”
Rb
- Barrier II 1 - Volume I21 -
i I I
‘b 1 lc V
1
-
”
1‘b Rb CvR V
-7
-0
G -9
0” -I
-10
-11 I(
1
‘bRb
particular electrodes (aluminium) employed, tests have been made with coatings of silver paint and platinum; the large capacitance values associated here with the barrier have also been found using these materials. The high values obtained previously [4] when the dielectric constant of UO, was tentatively assessed from capaci- tance measurements made at low frequencies and tem- peratures above 200 K can now be associated with the barrier effect and the low temperature limits found then
for es1 of 25.3 for a UO, single crystal and 22.8 for polycrystalline UO, to the bulk material itself. Thus the anomalous frequency dependences inferred [4] for the conduction mechanisms and dielectric behaviour of UO, have now been resolved.
Rv+Rb
Fig. 2. (a, top) The two region series-parallel combination of resistances R and capacitances C employed as the model for processing impedance data of the type illustrated in fig. 1. (b. bottom) A schematic representation in the complex loga- rithmic impedance plane of the theoretical behaviour expected for the equivalent circuit of fig. 2a. The features used to extract the corresponding component values for each of the two re- gions are shown.
0.1 volts (Xl\
I
\
0 Svalts (A 1-A ~ Volume x X.0. 1~0volts(* 1-e l
1, I I I , I I I I I I I I I I I I I
150 200 250 300
Temperature
3. Analysis
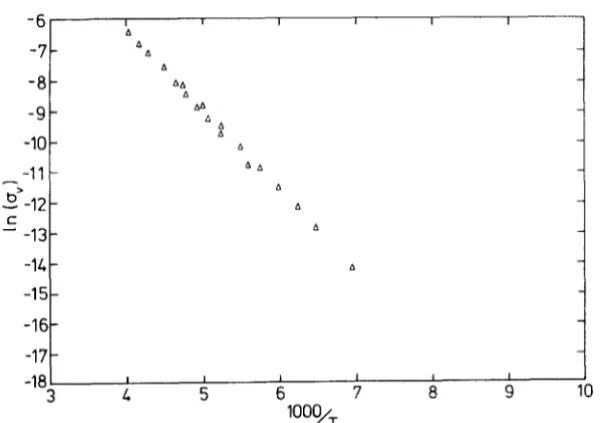
It is usual practice to interpret conductivity data for UO, by using Arrhenius plots. The conductivity, mea- sured for this sample geometry in the volume region [2] is given in this format in fig. 4. The use of the imped- ance plane technique allows the conductivity data to be fitted readily to both models currently employed to evaluate the possible conduction processes in UO,. namely (i) band conduction (eq. 1) and (ii) small polaron conduction (eq. 2):
In e = In o, - E,/kT, (1)
In( aT) = In ai - EA/kT. (2)
The activation energies ( EA and EL) and pre-factors (u. and ui), obtained by a least squares analysis, are given in table 1. One of the single crystals studied was that supplied by Norton Research; it is much more friable, and this has been attributed to a more defective structure than the other crystal (from Degussa). This more defective nature is supported by the order of magnitude difference in the pre-factors, both ua and UC;. for the two crystals, which is considered not to be due to stoichiometric differences. The activation energies obtained for the volume region are somewhat larger than those reported by several earlier workers (0.17 eV [lo], 0.14 eV [ll], 0.13 eV [12]) but are comparable to that (0.22 eV) obtained [4] at lower temperatures where
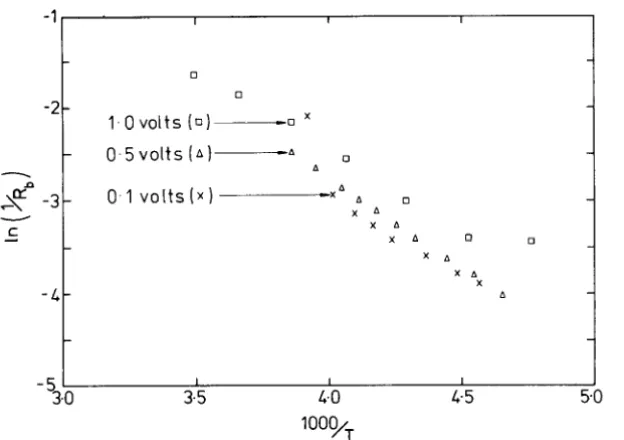
the volume effect has now been shown to dormnatc. i kc activation energy (0.17X & 0.015 eV) for conductior; in the barrier region is smaller than that 111 the ~~olumc. however, the finding that it is comparable m magmtudc to that in the bulk is instructive. in that it indicates that the barrier is in fact comprised of 1.10, but that II\ properties are modified (possibly by space charge m the vicinity of the metallic electrodes). Experimental c\ !- dence for this viewpoint comes directly from values obtained for the equivalent circuit components. A tlpi- cal example can be taken from the results in fig 1, ,II 238 K the volume resistance for this particular c.r>>tai (thickness 0.5 mm) is 203 52 while the barrier resistance ia 1.53 0: the resistances of the two regions are con- parable in magnitude. Fig. S presents the .Arrhenius plot as In(l/R,) versus l/T for the resistance measured for the barrier region. For this region the resistance de- pends also upon the applied ac voltage. an effect which is characteristic of a poorly conducting, highly capacl- tive barrier region [7] and provides additional experi- mental evidence for the identificatton of the two regtons observed in the impedance profile>. ,Zs might hc CX- petted no driving voltage dependence IS observed to bc associated with the conductivity of the bulk regton. Furthermore the gradient of the high frequency end of the volume profile (as exemplified by the I73 K proftle in fig. 1) is 0.5. showing that the circular impedance arc passes through the origin on a conventional %’ vcrsu\
-6
h
I I I I I 3-7- 0
d d
-8- AA
d
-9- &
n
-10 - % 0
-11 - Ad
-> b
b -12 - d
-c
-13- &
-1L - b
-15-
-16-
-17 -
-18 I I , I , I
3 L 5 6 7 8 9 10
1000/T
R.N. Hampton et al. / AC impedance measurements on UO, sin& cytals 189
-2-
- g-3-
C
-G-
-5' 3.0 3.5 1 4.0 I 4.5 I 50 I
1ooo/T
Fig. 5. The barrier resistance of a plate specimen of monocrystalline (Norton) UO, plotted as ln(l/R,) against 1,‘~ to enable determination of the activation energy. The barrier R, depends upon the driving voltage (x = 0.1 V, a = 0.5 V, q z 1.0 V).
Z” graph, as it should [7] for the model in fig. 2. Hence the volume circuit may be expected to represent fully the electrical response up to the high frequency limit.
even for the four-probe methods used, the existence of a barrier might influence resistivity measurements.
The identification of a barrier associated with dielec- tric constant measurements now raises the question of possible effects on conductivity data. It is interesting to note that the accepted high temperature conductivity data of Bates [lo] and Killeen [ll] have been measured at either dc or at low frequencies (0.005-5 kHz). Such measurements would be well within the barrier dominated regime at temperature of 300 K or above:
Acknowledgements
We are grateful to Dr. J.E. Macdonald for many useful discussions and to Dr. M.T. Hutchings for supplying the single crystals. This work was supported under an E.M.R. contract with A.E.R.E., Harwell.
Table 1
Activation energies and Arrhenius equation prefactors for UO, single crystals
Crystal Pre-factor (K’m-‘) Activation energy
supplier (eV)
Band i
NR” 34.6 * 4.6
Conduction Db 2.85_+ 0.14 > =“”
0.228 * 0.003 \ = E 0.244kO.001 1 *
Small NRa
Polaron 1 Db
Ln(l/R,) vs. l/T NR”
a Single crystal supplied by Norton Research. b Single crystal supplied by Degussa.
6844 k881 0.246 i 0.003
512 k 40 > = 0d 0.262 k 0.002 > = E,
A
190 R.N. Hampion et al. / AC‘ impedance measuremerlts on UO, srngle crvstu1.c
References
[I] J.D. Axe and G.D. Pettit, Phys. Rev. 151 (1966) 676. [2] S. Iida, Jap. J. Phys. 4 (1965) 8333838.
[3] W. Hayes and A.M. Stoneham, Crystals with the Fluorite Structure, Ed. W. Hayes (Clarendon Press, Oxford. 1974) Chap. 2, p. 43.
[4] N. Hampton, E.A. Saunders, G.A. Saunders, D. Vigar and A.M. Stoneham, J. Nucl. Mater. 132 (1985) 1566159. [5] J. Schoenes, Phys. Reports 63 (1980) 301-336. [6] J. Tateno. J. Chem. Phys. 81 (1984) 6130-6135.
[7] A.K. Jonscher, Dielectric Relaxation in Solids (Chelav~ Dielectrics Press. Chelsea, 1983) p. 62~-86.
[X] P. Abelard and J.F. Baumard. Phvs. Rev. B62 (1582) 1005 -1017.
[9] F. English and B. Gossick, Solid-State Electron. 7 (1964) 193-204.
[lo] J.L. Bates. C.A. Hinman and T. Kawada, J. Am. Ccram. Sot. 50 (1967) 652-656.