Exploring for oil with nuclear physics
Marie-Laure Mauborgne1,a, Franc¸oise Allioli1, Chris Stoller2, Mike Evans2, Mauro Manclossi1, and Luisa Nicoletti1
1 Schlumberger Riboud Product Center, Clamart, France
2 Sclumberger Houston Formation Evaluation Integration Center, Sugar Land, TX, USA
Abstract. Oilfield service companies help identify and assess reserves and future production for oil and gas reservoirs, by providing petrophysical information on rock formations. Some parameters of interest are the fraction of pore space in the rock, the quantity of oil or gas contained in the pores, the lithology or composition of the rock matrix, and the ease with which fluids flow through the rock, i.e. its permeability. Downhole logging tools acquire various measurements based on electromagnetic, acoustic, magnetic resonance and nuclear physics to determine properties of the subsurface formation surrounding the wellbore.
This introduction to nuclear measurements applied in the oil and gas industry reviews the most advanced nuclear measurements currently in use, including capture and inelastic gamma ray spectroscopy, neutron-gamma density, thermal neutron capture cross section, natural neutron-gamma ray, neutron-gamma-neutron-gamma density, and neutron porosity. A brief description of the technical challenges associated with deploying nuclear technology in the extreme environmental conditions of an oil well is also presented.
1. Introduction
In the oilfield industry, exploration of the subsurface is essential to answer questions regarding location, type and quantity of hydrocarbon, and its producibility. Well logging provides measurements of the rock formation characteristics and of the fluids present in the formation’s pore spaces.
The main nuclear measurements in the oilfield determine the following formation properties: density, neutron porosity, sigma (macroscopic thermal neutron capture cross section) and composition from gamma ray spectroscopy and provide information about the rock (matrix) and the fluid in its pore space. They combine measurements based on a radioactive source, a neutron generator and secondary gamma ray generation. These measurements are complemented by measurements of formation resistivity, acoustic wave propagation, and nuclear magnetic resonance (NMR) response among others.
Measurements can be acquired either during the drilling of the well using sensors in the drilling assembly, i.e. logging while drilling (LWD), or after the well has been drilled, using a sensors lowered into the well on the end of an electrical cable, i.e. wireline logging.
The downhole drilling environment to which LWD tools are exposed can be severe. These tools must work at temperatures that may exceed 175◦C, are exposed to repeated shocks of 100 gnand more, and must be protected by pressure housings withstanding downhole pressures of 2000 atmospheres or more.
In those difficult environments, delivering accurate and reliable measurements is a challenge.
ae-mail:[email protected]
2. Well logging
Well logging provides measurements to help answer four questions of primary interest in the production of hydrocarbons [1]:
• Are there hydrocarbons? • Where are the hydrocarbons?
• How much hydrocarbon is contained in the formation? • How producible are the hydrocarbons?
The subsurface environment is a tough place for any kind of measurement. It combines temperature, pressure, shocks, and the presence of various fluids. The design of well logging tools is strongly impacted by these constraints, yet measurements must remain accurate. For example, the enormous temperature variations make gain stabilization of downhole detectors challenging and several approaches have been developed for autonomous regulation downhole.
As the measurements are used to compute hydrocarbon reserve estimates on which business-critical decisions are made, very accurate and precise measurements are required. For example, rock density must be measured with an accuracy of better than 1%.
Because rig time is very expensive, the measurements must be acquired as quickly as possible. To have a good overview of the subsurface profile measurements are generally acquired in 15-cm intervals. The respective acquisition time per measurement depends on the speed at which the sensors move in the hole. It may be as short as 0.5 s in wireline and a minute or longer while drilling.
During logging, multiple environmental conditions such as hole diameter, distance between the tool and the formation (i.e. standoff), borehole fluid, and even tool wear are uncontrolled or unknown parameters. Ways of compensating or correcting for these environmental effects must be found during algorithm development.
Figure 1.Example of wireline logging from [1].
Mud filtrate invasion is another effect that is often encountered. Drilling mud, which is typically composed of fine solids suspended in a fluid, is injected under pressure through the drillpipe into the well during drilling. The downhole wellbore pressure is generally higher than the pressure of the fluid in the formation to prevent formation fluids entering the wellbore. This overpressure may cause the mud fluid without any suspended solids to enter the formation near the wellbore. As the depth of investigation of nuclear measurements is limited, the instrument may measure characteristics of the invading fluid instead of the one that was originally in the rock.
2.1. Wireline
Figure 1 presents a typical wireline land acquisition configuration. At the surface, there are the rig and the truck that powers the wireline tool and records the measurements.
At the bottom of the hole, a tool is shown with its arms open to measure the hole size. Some sensors can be located in the arms to be closer to the formation.
Between the truck and the tool, an electrical cable is used to lower the tool into the well, provide power and transmit commands to the tool, and transport data back to the surface.
One of the main challenges in wireline-conveyed measurement development is the logging speed. Unlike LWD, where the tool movement is limited by the drilling speed. Logging speed can be above 500 m/h, providing an acquisition time of less than 1 s per point.
New measurements have traditionally been deployed first in wireline-conveyed tools due to the less severe environmental conditions, and later ruggedized for the harsher LWD environment.
2.2. Logging while drilling
Figure 2 illustrates the differences between wireline and LWD services. When drilling a well, the logging tool is autonomous in the bottom hole assembly (BHA), which
Figure 2. LWD (left) and wireline (right) sensor deployment comparison.
is generally composed of a drill bit, in some cases a directional drilling system, a communication tool and logging tools. The drilling speed varies widely depending on the bit and formation characteristics, but may be approximately 60 m/h, corresponding to an acquisition time of 10 s per point.
Communication between the BHA and surface is performed acoustically through the mud in the drillpipe using mud pulse telemetry, which provides a bandwidth of about 16 bits/s. A downhole turbine generates electrical power from the mud circulating through the drillpipe. A power budget of around 100 W is allocated to operate all the tools in the BHA, which may include a pulsed neutron generator (PNG), the suite of detectors and their photomultipliers, the on-board electronics, and communications in the case of a nuclear tool.
LWD tools are larger and heavier than their Wireline equivalent as they form part of the drill string and add weight on the bit. The presence of a mud channel to allow mud to flow down through the LWD tool limits the space available for detectors. For example, the detectors occupy less than 1% of the volume of the tool in the multifunction logging-while-drilling service.
Formation evaluation measurements during drilling face multiple challenges, especially for nuclear measure-ments:
• High pressure, temperature and shock levels are not easily compatible with standard nuclear detection systems (such as a scintillation crystal coupled to a photomultiplier) or with a neutron generator.
• The large tool and thick drill collar have a significant impact on both outgoing and incoming nuclear radiation.
• Data acquisition and measurement control are autonomous because there is limited or no communi-cation from the surface to the tool.
• Slow data transmission makes it necessary to store large amounts of data in the tool for retrieval at surface. • Variation of the tool position in the hole and of the
standoffdue to tool rotation and
• Variation in the mud circulated through the tool during changing phases of the drilling operation affect the measurement accuracy.
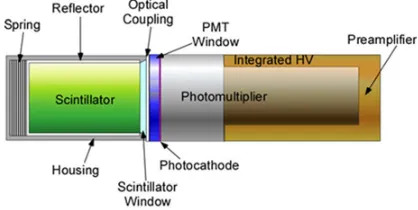
Figure 3.Typical detector construction used in well logging.
drilling, allowing real-time decisions such as trajectory changes to stay in the reservoir (i.e. geosteering) or mud weight changes to balance the well pressure with the formation fluid pressure and maintain the mechanical integrity of the formation (i.e. geomechanical stability).
3. Nuclear technology for well logging
3.1. Detection systemsTypical gamma ray detection systems in well logging tools consist of a scintillation crystal coupled to a (ceramic) photomultiplier, preamplifier, high voltage power supply (HVPS) and, in most cases, a pulse height analyzer (PHA). A sketch of a detector with an integrated high voltage power supply and preamplifier is shown in Fig. 3. The scintillator could be NaI, LaBr3, BGO, or GSO, among others. As shown, the hygroscopic scintillator (NaI, LaBr3) is encapsulated in a hermetically sealed metal housing with an exit window. The sketched PMT is of the Venetian blinds type. This structure, rarely used in laboratory tubes, has been chosen for its mechanical robustness and because it allows easy integration with the HVPS.
The integrated HVPS provides improved gain stability at high count rates and saves space. Many types of PHAs are used, with some allowing operation at count rates exceeding 2 MHz [2].
3.2. Neutron generator
As shown in Fig. 4, the neutron generator consists of a sealed neutron generator vacuum tube coupled to a high voltage supply that provides voltages from about 60 to more than 100 kV. Deuterium is ionized in the ion source, accelerated in the neutron generator tube, and impacts tritium in the target to generate high-energy (14.1-MeV) neutrons through the d(T,α)n reaction. A typical generator is 70 to 100 cm long and about 3.6 to 5 cm in diameter.
3.3. Neutron pulsing
Most neutron generators in well logging are pulsed neutron generators (PNGs). The neutrons are pulsed in short bursts, which can be combined to form a virtual longer burst [3]. The short bursts may be about 10 to 20-µs long with rise and fall times smaller than 1µs. The use of neutron bursts allows distinguishing between gamma rays from inelastic neutron scattering, neutron capture and activation.
During the neutron burst inelastic, capture and activation gamma rays are observed. No inelastic gamma rays are emitted after the burst, only capture (epithermal and thermal) and activation are present. Epithermal
4. Basic nuclear measurements
4.1. Natural gamma ray (NGR) measurementNatural gamma ray (NGR) logging was introduced in the late 1930s. This measurement helps in locating hydrocarbons by distinguishing shale from clean forma-tions. Shales, which often act as seals above reservoirs, usually include traces of natural radioactive components such as potassium, uranium and thorium (or their daughters), whereas reservoir rock usually contains very little radioactive material. The NGR measurement is also used for well-to-well correlation. Characteristic patterns of geologic layers are often repeated across a given area. Correlating their NGR signature between wells enables the construction of 3D map of the layering across a field to be developed.
It is now possible to acquire a spectral natural gamma ray measurement, which delivers the individual potassium, uranium and thorium concentrations in the formation, in addition to the total natural gamma ray measurement, allowing clay mineral identification. This is widely used in shale gas and shale oil applications.
4.2. Density porosity
The motivation for the measurement of density (ρ) comes from its direct link to formation porosity (ϕ), a critical parameter in formation evaluation.
ρDφρfC(1−φ)ρma (1)
whereρfis the fluid density andρmathe density of the rock matrix. The most common reservoir rocks are sandstone (ρmaD2.65 g/cm3), limestone (ρmaD2.71 g/cm3) and dolomite (ρmaD2.85 g/cm3). Appropriate choice for ρma is crucial for the density porosity computation and is often derived from other nuclear measurements (photoelectric factor or more recently capture spectroscopy).
Traditionally, a density logging tool emits gamma rays from a chemical source, generally137Cs, and measures the returning Compton-scattered gamma rays in at least one gamma ray detector, generally an NaI crystal coupled to a PMT, to determine the electron density. In subsurface formations, the atomic number rarely exceeds 20, so Compton scattering is the dominant process. For most elements, Z/A is approximately 0.5. Based on this, a relation between formation density and electron density has been established that accounts for the Z/A value for hydrogen [4].
Figure 4.Schematic neutron generator layout.
Figure 5.Traditional density porosity tool.
Figure 6.Lithology identification using the photoelectric factor (or Pe), related by definition to the average atomic number through the relationship:Pe≡(Z/10)3.6. This parameter is directly proportional to the photoelectric cross section per electron with the energy dependence suppressed.
4.3. Effective atomic number and photoelectric factor
The density logging tool is also used to estimate the effective atomic number (Z) of the formation by using the low energy gamma ray signal arriving in the detector. In earth formations, the photoelectric effect dominates at gamma ray energies below 100 keV. The calculated photoelectric factor [4] is used as a lithology indicator because different formation matrices have different effective Z values, making them easily distinguishable even for different porosities, as shown in Fig.4.
4.4. Neutron porosity
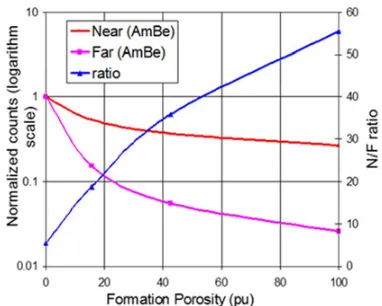
A radioactive source, such as241AmBe, or a d-T neutron generator, is generally used for this measurement. Two neutron detectors, typically 3He tubes, are placed at different distances from the source (near and far) to record the number of neutrons at these spacings.
The measurement of the neutron porosity relies on the fact that the distance, over which neutrons are slowed down is dominated by the presence of hydrogen in the water or hydrocarbon in the pore space. This is illustrated by the rapid decrease of count rates in the near and far detector with increasing fluid filled porosity as shown in Fig.7.
Figure 7.Relation between count rate and porosity, and near/far ratio and porosity.
1 2 3
Figure 8. A basic triple combo log display and associated interpretation.
Typically, the porosity is derived from the ratio of the two detector count rates. Taking the ratio reduces the impact of environmental effects such as salinity (chlorine is a neutron absorber), temperature and mud composition on the response.
5. How to find hydrocarbons
The use of natural gamma ray, density and porosity measurements is enough to give a first idea of the presence of liquids or gas. However, the measurement does not identify hydrocarbons. Therefore, the nuclear measurements are generally complemented by a formation resistivity measurement. This combination of logs is called the triple combo (density, porosity and resistivity). In the subsurface rock, water contains salt, making the formation fluid conductive whereas oil and gas are resistive.
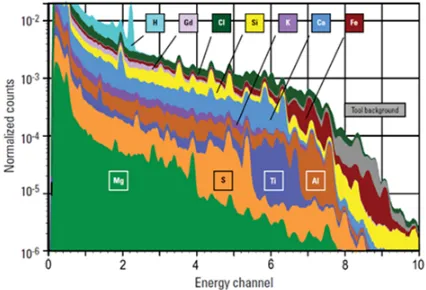
Figure 9.Example of a capture spectroscopy spectrum and the contributing elemental standards used to determine the relative abundance of each element.
Neutron and density porosities (Track 3) overlay in water-filled clean formations of the mineralogy defined during processing. Separations provide information about fluid type; very large separation can be seen in gas (due to the low Hydrogen content and low bulk density of the gas), less separation is observed in oil, and a reverse separation may be observed in very salty water.
6. Advanced nuclear measurements
Triple combo logs are often sufficient to determine the presence of hydrocarbons. For more accurate quantification of the reservoir, advanced measurements are needed.6.1. Sigma
The use of PNGs facilitates measurement of the macroscopic thermal neutron absorption cross section of the formation, called sigma. When a neutron burst (10 to 200µs long) is emitted by a PNG, Sigma is determined through the die-away of the thermal neutrons or the capture gamma rays after the neutron burst: the faster the die-away, the higher the sigma value. Sigma is very sensitive to the presence of chlorine because of its high capture cross section. As water in subsurface formations is often very saline, this allows the water content in the pores to be determined if the water salinity is known. As hydrocarbons do not contain chlorine a low sigma value can indicate the presence of oil. This is used to determine the quantity of (salty) water mixed with hydrocarbons in the pore space of the formation.
This is an important measurement to determine the quantity of hydrocarbon. In addition to being used in open hole formation evaluation, the Sigma measurement can also be acquired through casing and cement after the well has been completed, allowing reservoir monitoring to track fluid movements throughout field production [3].
6.2. Spectroscopy
Neutron-induced gamma rays can provide a wealth of information on the formation composition. Early gamma ray spectroscopy measurements in well logging used large NaI detectors and even the use of a germanium detector was attempted. The recent introduction of the LaBr3
reservoir fluids through the measurement of carbon and oxygen inelastic gamma rays.
The response spectrum measured in a detector for a particular element is determined in the laboratory. This response spectrum is called a standard spectrum, which is specific to an element and for a given detector configuration. The response includes spectral changes due to gamma ray scattering on the way to the detector, the spectral distortion produced by the crystal itself, and the detection process in the crystal. The total energy spectrum measured in a well is reconstructed as a linear combination of these standards as shown in Fig.9. The reconstruction uses a weighted least-squares fit that takes into account gain and non-linearity variations of the detector due to temperature.
Lithology is reconstructed from elemental concentra-tions based on a mineralogy model, called a closure model. It accounts for unmeasured elements as not all elements provide a capture signature that can be measured [5].
6.3. Sourceless neutron gamma density
For many years, there has been a need to find an alternative to the radioisotope-based density measurement. The 60-GBq or higher 137Cs sources used in the traditional density measurement may pose health, security, and environmental risks. PNGs provide a much less risky alternative. Pulsed-neutron generators produce 14-MeV neutrons, many of which undergo inelastic collisions with nuclei in the formation.
These inelastic interactions are typically followed by the emission of a variety of high-energy gamma rays. Similar to the case of the traditional density measurement, the transport and attenuation of these gamma rays is a strong function of the formation density. However, the gamma-ray source is now distributed over a volume in the formation. Even though the physics is more complex, it is possible to measure the formation density if the fast neutron transport is taken into account when deriving the density answer [6]. This is why this measurement involves gamma ray and neutron detectors at the same time. In the NeoScope†sourceless formation evaluation-while-drilling service, this measurement involves the detectors already used for neutron porosity and spectroscopy in addition to an extra gamma detector placed further from the neutron source.
As the density derived from neutron interactions is currently not as accurate as the traditional gamma-gamma density its use is limited to those situations where operational risks associated with use of radioisotopic sources outweigh the requirements for very accurate formation density evaluation.
7. Use of nuclear modeling
7.1. Tool developmentModeling is widely used when designing downhole tools, to deliver the best measurement quality while satisfying mechanical constraints and insuring tool integrity under
Figure 10. Example of simplified modeling for signal optimization. Color corresponds to material density.
shock, vibration and temperature. This allows optimization of detector and radiation source positions, and selection of the best materials to maximize the signal-to-noise ratio.
Figure 10 visualizes simplified modeling performed to optimize signal for a gamma-gamma density mea-surement. The goal is to reduce the number of particles reaching the detector directly through the tool without scattering in the formation. The figure is colored as a function of the materials and their density. The formation is in blue, the tool in green and the mud in light blue.
7.2. Measurement development
After a tool has been designed and built, the modeling is benchmarked against laboratory measurements with the physical tool. At this point, modeling is used to expand, complement and refine the experimental database, which is the foundation for measurement development. Based on experimental and modeled data, we derive the relationship between count rate and the physical property we want to measurement. It can be as simple as a conversion factor for NGR measurement to a complex combination of various detector count rate at specific time and/or energy range.
Then we degrade the environment of the measurement, by adding salt in the mud, increasing the distance between the formation and the tool. . . , to find the optimal corrections to apply to the measurement. For NGR measurement we need to take into account the gamma ray attenuation due to the mud between the formation and
the tool. It is a function of the distance between the tool and the formation and the density of the mud.
This allows tool performance to be predicted more accurately resulting in improved measurements and better answer products. In the laboratory, only a limited number of authentic or simulated rock formations are available. Many formations such as anhydrite or gas-filled formations are, at best, difficult to obtain in a laboratory environment. In addition, for practical and financial reasons, only a small number of rock formations with different properties, such as porosity, lithology, borehole size, and formation fluid can be used. This limits the number of laboratory measurements to a few hundred for the large and heavy (up to 3000 kg) LWD tools.
8. Conclusions
We have presented a quick overview of oil exploration measurements using nuclear physics techniques. Detailed explanations of well logging and measurement techniques can be found in [1].
With nuclear measurements, we are able to determine rock and fluid compositions and characteristics, such as density, porosity, salinity, hydrogen content. With those information combined with other measurements, we are able to locate, identify and quantify the hydrocarbon present in a reservoir.
References
[1] D.V. Ellis and J.M. Singer, Well logging for earth scientists(Springer, 2007)
[2] B. Jorian, C. Stoller, 2012IEEE NSS/MIC Conference Record(2012)
[3] M.L. Mauborgne, F. Allioli, C. Minh, R. Griffiths, C. Maeso, N. Reichel, C. Stoller, D. Murray, H. Prabawa, M. Haggag, A. AlKhoori, SPWLA 54th Annual Logging Symposium(2013)
[4] D.V. Ellis and J.M. Singer, Well logging for earth scientists,Chapter 12, 289–322 (Springer, 2007) [5] M. Evans, F. Allioli, V. Cretiou, F. Harranger,
N. Laporte, M. Mauborgne, L. Nicoletti, N. Reichel, C. Stoller, M. Tarrius, R. Griffiths, SPE Annual Technical Conference and Exhibition(2012)
![Figure 1. Example of wireline logging from [1].](https://thumb-us.123doks.com/thumbv2/123dok_us/8138173.1356511/2.595.113.224.68.317/figure-example-of-wireline-logging-from.webp)