Article
1
Estimation of Forest Stand Parameters Using SPOT-5
2
Satellite Images and Topographic Information
3
Shiqin Xie1,†,*, Wei Wang2,†,* , and Qian liu2, Jinghui Meng3, Tianzhong Zhao1,Guosheng Huang2
4
1 Institute of Information, Beijing Forestry University, Beijing 100083, China; E-Mails:
5
[email protected](S.X.); [email protected](T.Z.)
6
2 Survey & Planning Institute of State Forestry Administration, Beijing 100714, China; E-Mails:
7
[email protected](W.W.);[email protected](Q.L.);[email protected] (G.H.)
8
3 Key Laboratory for Silviculture and Conservation of Ministry of Education, Beijing Forestry University,
9
Beijing 100083, China; E-Mail: [email protected]
10
* Author to whom correspondence should be addressed; E-Mail: [email protected] (S.X.);
11
[email protected](W.W.);Tel.:+86-010-6233-8133(S.X.);Tel.:+86-010-6288-9094(W.W.)
12
† These authors contributed equally to this work.
13
14
Abstract: In recent years, remote sensing technology has been widely used to predict forest stand
15
parameters. In order to compare the effects of different features of remote sensing images and
16
topographic information on the prediction of forest stand parameters, multivariate stepwise
17
regression analysis method was used to build estimation models for important forest stand
18
parameters by using textural and spectral features as well as topographic information of SPOT-5
19
satellite images in northeastern Heilongjiang Province in China as independent variables. The study
20
results show that the optimal window to predict forest stand parameters using textural features of
21
SPOT-5 satellite image is 9×9; the ability of textural features was better than that of spectral features
22
in terms of predicting forest stand parameters; with the inclusion of topographic information, the
23
accuracy of prediction of all models was improved, of which elevation has the most significant
24
effect. The highest accuracy was achieved when predicting the stand volume (SV) (R2adj=0.820),
25
followed by basal area (BA) (R2adj =0.778), accuracy of both above models exceeded 75%. The results
26
show that models combined use of textural, spectral features and topographic information of
SPOT-27
5 images have a good application prospect in predicting forest stand parameters.
28
Keywords: forest stand parameters; SPOT-5 satellite image; textural and spectral features;
29
topographic information; estimation model
30
31
1. Introduction
32
Forests are the largest terrestrial ecosystems and carbon pool, providing us with ecological
33
services and play a significant role in bringing us with economic benefits[1]. However, in recent years,
34
with the rapid population growth and economic development, global forests are facing a series of
35
threats, including sharp reduction in forest area, degradation in ecological functions and loss of
36
biodiversity[2,3]. Forest resource survey and monitoring are significantly important to study and
37
combat climate change, environmental damage and ecological degradation.
38
The forest resources monitoring in China has been developing towards large-area, large-scale
39
and short intervals. The traditional approaches to forest resources monitoring are mostly based on
40
time-consuming and laborious field measurements, which are not conducive to area or
large-41
scale data acquisition, and cannot meet forestry production and ecological construction needs of the
42
time[4,5]. With the advantages of that information can be collected quicker over larger geographical
43
areas at relatively lower costs , remote sensing technology has been widely used in the extraction of
44
forest composition and structural parameters, providing a strong technical support for forest
45
resources monitoring[6-8].
46
In recent years, using the strong correlation between remote sensing images and forest stand
47
attributes to estimate forest stand parameters has become a hot research area, and most studies have
48
achieved satisfied results[7-9]. At present, these studies mainly focus on using RS image texture and
49
texture derived index[10], spectral features and spectral derivative index[11,12] to estimate tree height[13],
50
basal area[14], stand volume[15], biomass[7] and other forest stand parameters. However, due to wavy
51
terrain, canopy shadows, heterogeneity of forest stand structure and other issues, the quantitative
52
analysis of remote sensing images is heavily affected. To solely rely on remote sensing image to
53
establish estimation models of forest stand parameters has its constrains on accuracy and
54
applicability, etc., which limits the application of the model in large-area and large-scale forest
55
resource monitoring[16]. Related study shows that topographic information is very important for
56
estimating forest stand parameters by using remote sensing images. For instance, Wang et al.[17]
57
estimated the forest stand volume by combining spectral features of ZiYuan 3( ZY-3) image with
58
topographic information, and achieved favorable results; Hilbert and Schmullius[18] found that slope
59
has significant effect on the estimation of tree height by using Pol-InSAR data. However, the influence
60
of topographic factors on the model needs further study when using different remote sensing image
61
features and topographic information to estimate different forest parameters.
62
In this study, we combined textural and spectral features of SPOT-5 remote sensing images with
63
topographic information of the study area (such as elevation, slope, slope aspect, slope position, etc.)
64
to estimate forest stand parameters, including the number of trees (NT), basal area (BA), tree canopy
65
cover (TCC) and stand volume (SV). Three models were established to predict forest stand
66
parameters, including model only using textural features, model using both textural and spectral
67
features and model combined using textural, spectral features and topographic information. The
68
optimal forest stand parameter prediction model was selected. In the end, the selected prediction
69
model is used to produce forest stand parameters thematic maps of the study area.
70
2. Materials and Methods
71
2.1. Study area
72
The study area is located in the northeastern part of Heilongjiang Province, China, mainly
73
covering Hegang City of Heilongjiang Province and some surrounding counties (Figure 1). The study
74
area is situated in the transitional zone of the Xiaoxinganling to the Sanjiang Plain, covering a total
75
area of 14,784 km2, which has a temperate continental monsoon climate. The annual average
76
temperature is 2.8 and the average precipitation is about 640 mm. The elevation is between
52-77
1,022m, decreasing from the northwest with low-mountain and hilly areas, to the southeast which is
78
predominately plains. Hegang City is rich in forest resources, with forest area of 851,000ha, forest
79
stand volume of 56,100,000 m3, forest coverage rate of 58%. Forest type and composition is diverse,
80
with rich tree species, including red pine, white pine, water willow, amurcork-tree, birch, oak and so
81
on.
83
Figure 1. Overview and zoomed map of the study area. The zoomed maps consist of four SPOT-5
84
image footprints with sample plots.
85
2.2. Data source
86
2.2.1. Remote sensing data
87
The remote sensing data used in this study are SPOT-5 images of panchromatic image at a
88
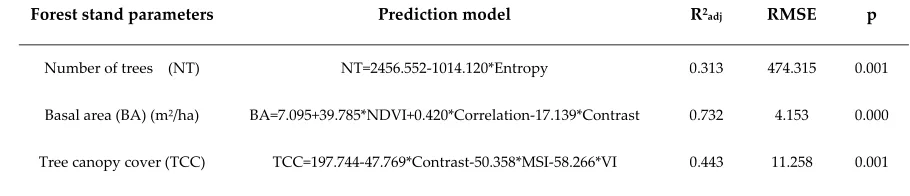
resolution of 2.5m and multi-spectral images at a resolution of 10m. The multi-spectral image consists
89
of near infrared (0.78-0.89um), red (0.61-0.68um), green (0.50-0.59um) and shortwave infrared
(1.58-90
1.75um) band. In this study, a total of 4 scenes of SPOT-5 images are used covering Hegang City. All
91
images were taken on 21 September 2006. The pre-process of SPOT-5 images mainly includes: firstly,
92
convert the image DN value to the surface true reflectivity value by using radiometric calibration and
93
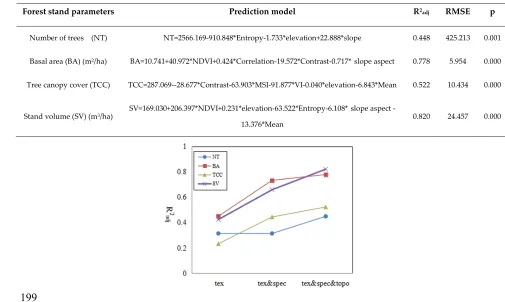
FLAASH atmospheric correction ,and then orthorectification of images based on the 1: 10000
94
topographic map of study area combining with DEM data (source: Academy of Forest Inventory and
95
Planning, State Forestry Administration), to ensure the pixel positioning errors of four images are
96
limited to the sub-pixel level after orthographic correction.
97
2.2.2. Sample plots field data in the study area
98
The sample plots field data of Heilongjiang Province during the eighth national forest resource
99
inventory in 2005 was used in this study. Each plot was systematically sampled with fixed size of
100
0.067 ha, distributed in a 4 × 6 km grid. In total, 60 sample plots within the study area were used for
101
model estimation, of which 45 sample plots were employed in model construction and the remaining
102
15 sample plots were used for accuracy evaluation. In this study, the forest stand parameters of each
sample plot were calculated by using forest resource inventory data, including number of trees (NT),
104
basal area (BA), tree canopy cover (TCC) and stand volume (SV). The above four traditional forest
105
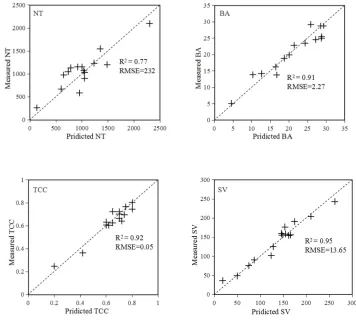
stand parameters selected in this study reflect the basic information of forest structure and can
106
provide the theoretical basis for forest management decision-making.
107
2.3. Extraction of imagery features and topographic information
108
2.3.1.Textural features of images
109
As important features of remote sensing images, textural features reveal the structural
110
arrangement of surfaces and their relationship with the surrounding environment, which are helpful
111
to improve the accuracy of image interpretation and feature extraction[19,20]. Some studies show that
112
favorable experimental results have obtained by using textural features of panchromatic images in
113
forest composition and structural analysis[21-23]. In this study, the widely used GLCM method (Gray
114
level co-occurrence matrix) was used to extract the eight most commonly used textural features of
115
SPOT-5 panchromatic image[24], as shown in Table 2, the eight features are Mean, Variance,
116
Homogeneity, Contrast, Dissimilarity, Entropy, Second Moment and Correlation. Textural features
117
were extracted from six different size of window namely, 3 × 3, 5 × 5, 7 × 7, 9 × 9, 11 × 11 and 13 × 13,
118
respectively. The effects of different window sizes on the estimation of forest stand parameters were
119
analyzed.
120
2.3.2. Spectral features of images
121
The vegetation index extracted from the remote sensing image by using spectral information can
122
better reflect the vegetation type, growth and spatial distribution of green plants, and is widely used
123
in the estimation of forest structure parameters[25]. Based on previous studies, the spectral band value
124
and the multi-band combination value were extracted for the estimation of the forest stand
125
parameters in this study: 1) The spectral band values are specified as B1, B2, B3 and B4, for near
126
infrared (NIR), red (RED), green (GREEN) and shortwave infrared (SWIR) band respectively; 2) The
127
combination values of different spectral bands refer to normalized difference vegetation Index
128
(NDVI)[26], simple ratio vegetation index (SR)[27], red/green ratio index (GR)[28], green/red ratio index
129
(VI)[29], soil adjusted vegetation index (SAVI)[30], Global Environmental Monitoring Index (GEMI)[31],
130
calculated as Table 1.
131
Table 1. descriptions and formulas of spectral factors of images
132
Factors Description Formula
NDVI Sensitive to green vegetation, can be used for detection of vegetation growth
status, vegetation coverage and elimination of partial radiation errors. NDVI=(NIR-RED)/(NIR+RED)
SR Very sensitive to vegetation coverage, can be used for detection of plant
biomass. SR=NIR/RED
GR Can estimate growing process of vegetation canopy, can be used for plant
growth cycle research and crop yield estimation. GR=NIR/GREEN
VI Reflect spectral information of vegetation and soil, can be used for
SAVI Can explain the change of optical characteristics and adjust the sensitivity of
vegetation index to soil background. SAVI=(NIR-RED)/(NIR+RED+L)
GEMI Can eliminate bad atmospheric disturbance, keep concerned vegetation cover information.
GEMI=[η(1-0.25η)-(RED-0.125)]/(1-RED),
η=[2((NIR)2-(RED)2)+1.5NIR+0.5RED]/(NIR+RED+0.5)
133
2.3.3. Topographic information
134
In this study, the topographic information such as elevation, slope, slope aspect and slope
135
position of sample plots was extracted based on the digital elevation model (DEM) of the study area
136
(data source: Academy of Forest Inventory and Planning, State Forestry Administration) .
137
2.4. Model establishment and verification
138
Studies show some disadvantages of general multiple linear regression method lead the poor
139
model stability[32,33]. Those disadvantages include multicollinearity occurs among the independent
140
variables, and the change of samples easily leads to the deviation of estimation result from the
141
measured value. Multivariate stepwise regression analysis can be used to solve above problems to a
142
certain extent and is widely used in the inversion experiment of forest stand parameter model[34,35]. In
143
this study, multivariate stepwise regression analysis was used to build regression model by using
144
textural, spectral features and topographic information extracted from SPOT-5 images as
145
independent variables, and forest stand parameters (number of trees (NT), basal area (BA), tree
146
canopy cover (TCC), stand volume (SV)) as the dependent variables; results of three forest stand
147
parameters prediction models were compared which are respectively based on textural features,
148
based on both textural and spectral features, combined use of textural and spectral features and
149
topographic information. To avoid multicollinearity in independent variables, tolerance and variance
150
inflation factor (VIF) were used as the criteria for model screening, of which the tolerance should be
151
greater than 0.1 and VIF should be less than 10[36]. R2adj and root mean square error (RMSE) were used
152
to evaluate the models. In addition, the model was verified by sample plots of estimated value and
153
the actual value. Two statistics including R2 and RMSE were used for verification.
154
3. Results
155
3.1. Regression model using textural features
156
We firstly used the multivariate stepwise regression analysis method to establish the prediction
157
model, using textural features extracted from six windows. Change of R2adj (Figure. 2) using textural
158
features extracted from different windows shows a parabolic trend along with growth size of the
159
window, and most models’ R2adj reached to the maximum in the 9 × 9 window. Therefore, the textural
160
feature based on 9 × 9 window was selected for model prediction test. In addition, prediction results
161
of forest stand parameters model by using textural features extracted from 9× 9 window show that
162
the textural features of SPOT-5 images are highly correlated with the forest stand parameters, and
163
the maximum predicted R2adj is in basal area (BA) model (R2adj = 0.449), followed by the stand volume
164
(SV) model (R2adj = 0.423). Those two models contain same textural variables, namely Mean and
165
Correlation.
167
Figure 2. R2adj of forest stand parameters models based on textural feature, as a function of window
168
size
169
Table 2. Regression model predicting forest stand parameters using textural features based on 9 × 9
170
window
171
Forest stand parameters Prediction model R2adj RMSE p
Number of trees (NT) NT=2456.552-1014.120*Entropy 0.313 474.315 0.001
Basal area (BA) (m2/ha) BA=27.156+0.616*Correlation-4.095*Mean 0.449 5.954 0.000
Tree canopy cover (TCC) TCC=82.799-61.342*Contrast 0.232 13.221 0.001
Stand volume (SV) (m3/ha) SV=232.215-37.448*Mean+3.366*Correlation 0.423 43.765 0.000
3.2. Regression model using both textural and spectral features
172
As for models predicting forest stand variables using both textural and spectral features, the
173
results (Table 3) show that the spectral feature of SPOT-5 images were highly correlated with the
174
forest stand variables. After introducing the spectral features, accuracy of most prediction models
175
was improved except the number of trees. The R2adj of model predicting basal area was the greatest
176
(R2adj = 0.732), followed by models to predicting stand volume (SV) and tree canopy cover (TCC).
177
Among all the spectral variables introduced, NDVI was involved in most models, including basal
178
area and stand volume prediction models.
179
Table 3. Regression model predicting forest stand parameters using both textural and spectral
180
features
181
Forest stand parameters Prediction model R2adj RMSE p
Number of trees (NT) NT=2456.552-1014.120*Entropy 0.313 474.315 0.001
Basal area (BA) (m2/ha) BA=7.095+39.785*NDVI+0.420*Correlation-17.139*Contrast 0.732 4.153 0.000
Stand volume (SV) (m3/ha) SV=94.048+229.861*NDVI+3.068*Correlation-18.983*Mean 0.658 33.694 0.000
3.3. Regression model using textural, spectral and topographic information
182
The results of model predicting forest stand variables using textural, spectral features and
183
topographic information are shown in Table 4. From Table 2 to 4, it can be concluded that all
184
significance P values of models using above three methods are less than 0.001. Compared with model
185
using textural feature and model using both textural and spectral features, the model predicting
186
forest stand parameters using combined textural, spectral features and topographic information was
187
significantly improved in terms of goodness of fit, in which the stand volume (SV) model showed the
188
greatest R2adj, followed by basal area (BA) and tree canopy cover (TCC) model. The R2adj of stand
189
volume (SV) model increased from 0.658 to 0.82, the correlation between the topographic factors
190
(elevation and slope aspect) and stand volume was relatively good, the goodness of fit was
191
significantly improved (R2adj = 0.820, RMSE = 24.457m3/ha). The R2adj of basal area (BA) model
192
increased from 0.732 to 0.778, of which the prediction accuracy was only behind the SV model.
193
Among all introduced topographic variables, the elevation was most involved in the model,
194
including predicting the following three forest stand parameters, number of trees (NT), tree canopy
195
cover (TCC) and stand volume (SV).
196
Table 4. Regression model predicting the forest stand parameters using textural, spectral features
197
and topographic information
198
Forest stand parameters Prediction model R2adj RMSE p
Number of trees (NT) NT=2566.169-910.848*Entropy-1.733*elevation+22.888*slope 0.448 425.213 0.001
Basal area (BA) (m2/ha) BA=10.741+40.972*NDVI+0.424*Correlation-19.572*Contrast-0.717*slope aspect 0.778 5.954 0.000
Tree canopy cover (TCC) TCC=287.069--28.677*Contrast-63.903*MSI-91.877*VI-0.040*elevation-6.843*Mean 0.522 10.434 0.000
Stand volume (SV) (m3/ha)
SV=169.030+206.397*NDVI+0.231*elevation-63.522*Entropy-6.108*slope aspect
-13.376*Mean
0.820 24.457 0.000
199
Figure 3. R2adj of forest stand parameters models based on textural, spectral features and topographic
200
information combination (textural features, textural&spectral features, textural&spectral features&
201
3.4. Model accuracy verification
203
In this paper, we obtained the optimal estimation model by comparing R2adj of all prediction
204
models shown in Figure 3, which was, model predicting forest stand parameter by combined use of
205
textural and spectral features and topographic information, and its accuracy was verified. Figure 4
206
shows plots of estimated values and actual values generated from 15 testing samples. The study
207
results show that plots R2 between estimated value and actual value of the optimal model was close
208
to 1, and the constructed model to predict forest stand parameters was better for prediction of the
209
actual values. The RMSE estimated by model predicting stand volume (SV) reached the greatest to
210
13.65m3/ha, and the RMSE of model predicting Tree canopy cover (TCC) was the lowest to 0.05.
211
According to the results of the optimal estimation model (combined use of textural and spectral
212
features as well as topographic information), the R2adj of models predicting stand volume (SV) and
213
basal area (BA) both were greater than 0.75, and the prediction effect was ideal. In this study, maps
214
of the stand volume and basal area for a county in the study area were generated based on optimal
215
estimation model, shown as Figure 5.
216
Figure 4. Field-measured forest stand parameters and satellite-derived forest stand parameters
217
Figure 5. Thematic map of basal area (BA) and stand volume (SV) of a county in Heilongjiang
219
province
220
4. Discussion
221
Results predicting forest stand parameters by using textural features of different image windows
222
show that, the ability of textural feature of remote sensing image to estimate the forest stand
223
parameters increased first and then decreased with the growth of window size, showing a slight
224
parabolic trend. Similar to the results of this study, Liu et al.[37] using textural features of different
225
windows of ALOS images to estimate stand volume also found the same trend. In addition, the
226
textural features of SPOT-5 image show the maximum value of R2adj in the 9 × 9 window, indicating
227
that the 9 × 9 window is the ideal window for using textural features extracted from SPOT-5 image
228
to predict forest stand parameters, which is consistent with study results by Castillo-santiago et al.[38] .
229
However, the optimal window size to predict forest stand parameters by using textural feature of
230
remote sensing image may vary due to different data sources, and it needs to be further studied.
231
According to the results predicting forest stand parameters by using textural and spectral
232
features and combined use of textural and spectral features and topographic information (Table 3 ~
233
4), textural features of SPOT-5 image were involved in all prediction models, but spectral features of
234
SPOT-5 image were only involved in predicting basal area, tree canopy cover and stand volume and
235
stand volume, indicating that the ability of textural features of SPOT-5 image is stronger than spectral
236
features in terms of predicting forest stand parameters. Similar to the results of this study, Eckert[1]
237
found that the correlation between the textural features of the worldview-2 image and the biomass
238
and carbon content is higher than that of the spectral features, and with inclusion of textural features,
239
the accuracy predicting biomass and carbon content using spectral characteristics can be improved.
240
Levesque and King[39], and Kayitakire et al.[40] used textural features to study the tree health and age,
241
respectively, and the results show that the information achieved after introducing the textural
242
features is more accurate than the approach simply uses spectral features. Compared with previous
243
studies, the reason might be: the influence of canopy shadow, the heterogeneity of the vegetation site
244
structure and the saturation of the spectral data, which will reduce accuracy of model predicting
245
forest stand parameters by using spectral features, while the textural features of remote sensing
246
image enlarges the spatial information recognition based on the brightness of the original image,
247
which is more helpful for prediction model[41,42].
When textural and spectral features were used in prediction model, the inclusion of topographic
249
information will greatly improve the prediction accuracy. Same as the textural features of remote
250
sensing image, the topographic information was involved in all optimal models predicting forest
251
stand parameters, indicating that the topographic information has a positive effect on the prediction
252
of number of trees, basal area, tree canopy cover and stand volume. Similar results were reported by
253
Kimes et al.[43]. They found that the introduction of topographic information is also effective in
254
estimating the age of forests using remote sensing images. In addition, among all the factors involved
255
in estimation of forest stand parameters, the elevation had the greatest influence on estimation of
256
forest stand parameters, and it was involved in predicting three models, which indicated that
257
elevation contains abundant forest structure information, and has significant impact in predicting
258
forest stand variables. The reason might be: the forest structure is complex in the study area, and the
259
elevation is between 52-1022m. The wavy terrain causes significant difference between adjacent
260
pixels in terms of solar radiation, atmospheric scattering in the sky and significant difference in cross
261
radiation between adjacent terrain, resulting in phenomena of "same object with different spectra"
262
and "different objects with same spectra", which might affect the accuracy to extract image
263
information[44,45]. Therefore, accuracy of model predicting forest stand parameters using textural and
264
spectral features of SPOT-5 remote sensing image was not great, while the accuracy was improved
265
after inclusion of topographic information.
266
5. Conclusions
267
In this paper, we studied the potential of textural, spectral features of SPOT-5 remote sensing
268
images and topographic information to estimate the number of trees, basal area, tree canopy cover
269
and stand volume, and the following conclusions can be drew:
270
1
)
The optimal window using textural features of SPOT-5 images to predict forest stand271
parameters is 9 × 9, and the R2adj showed a weak parabolic trend with growth of window size.
272
2
)
Models using both textural and spectral features of SPOT-5 images could accurately predict273
the forest stand parameters, of which prediction accuracy of basal area (R2adj = 0.732) and stand
274
volume (R2adj = 0.658) was relatively good. In addition, ability of textural features of SPOT-5 images
275
was better than that of spectral features in terms of predicting forest stand parameters.
276
3) Models combined use of textural and spectral features as well as topographic information is
277
the optimal model to predict forest stand parameters, which the accuracy was higher than the model
278
only using textural and spectral features. The introduction of topographic information has a positive
279
effect on all models, and the elevation has the greatest impact on estimation model for forest stand
280
parameters.
281
4
)
Among all optimal estimation models for forest stand parameters in this study, the accuracy282
of predicting stand volume (SV) ( R2adj=0.820
,
RMSE=24.457m3/ha) was the highest, followed by basal283
area (BA) (R2adj = 0.778
,
RMSE=5.954m2/ha), both exceeded 75%. The R2adj of prediction models for284
number of trees (NT) and tree canopy cover (TCC) was close to or greater than 0.50, and the prediction
285
results were reliable.
286
Acknowledgments: This study was supported by the National Major Projects on High-Resolution Earth
287
Observation System of China (21-Y30B05-9001-13/15-4).We thank the Survey & Planning Institute of State
288
Forestry Administration, China for their data support during our research..
289
Author Contributions: All authors have made significant contributions to the manuscript. Shiqin Xie and Wei
290
Wang conceived, designed and performed the experiments; Wei Wang processed the remote sensing data and
291
derived the remote sensing parameters responding to the field plots. Shiqin Xie analyzed the data and results;
292
Shiqin Xie and Wei Wang are the main authors who developed and revised the manuscript. All authors
293
contributed with ideas, writing, and discussions.
294
References
296
1. Eckert, S. Improved forest biomass and carbon estimations using texture measures from worldview-2
297
satellite data. Remote sensing 2012, 4, 810-829. DOI: https://doi.org/10.3390/rs4040810.
298
2. Meng, J.; Lu, Y.; Zeng, J. Transformation of a degraded pinus massoniana plantation into a mixed-species
299
irregular forest: Impacts on stand structure and growth in southern china. Forests 2014, 5, 3199-3221. DOI:
300
https://doi.org/10.3390/f5123199.
301
3. Chauvat, M.; Titsch, D.; Zaytsev, A.S.; Wolters, V. Changes in soil faunal assemblages during conversion
302
from pure to mixed forest stands. Forest Ecology and Management 2011, 262, 317-324. DOI:
303
https://doi.org/10.1016/j.foreco.2011.03.037.
304
4. Liu, F.; Tan, C.;Zhang, G.; Liu, J. Estimation of Forest Parameter and Biomass for Individual Pine Trees
305
Using Airborne LiDAR. Transactions of the Chinese Society for Agricultural Machinery 2013, 9, 219-242.
306
DOI: 10.6041/j.issn.1000-1298.2013.09.039.
307
5. Ketterings, Q.M.; Coe, R.; Noordwijk, M.V.; Ambagau’, Y.; Palm, C.A. Reducing uncertainty in the use of
308
allometric biomass equations for predicting above-ground tree biomass in mixed secondary forests. Forest
309
Ecology & Management 2001, 146,199-209. DOI: https://doi.org/10.1016/s0378-1127(00)00460-6.
310
6. Ozdemir, I.; Karnieli, A. Predicting forest structural parameters using the image texture derived from
311
WorldView-2 multispectral imagery in a dryland forest, Israel. International Journal of Applied Earth
312
Observations & Geoinformation 2011 , 13, 701-710. DOI: https://doi.org/10.1016/j.jag.2011.05.006.
313
7. Mora, B.; Wulder, M.A.; White, J.C.; Hobart, G. Modeling stand height, volume, and biomass from very
314
high spatial resolution satellite imagery and samples of airborne lidar. Remote Sensing 2013, 5,2308-2326.
315
DOI: https://doi.org/10.3390/rs5052308.
316
8. Couteron, P.; Pelissier, R.; Nicolini, E.; Dominique, P. Predicting tropical forest stand structure parameters
317
from fourier transform of very high-resolution remotely sensed canopy images. Journal of applied ecology
318
2005, 42, 121-1128. DOI: https://doi.org/10.1111/j.1365-2664.2005.01097.x.
319
9. Wallner, A.; Elatawneh, A.; Schneider, T.; Knoke, T. Estimation of forest structural information using
320
rapideye satellite data. Forestry 2014, 88, 561-571. DOI: https://doi.org/10.1093/forestry/cpu032.
321
10. Latifur, R.S.; Janet, E.N. Improved forest biomass estimates using ALOS AVNIR-2 texture indices. Remote
322
Sensing of Environment 2011, 115, 968-977. DOI: https://doi.org/10.1016/j.rse.2010.11.010.
323
11. Mather, P.M. Computer processing of remotely sensed images(2nded); John Wiley and Sons: Chichester,
324
UK, 1999; 100-120. ISBN: 0-471-98550-3.
325
12. Wang, X.; Pang, Y.; Zhang, Z.; Yuan, Y. Forest aboveground biomass estimation using SPOT-5 texture
326
indices and spectral derivatives. Geoscience & Remote Sensing Symposium 2014, 2830-2833. DOI:
327
https://doi.org/10.1109/igarss.2014.6947065.
328
13. Wolter, P.T.; Townsend, P.A.; Sturtevant, B.R. Estimation of forest structural parameters using 5 and 10
329
meter SPOT-5 satellite data. Remote Sensing of Environment 2009, 113 , 2019-2036. DOI:
330
https://doi.org/10.1016/j.rse.2009.05.009.
331
14. Ghahramany, L.; Fatehi, P.; Ghazanfari, H. Estimation of Basal Area in West Oak Forests of Iran Using
332
Remote Sensing Imagery[J]. International Journal of Geosciences 2012, 3, 398-403. DOI:
333
https://doi.org/10.4236/ijg.2012.32044.
334
15. Chen, E.; Li, Z., L.; Wu, H.; Han, A. Forest Volume Estimation Method for Small Areas Based on k-NN and
335
Landsat Data. Forest Research 2008, 21, 745-750. DOI: 10.3321/j.issn:1001-1498.2008.06.002.
336
16. Xianwen, Z.; Chonggui, L. Quantitative Estimation of Forest Resources Based on 3S Technology[M].
337
17. Wang, J.; Song, S.; Liu, X.; Yang, H.; Feng, Z. Forest volume estimation model using spectra and
339
topographic factors of ZY-3 image. Transactions of the Chinese Society for Agricultural Machinery 2010,
340
34, 539-549. DOI: 10.6041/j.issn.1000-1298.2014.05.033.
341
18. Hilbert, C.; Schmullius, C. Influence of Surface Topography on ICESat/GLAS Forest Height Estimation and
342
Waveform Shape. Remote Sensing 2012, 4, 2210-2235. DOI: https://doi.org/10.3390/rs4082210.
343
19. Yang, W.; Dengrong, Z.; Hankui, Z.; Honggan, W. Remote Sensing Estimation of Forest Canopy Density
344
Combined with Texture Features. Scientia Silvae Sinicae 2012, 48, 48-53. DOI: 10.11707/j.1001-7488.20120207.
345
20. Chicaolmo, M.; Abarcahernández, F.; Atkinson, P.M.; Quattrochi, D.A. Computing geostatistical image
346
texture for remotely sensed data classification. Computers & Geosciences 2000, 26, 373-383. DOI:
347
https://doi.org/10.1016/s0098-3004(99)00118-1.
348
21. Ouma, Y.O.; Ngigi, T.; Tateishi, R. On the optimization and selection of wavelet texture for feature
349
extraction from high-resolution satellite imagery with application towards urban-tree delineation.
350
International Journal of Remote Sensing 2006, 27, 73-104. DOI: https://doi.org/10.1080/01431160500295885.
351
22. Song, C.; Dickinson, M.B.; Su, L.; Zhang, S.; Yaussey, D. Estimating average tree crown size using spatial
352
information from ikonos and quickbird images: Across-sensor and across-site comparisons. Remote
353
sensing of environment 2010, 114, 1099-1107. DOI: https://doi.org/10.1016/j.rse.2009.12.022.
354
23. Gebreslasie, M.T.; Ahmed, F.B.; Van Aardt, J.A.N. Extracting structural attributes from ikonos imagery for
355
eucalyptus plantation forests in kwazulu-natal, south africa, using image texture analysis and artificial
356
neural networks. International journal of remote sensing 2011, 32, 7677-7701. DOI:
357
https://doi.org/10.1080/01431161.2010.527392.
358
24. Germany, T. Ecognition developer 7 reference book. Trimble Germany, Munich, Germany 2011, 262-272.
359
25. Franklin, S.E.; Hall, R.J.; Moskal, L.M.; Maudie, A.J.; Lavigne, M.B. Incorporating texture into classification
360
of forest species composition from airborne multispectral images. International Journal of Remote Sensing
361
2000, 21, 61-79. DOI: https://doi.org/10.1080/014311600210993.
362
26. Rouse, J.W., Jr.; Haas, R.; Schell, J.; Deering, D. Monitoring vegetation systems in the great plains with
363
ERTS. Third Earth Resources Technology Satellite-1 Symposium-Volume I: Technical Presentations; NASA
364
SP-351; NASA: Washington, DC, USA, 1974; p. 309. Google Scholar:
365
https://ntrs.nasa.gov/search.jsp?R=19740022614.
366
27. Jordan C.F. Derivation of leaf-area index from quality of light on the forest floor. Ecology 1969, 50, 663-666.
367
DOI: https://doi.org/10.2307/1936256.
368
28. Lyon, J.G.; Yuan, D.; Lunetta, R.S.; Elvidge, C.D. A change detection experiment using vegetation indices.
369
Photogrammetric Engineering and Remote Sensing 1998, 64, 143-150. DOI: 10.1144/petgeo.4.1.95.
370
29. Kanemasu, E.T. Seasonal canopy reflectance patterns of wheat, sorghum, and soybean. Remote Sensing of
371
Environment 1974, 3, 43-47. DOI: https://doi.org/10.1016/0034-4257(74)90037-6.
372
30. Huete, A.R. A soil-adjusted vegetation index (savi).Remote sensing of environment 1988, 25, 295-309. DOI:
373
https://doi.org/10.1016/0034-4257(88)90106-x.
374
31. Verstraete, M.M.; Pinty, B. Designing optimal spectral indexes for remote sensing applications. Geoscience
375
and Remote Sensing, IEEE Transactions on 1996, 34, 1254-1265. DOI: https://doi.org/10.1109/36.536541.
376
32. Jensen, J.R.; Qiu, F.; Ji, M. Predictive modelling of coniferous forest age using statistical and artificial neural
377
network approaches applied to remote sensor data. International Journal of Remote Sensing 1999, 20,
2805-378
2822. DOI: https://doi.org/10.1080/014311699211804.
379
33. Dye, M.; Mutanga, O.; Ismail, R. Combining spectral and textural remote sensing variables using random
380
forests: Predicting the age of pinus patula forests in kwazulu-natal, south africa. Journal of Spatial Science
381
34. Cao, L.; Coops, N.C.; Innes, J.; Dai, J.; She, G. Mapping Above- and Below-Ground Biomass Components
383
in Subtropical Forests Using Small-Footprint LiDAR. Forests 2014 , 5, 1356-1373. DOI:
384
https://doi.org/10.3390/f5061356.
385
35. Ullah, S.; Si, Y.; Schlerf, M.; Skidmore, A.K.; Shafique, M.; Iqbal, I.A. Estimation of grassland biomass and
386
nitrogen using MERIS data. International Journal of Applied Earth Observations & Geoinformation 2012,
387
19, 196-204. DOI: https://doi.org/10.1016/j.jag.2012.05.008.
388
36. Douglas, C.M.; Peck, E.A.; Vining, G.G. Introduction to linear regression analysis (Fourth edition);
Wiley-389
Interscience: Willey, New York, 2006; 323−368. ISBN: 9780471754954.
390
37. Liu, J.; Bi, H.; Zhu, P.; Sun, J.; Zhu, J.; Chen, T. Estimating Stand Volume of Xylosmaracemosum Forest
391
Based on Texture Parameters and Derivative Texture Indices of ALOS Imagery[J].Transactions of the
392
Chinese Society for Agricultural Machinery 2014, 7(45): 245-254. DOI: 10.6041/j.issn.1000-1298.2014.07.038.
393
38. Castillo-Santiago, M.A; Ricker, M.; De Jong B.H. Estimation of tropical forest structure from spot-5 satellite
394
images. International Journal of Remote Sensing 2010, 31, 2767-2782. DOI:
395
https://doi.org/10.1080/01431160903095460.
396
39. Lévesque, J.; King, D.J. Spatial analysis of radiometric fractions from high-resolution multispectral imagery
397
for modelling individual tree crown and forest canopy structure and health. Remote Sensing of
398
Environment 2003 , 84, 589-602. DOI: https://doi.org/10.1016/s0034-4257(02)00182-7.
399
40. Kayitakire, F.; Hamel, C.; Defourny, P. Retrieving forest structure variables based on image texture analysis
400
and IKONOS-2 imagery. Remote Sensing of Environment 2006 , 102, 390-401. DOI:
401
https://doi.org/10.1016/j.rse.2006.02.022.
402
41. Kuplich, T. M.; Curran, P. J.; Atkinson, P. M. Relating SAR image texture to the biomass of regenerating
403
tropical forests. International Journal of Remote Sensing 2005 , 26, 4829-4854. DOI:
404
https://doi.org/10.1080/01431160500239107.
405
42. Luckman, A.J.; Frery, A.C.; Yanasse, C.C.F.; Groom, G. B. Texture in airborne SAR imagery of tropical forest
406
and its relationship to forest regeneration stage. International Journal of Remote Sensing 1997, 18,
333-407
1349.DOI: https://doi.org/10.1080/014311697218458.
408
43. Kimes, D.S.; Holben, N.; Nickeson, J.E.; Mckee, W.A. Extracting forest age in a Pacific Northwest forest
409
from thematic mapper and topographic data. Remote Sensing of Environment 1996, 56, 133-140. DOI:
410
https://doi.org/10.1016/0034-4257(95)00230-8.
411
44. Dejin, D.; Guomo, Z.; Huaqiang, D.; Xiaojun, X.; Ruirui, C.; Zhenming, S. Effects of Topographic Correction
412
with 6 Correction Models on Phyllostachys praecox Forest Aboveground Biomass Estimation. Scientia
413
Silvae Sinicae 2011, 47, 1-8. DOI: 10.11707/j.1001-7488.20111201.
414
45. Lu, D.S. The potential and challenge of remote sensing based biomass estimation. International Journal of