c
Owned by the authors, published by EDP Sciences, 2015
Galactic very high energy sources and enhancements of material content
Giovanna Pedaletti1,2,a, Emma de O˜na Wilhelmi1, Diego F. Torres1,3, and Giovanni Natale4,5
1 Institut de Ci`encies de l’Espai (IEEC-CSIC), Campus UAB, Torre C5, 2a planta, 08193 Barcelona, Spain 2 Deutsches Elektronen-Synchrotron (DESY), 15738 Zeuthen, Germany
3 Instituci´o Catalana de Recerca i Estudis Avanc¸ats (ICREA)
4 Max-Planck-Institut f¨ur Kernphysik, PO Box 103980, 69029 Heidelberg, Germany 5 Jeremiah Horrocks Institute, University of Central Lancashire, Preston PR1 2HE, UK
Abstract. The association of very-high energy (VHE; E>100 GeV) sources with regions of the sky rich in dust and gas has been noticed in the study of individual VHE sources. However, the statistical significance of this correlation for the whole population of TeV detections has not been assessed yet. To trace the material content, we make use of the publicly released all-sky maps of astrophysical foregrounds of the Planck Collaboration, and of an extensive existing CO mapping of the Galactic sky. To test the correlation, we construct randomized samples of VHE source positions starting from the inner Galactic plane survey. A positive correlation cannot be firmly established yet. Additionally we explore the possibility that unidentified VHE sources are located in environment particularly rich in material content unaccounted by traditional tracers, including HI hyperfine transition at 21 cm to trace atomic hydrogen in regions where the gas is diffuse. No additional gas component is found in the direction of unidentified VHE sources.
1. Introduction
Most of the very-high energy (VHE; E100 GeV) galactic sources were discovered in the last decade through a scan of the Galactic plane region by the High Energy Stereoscopic System (H.E.S.S.). In many cases, multiwavelength studies of the position of VHE emission allowed the classification of the source within a given class of known VHE emitters. Still, many sources are unidentified. It would seem that the Galactic VHE sources are in regions of the sky where the surrounding is rich in molecular material, but no correlation is established up to date.
Such a relation would be expected in a scenario where the VHE emission has an hadronic origin: the accelerated cosmic rays (CRs, protons or heavier nuclei) interact with the surrounding material, leading to VHE emission through the decay of the producedπ0(Ginzburg & Syrovatskii 1964). Such emission can be boosted by the presence of an enhancement of target material above the ISM contribution (see e.g., Aharonian et al. 2008).
Mass enhancements (or simply enhancements of the dust content) can also be associated with regions of high stellar activity, which are in turn associated with known or predicted VHE emitters, such as Pulsar Wind Nebulae (PWN), Supernova remnants (SNR), binaries or regions of massive-star formation. In the case of PWN, the VHE emission needs to take into account also the inverse Compton scattering (ICS) of the accelerated electrons off the thermal radiation associated to the dust (e.g., Martin et al. 2012). VHE emission has also been predicted to be
aCorresponding author:[email protected]
produced in regions of massive-star formation, where apart from being obvious sites prone to the appearance of SNRs and other accelerators, the strong winds of the hot OB stars in the clusters form acceleration regions at wind interaction zones. These regions are rich in molecular material and dust and are hence expected to be bright regions for the tracers that we consider here.
In the following we explore if the correlation can be quantitatively confirmed. Moreover we investigate whether the still unidentified VHE sources can be associated with regions with a peculiar environment.
The work presented here is part of works published previously in Pedaletti et al. (2014) and Pedaletti et al. (2015).
2. The data set and mass estimation
The gas surface density at a given projected position in the sky can be expressed as
=µmHNH, (1)
where NH is the column density, µ=1.4 is the mean
weight per H atom, mHis the mass of the H nucleon.
An extensive archive of CO line (1→0) at 115 GHz (2.6 mm) intensity WCOis provided in Dame et al. (1987)
and Dame et al. (2001). The data are released1in cubes of
radial velocity (in Local Standard of Rest), galactic latitude and longitude. The radial velocity allows the estimation of
1http://www.cfa.harvard.edu/rtdc/CO/
the distance. From WCOone can estimate the amount of
molecular material as follows: NH2=XCO
px
WCO. (2)
The dust content can be used as tracer of the total mass (hydrogen in any form) once NH, column density of the
hydrogen, is calculated from the thermal emission of dust (see, e.g. Roy et al. 2013) as follows:
NH=σν−01
px τν
ν
ν0
−β
(3)
whereσν0 is the dust emissivity at the reference frequency
ν0, which contains the knowledge on the emissivity of the
dust grains and their composition, τν is the dust optical depth at frequencyν, andβis the dust spectral index.
The Planck legacy archive2 provides dust parameters as all-sky maps of τ, β index and T at 353 GHz (with degeneracy between the last 2 parameters). They were obtained by fitting the Planck data at 353, 545 and 857 GHz together with the IRAS (IRIS) 100 micron data (see Ade et al. 2014). One can use all-sky maps for τ andβ to calculate the mass. The Planck satellite legacy archive also provides WCOin galactic coordinates. This is
equivalent to the velocity-integrated Dame map in the full velocity range with the addition of a<10% contribution from13CO (at 110 GHz, hence in the same HFI channel of
the Planck satellite). The maps used in this work are from the first release of 2013.
3. The inner GPS sources and surface
density enhancements
We select the sources in the H.E.S.S. Galactic plane survey (GPS, as presented in Carrigan et al. 2013)3with|l|<30◦ and|b|<2◦. The resulting 39 sources (henceforth referred to as GPS sources) are then binned in space according to their Galactic coordinates (with bins of δl=10◦ and
δb=1◦). This is certainly a flux-biased sample, limited by the exposure weighted sensitivity of the H.E.S.S. array in a certain part of the scan. However the inner Galactic region is the most uniformly covered, providing an almost flat detection threshold for fluxes above 2% CU (Crab Units)4. We proceed to build 105 fake distributions of TeV sources, by randomizing the locations of each detection yet conserving their number within each spatial bin. The results are proven to be stable with the number of randomization if these are>104. The surface density for the random positions is calculated as described above, depending on the mass tracer. We sum the emission in a square of 3×3 pixels, with the central pixel corresponding to the best fit position of the VHE source. As for both maps 1px=0.125◦, the area considered is similar to the trial extension used in the HESS GPS scan for
2http://pla.esac.esa.int/pla/aio/planckProducts.
html
3The online database athttp://tevcat.uchicago.edu/was
used for the actual positions. The only exception being HESS J1833-105, that it is not yet present in the webpage.
41CU∼2.8×10⁻¹¹(E/TeV)−2.57cm−2s−1TeV−1.
) -2 pc (M Σ log
1.5 2 2.5 3 3.5 4
Number of positions
-1
10 1 10
2
10
3
10
4
10
5
10
Positions in the inner Galactic region
°
and |b|<2
°
Positions in GPS with |l|<30
) -2 pc (M Σ log
1.5 2 2.5 3 3.5 4
Number of positions
-1
10 1 10
2
10
3
10
4
10
5
10
Positions in the inner Galactic region
°
and |b|<2
°
Positions in GPS with |l|<30
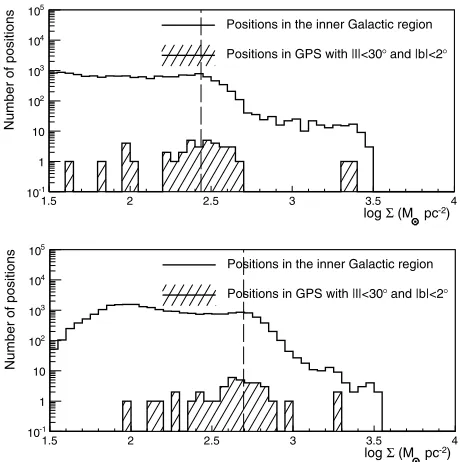
Figure 1. Distribution in surface density of the positions in
the inner galaxy (empty filled histogram) and in the GPS (dashed filled histogram). Top, CO: there are 19 sources above the threshold of thr,CO=274 Mpc−2 (dashed vertical line).
Bottom, Dust: there are 16 sources above the threshold of thr,dust=496 Mpc−2(dashed vertical line).
sources discovery (radius=0.22◦, see Aharonian et al.
2006). The error on the source localization is typically smaller than the pixel size considered here. Each estimate of the mass has some unknowns, most noticeably the conversion factors from tracer to mass: the term XCOfor
Eq. (2) and the coefficient σν0 in Eq. (3). It has to be noted that their value is not important at the moment as we are more interested in relative mass gradients to define enhancements. Nevertheless, we will now use XCO=1.8×1020cm−2(K km/s)−1(Dame et al.2001) and σ(353GHz)=2.2×10⁻²⁶cm2H−1.
In order to quantify the correlation, we calculate the probability of having a certain number of positions of the GPS sources associated with a surface density estimate above a chosen threshold, thus defining the enhancement. The chosen threshold is defined a priori as the surface density for which only 10% of the positions in the considered inner galaxy have a larger surface density. To be able to compare this threshold directly to the surface density calculated as shown above, we follow the same procedure for each position in the inner Galaxy. With the surface density threshold defined, we then construct the distribution function of the randomized samples and its cumulative distribution function, from which we can extract the significance of the correlation.
We construct the surface density distribution over the entire inner galaxy region estimating the values from the Dame-deep WCO map integrated along the line of sight.
The surface density threshold is thus defined asthr,CO=
thr,CO Σ
>
Σ
Number of position with
0 5 10 15 20 25
Relative frequency
0 0.05 0.1 0.15 0.2 0.25
Cumulative frequenc
y
0 0.1 0.2 0.3 0.4 0.5 0.6 0.7 0.8 0.9 1
thr, dust Σ
>
Σ
Number of position with
0 5 10 15 20 25
Relative frequency
0 0.05 0.1 0.15 0.2 0.25
Cumulative frequency
0 0.1 0.2 0.3 0.4 0.5 0.6 0.7 0.8 0.9 1
thr Σ
Number of position above both
0 5 10 15 20 25
Relative frequency
0 0.05 0.1 0.15 0.2 0.25
Cumulative frequency
0 0.1 0.2 0.3 0.4 0.5 0.6 0.7 0.8 0.9 1
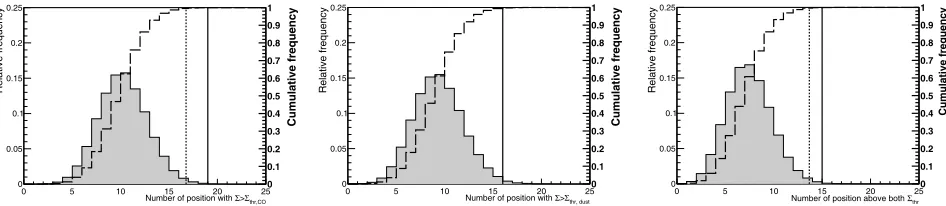
Figure 2. Occurrences in randomized sample of positions relative to an integrated surface density > thr,x. The dashed vertical line is for 3σ.Left, CO: there are 19 sources in the GPS above threshold, that corresponds to 3.9σ (solid vertical line). Middle, Dust: there are 16 in the GPS above threshold, that corresponds to 3.1σ(solid vertical line). Right: occurrences in randomized sample where surface density estimates from both tracers are above the respective threshold. There are 15 in the GPS that satisfy simultaneously the two thresholds, and this corresponds to 3.5σ.
When applying the same threshold to the 105 randomized set of 39 positions, we obtain the distribution given in Fig. 2 (left). Therefore we can conclude that the significance of correlation between the selected VHE sources and the surface density enhancement that we define is of 3.9σ (99.989%). The significance of the correlation is calculated from the probability extracted from the constructed cumulative distribution, assuming a normal underlying distribution.
The emission of the 2.6 mm CO line might not be tracing all the gas, especially when diffuse. Therefore we repeat the same exercise starting from the dust opacity map in the Planck data repository.
Considering the surface density distribution in the inner galaxy obtained from the dust emission, a threshold ofthr,dust=496 Mpc−2 is chosen (see Fig.1, bottom).
After 105 realizations of samples of 39 positions, the
distribution obtained is the one shown in Fig.2(middle). Therefore the GPS sample, with 16 sources showing
> thr,dust (see Fig. 1, bottom), presents a significant
correlation at 3.1σ significance (99.77%).
We additionally compute the probability that the positions of the VHE sources sitting on an enhancement are the same for both tracers. Out of the 19 positions with
> thr,co and 16 with > thr,dust, 15 are common to
both samples. That is to say, 15 of the GPS sources are associated with a surface density above threshold both in the case of CO and dust. These 15 sources correspond to a significance of 3.5σ (99.95%) when compared to randomized samples. We used here the same randomized sample studied above.
3.1. Stability of the result
The test described in the previous sections relies on our educated guesses on the construction of the randomized sample and on our definition of surface density enhancement. We therefore now study the stability of the correlations found.
Thethr=10 was chosen such that only 10% of the
positions in the inner Galaxy presented a larger surface density. If this percentage were to be smaller, this would restrict de facto the study to only the VHE sources in the Galactic center region; if larger, it would select common values of the surface density distribution (cf. Fig. 1).
We nonetheless have scanned the evolution of significance with percentages ([5,10,15,20,25], where the numbers in
the subscript refer to the percentage). The significance of correlation remains positive (>3σ) for thresholds of
[10−25]with a peak for[10,CO]and[20,dust].
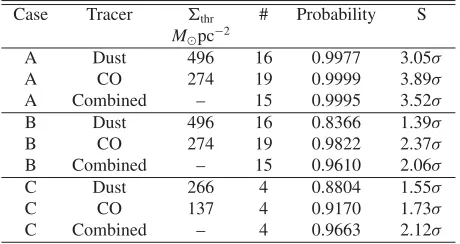
The initial binning of the sample was chosen in order to allow for a large randomization of positions in a single bin, without incurring in the risk of selecting often the same region of 0.375◦×0.375◦. However, with the initial binning of δb=1◦ (hereafter case A), the latitude distribution of the randomized samples would have a standard deviation of 0.61◦, slightly larger value than the original sample (0.47◦±0.05◦). This is not a critical widening, but might impact the final significance assessment. This is possible, but difficult to quantify given the asymmetrical distribution of the material and the small widening comparable to the size of a single integrated position. We therefore reduce the binning in latitude (from the initialδb=1◦toδb=0.5◦, hereafter case B), making the width of the original and simulated samples (0.51◦) fully compatible. We reduce the number of randomization to 104. The threshold for the definition of surface density
enhancement does not depend on this binning, hence it has the same value as in case A. The significance of correlation against 10 is reduced to 2.4σ for the CO tracer case
and 1.4σ for the dust tracer case. The significance never exceeds the level of 3σ, but follows the same behaviour described in case A (peak for[10,CO]and[20,dust]).
As we are relying on a quantity (the surface density) integrated along the line of sight, we can expect the tests performed to be less sensitive in the regions closer to the Galactic plane where VHE sources are more abundant and matter enhancements are more common. We therefore proceed to replicate the test above (case B), but neglecting the region closer to the Galactic plane (|b|<0.5◦, hereafter case C). We now are focussing on the correspondingly-located 9 VHE sources. Surface density thresholds will change with respect to case A and B and are given in Table1where we summarize the results. We do obtain a positive correlation of 3.5σ significance for
[5,dust].
Given the reduction of significance due to trials (the 5 trials of the thr scan reduce a 3.5σ already to 3σ),
Table 1. Significance (S) of correlations with different tracers
and10.
Case Tracer thr # Probability S Mpc−2
A Dust 496 16 0.9977 3.05σ
A CO 274 19 0.9999 3.89σ
A Combined – 15 0.9995 3.52σ
B Dust 496 16 0.8366 1.39σ
B CO 274 19 0.9822 2.37σ
B Combined – 15 0.9610 2.06σ
C Dust 266 4 0.8804 1.55σ
C CO 137 4 0.9170 1.73σ
C Combined – 4 0.9663 2.12σ
enhancement, but all the tests performed present hints of it. The final proof of correlation is left for the future, when the forthcoming Cherenkov Telescope Array (CTA) observations will provide us with more sources (Dubus et al. 2013).
4. Gas content on the direction of
unidentified VHE sources
We have shown that a firm correlation between positions of VHE sources and regions rich in molecular material cannot be established yet. However, the study of the gas content on the direction of specific sources might help in shedding light on the underlying acceleration and emission processes. It is to be noted that up to date there are 84 VHE sources with Galactic latitude |b|<5◦. While in most cases the identification of the object responsible for VHE emission is possible thanks to a multiwavelength investigation of the region, at least 25 detections have no firm counterpart. From here onwards we will refer the latter as unidentified VHE sources (UNID). We now proceed to study the surface density in the direction of the UNID sources. The work shown in this section and more details can be found in Pedaletti et al. (2015).
Requesting that the tracers described above in Eq. (2) and Eq. (3) trace the same total content and considering Eq. (1), we can write
dust=ηCO, (4)
and subsequently define the quantity Rdust/CO:
Rdust/CO≡ηXCOσν0=
px
τν(ν/ν0)−β
px WCO
, (5)
that we will call dust-to-CO ratio, whereηshould be∼1 in the case that molecular material is the dominant percentage of the total hydrogen content. Rdust/CO is defined as such
from the ratio of the gas surface densities, but separating the observables (dust emission and CO line intensity) from the conversion parameters. The values of the observables are derived from the tracer maps. In the following we use the Planck maps for CO and dust, rebinned at a resolution of 0.5◦, to match with the resolution of another tracer
map that will be introduced in the following. Regarding the conversion parameters, we consider the following intervals:
σ(353 GHz)={1.−4.1} ×10−26cm2H−1
XCO={0.5−4.8} ×1020cm−2(K km/s)−1.
(6) For a detailed discussion of this parameter space see Pedaletti et al. (2015). For ease of interpretation however, we will also refer to the average value of these parameters as:
σ(353 GHz)=2.5×10⁻²⁶cm2H−1
XCO=2×1020cm−2(K km/s)−1. (7)
Therefore the range of possible values for the ratio Rdust/CO
becomes
Rdust/CO={0.1. . .4}. (8)
Thus the average value of the dust-to-CO ratio parameter will be Rdust/CO=1. Extremes of this range of Rdust/CO
pinpoint mismatches in the mass estimations, that can however still reconciled with possible conversion parameters.
We calculate the dust-to-CO ratio Rdust/CO at the
position of the UNID VHE sources and show that in most cases Rdust/COis indeed contained in the band defined in
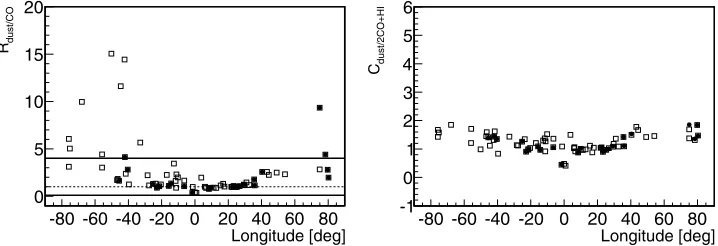
Eq. (8), see also Fig.3, left. All the objects that have an exceeding Rdust/CO are located at high Galactic latitudes
and especially in the Cygnus region (see Fig.3, left). But this is not the case for the inner Galactic region where the sample of Sect.3is located.
The molecular content has been estimated here through the intensity of the 12CO(1→0) line. However, if the gas
is diluted, this method is shown to fail (Ackermann et al.
2011). The gas that cannot be traced with this method is usually referred to as “dark” gas, or “CO-faint” gas (Grenier et al. 2005). Existence of such gas co-located with the UNID TeV sources may relax conditions on the accelerator power that is putatively injecting cosmic-rays, the interaction of which would generate the TeV photons.
Then, in order to better trace the total material content of a region, also the HI content estimation is assessed. The HI content can be traced through the intensity of the 21 cm line due to the hyperfine transition at the ground level. This quantity is provided by the Leiden Bonn Argentine (LAB) survey, which provides mapping of the intensity of the 21 cm HI line in cubes of galactic latitude, longitude, and radial velocity (Kalberla et al. 2005). We convert the velocity-integrated intensity into NHI, i.e
NHI=XHI
px
WHI. (9)
The sum of
px
WHI is calculated from the brightness
temperature given in the dataset and the binning in velocity of the data cube. The conversion factor in this case is XHI=1.82×1018cm−2(K km/s)−1 (see, e.g.,
Longitude [deg] -80 -60 -40 -20 0 20 40 60 80
dust/CO
R
0 5 10 15 20
Longitude [deg] -80 -60 -40 -20 0 20 40 60 80
dust/2CO+HI
C
-1 0 1 2 3 4 5 6
Figure 3. Left: Rdust/COversus galactic longitude. The horizontal solid lines delimit the accepted region for the value of Rdust/CO, with its average value represented by the dashed thin line. Black solid points are for the sample of UNID objects. For comparison we show also the larger Galactic VHE sample with open black squares, see Sect.4. Right: dust estimation excess Cdust/2CO+HIas a function of Galactic longitude. All points are calculated with XCO=2.0×1020cm−2(K km/s)−1 and XHI,thin=1.82×1018cm−2(K km/s)−1. All points are derived usingσlow(353 GHz)=1×10⁻²⁶cm2H−1, wheredust∝σν−1. Black solid points refer to the UNID sample. For comparison we show also the larger Galactic VHE sample with open black squares.
We now define a new parameterization of the three gas surface densities, so to consider all tracers. This estimate does not depend on the common terms, that areµand mH,
so that is proportional to NH/(2NH2+NHI) (see Eq. (21)
Bolatto et al.2013). After simplification, the quantity to be evaluated is:
Cdust/2CO+HI=
NH
2NH2+NHI
=
σ−1
ν0
px
τν(ν/ν0)−β
2XCO
px
WCO+XHI
px WHI
, (10)
and we will refer to it as dust estimation excess. We will now fix the dust opacity to σlow(353 GHz)=1×
10−26 cm2 H−1 (see Eq. (6)), so to use this value as
normalization. In Fig.3 (right) we show the distribution in longitude of the dust estimation excess derived from Eq. (10). We here assume the conversion factor for the mol-ecular component to be XCO=2.×1020cm−2(K km/s)−1,
as is the recommended standard Galactic value in Bolatto et al. (2013). We then fix the conversion factor for the atomic component to be XHI, in the optically thin
approximation. In this case one can see that, considering the atomic component, most of the UNID source locations are inside an acceptable band of Cdust/2CO+HI, defined
as follows. The lower limit of this band is set to Cdust/2CO+HI=1 and corresponds to the minimum value
of dust emissivity σlow(353GHz), while the upper limit
of Cdust/2CO+HI4, correspond to σhigh(353GHz) (see
Eq. (6)). Contrary to what is seen in the behaviour of Rdust/CO, also the positions in the sky with large Galactic
longitude or latitude are inside the allowed bounds. There is therefore no necessity to invoke a further gas component once one allows for a change in the conversion factor normalization.
While there is no evidence from this approach of a missing gas component or Cdust/2CO+HI>4, there are
instances of Cdust/2CO+HI<1. These locations are in
central regions of the inner Galaxy However, if we assume XCO=0.5×1020 cm−2(K km/s)−1, a value appropriate
for the Galactic Center region (see Bolatto et al. 2013), all values would then be inside the limits.
To avoid invoking a different dust emissivity from the ISM average in order to reconcile the gas surface densities estimates (hence Cdust/2CO+HI=1), other assumptions can
reduce the ratio Cdust/2CO+HI. Indeed, the estimate of
the CO or HI component can be incremented. With a larger value of XCO we can push up CO. The Cygnus
region, for example, presents some of the largest values of Cdust/2CO+HI. However this does not seem to be a
viable explanation when considering that the average value for the conversion factor in the molecular component in the Cygnus region, derived from Fermi-LAT data at high energies (HE; E100 MeV), is XCO=1.68×
1020cm−2(K km/s)−1 (Ackermann et al. 2012). On the
other hand, also the mass of the HI component can be underestimated if the optically thin approximation for the 21 cm line is no longer valid (at large column densities). As described by Fukui et al. (2014), this can lead to the mass estimate to be off by a factor of XHI,thick∼2XHI. The latter
approach would need to be coupled to a XCOslightly lower
than the Galactic average.
Considering the value of Rdust/CO and Cdust/2CO+HI,
we cannot associate the sample of UNID sources with locations where the canonical estimates of material content are failing. Therefore we cannot link them to dark gas.
5. Conclusions
A large part of the detected Galactic VHE sources is still classified as unidentified, due to the lack of suitable multiwavelength counterparts. Even if we cannot claim a correlation of the location of VHE sources and regions of enhanced material content, we have investigated here the possibility that these unidentified sources are located in peculiar regions of the Galaxy, where the classical estimates of the material content is not complete. We therefore analyzed the possible existence of “CO-faint” gas in the location of VHE unidentified sources. The presence of “CO-faint” gas can be constrained with a combination of three tracers: intensity of the12CO(1→0)
line to trace the molecular material (e.g., Dame et al.2001), dust emission to trace the total hydrogen content (e.g., Ade et al. 2014), and HI hyperfine transition at 21 cm to trace for atomic hydrogen (e.g., Kalberla et al. 2005). We have however shown that no additional gas component is needed to reconcile mass estimation from the three different tracer, when the uncertainty of the conversion factor XCO, XHI
andσ(353 GHz) is considered.
References
Ackermann, M., Ajello, M., Allafort, A., et al., 2012, A&A 538, 71
Ade, P.A.R., Aghanim, N., Arnaud, M., et al., 2011, A&A 536, A19
Ade, P.A.R., Aghanim, N., Alves, M.I.R., et al., 2014, A&A 564, 45
Aharonian, F., Akhperjanian, A.G., Bazer-Bachi, A.R., et al., 2006, ApJ 636, 777
Aharonian, F., Akhperjanian, A.G., Bazer-Bachi, A.R., et al., 2008, A&A 481, 401
Bolatto, A.D., Wolfire, M. & Leroy, A.K., 2013, ARA&A 51, 207B
Carrigan, S., Brun, F., Chaves, R.C.G., et al., 2013, arXiv:1307.4690
Dame, T.M., Ungerechts, H., Cohen, R.S., et al., 1987, ApJ 322, 706
Dame, T.M., Hartmann, Dap, Thaddeus, P., 2001, ApJ 547, 792D
Dubus, G., Contreras, J.L., Funk S., et al., (CTA Consortium) 2013, ApPh 43, 317
Fukui, Y., et al., 2014,arXiv:1401.7398
Ginzburg V.L., Syrovatskii S.I., 1964, The Origin of Cosmic Rays. Pergamon Press, London
Grenier, I.A., Casandjian, J., Terrier, R., 2005, Science 307, 1292
Kalberla, P.M.W., Burton, W.B., Hartmann, D., et al., 2005, A&A 440, 775
Mart´ın J., Torres D.F., & Rea N., 2012, MNRAS 427, 415 Pedaletti, G., de O˜na Wilhelmi, E. & Torres D.F., 2014,
A&A 565, 118P
Pedaletti, G., de O˜na Wilhelmi, E., Torres D.F. & Natale, G., 2015, in press, DOI:http://dx.doi.org/ 10.1016/j.jheap.2014.12.001