International Journal of Nanomedicine 2017:12 4921–4935
International Journal of Nanomedicine
Dove
press
submit your manuscript | www.dovepress.com 4921
O r I g I N a l r e s e a r c h
open access to scientific and medical research
Open access Full Text article
a top-down technique to improve the solubility
and bioavailability of aceclofenac: in vitro and
in vivo studies
reema Narayan1
abhyuday Pednekar1
Dipshikha Bhuyan1,2
chaitra gowda1,3
KB Koteshwara1
Usha Yogendra Nayak1
1Department of Pharmaceutics, Manipal college of Pharmaceutical sciences, Manipal University, Manipal, India; 2lupin ltd. (research Park), Pune, Maharashtra, India; 3Micro labs ltd., Bengaluru, Karnataka, India
Abstract: The aim of the present work was to tackle the solubility issue of a biopharmaceutics classification system (BCS)-II drug, aceclofenac. Although a number of attempts to increase the aqueous solubility have been made, none of the methods were taken up for scale-up. Hence size reduction technique by a top-down approach using wet milling process was utilized to improve the solubility and, consequently, the dissolution velocity of aceclofenac. The quality of the final product was ensured by Quality by Design approach wherein the effects of critical material attributes and critical process parameters were assessed on the critical quality attributes (CQAs) of nanocrystals. Box–Behnken design was applied to evaluate these effects on critical quality attributes. The optimized nanocrystals had a particle size of 484.7±54.12 nm with a polydispersity index (PDI) of 0.108±0.009. The solid state characterization of the formulation revealed that the crystalline nature of the drug was slightly reduced after the milling process. With the reduced particle size, the solubility of the nanocrystals was found to increase in both water and 0.1 N HCl when compared with that of unmilled pure aceclofenac. These results were further supported by in vitro release studies of nanocrystals where an appreciable dissolution velocity with 100.07%±2.38% release was observed for aceclofenac nanocrystals compared with 47.66%±4.53% release for pure unmilled aceclofenac at the end of 2 h. The in vivo phar-macokinetic data generated showed a statistically significant increase in the Cmax for aceclofenac nanocrystals of 3.75±0.28 µg/mL (for pure unmilled aceclofenac Cmax was 1.96±0.17 µg/mL). The results obtained indicated that the developed nanocrystals of aceclofenac were successful in improving the solubility, thus the absorption and bioavailability of the drug. Hence, it may be a viable and cost-effective alternative to the current therapy.
Keywords: aceclofenac, nanocrystals, ball milling, QbD, DoE, box-behnken design
Introduction
Advances such as computer-aided drug design and combinatorial chemistry have been a boon to scientists leading to the discovery of a number of drugs in the recent years. However, the majority of the drugs have high lipophilicity and lower aqueous solu-bility. About 40% of the drugs currently in the market belong to the poorly soluble category. This leads to inadequate absorption, requiring larger doses of these drugs to show therapeutic efficacy. The poor solubility is of particular concern for orally administered drugs as it may lead to dose-related toxicities and also increase the cost of drug development.1 The drug solubility issue can be a major obstacle in the clinical
translational process. As new drug discovery is a costly affair for the pharmaceutical industry, a majority of them are focusing on improving the solubility of the currently marketed drugs by adopting various formulation strategies.2
correspondence: Usha Yogendra Nayak Department of Pharmaceutics, Manipal college of Pharmaceutical sciences, Manipal University, Manipal 576104, India Tel +91 94492 07925
Fax +91 82 0257 1998 email [email protected]
Journal name: International Journal of Nanomedicine Article Designation: Original Research
Year: 2017 Volume: 12
Running head verso: Narayan et al
Running head recto: Nanocrystals of aceclofenac DOI: http://dx.doi.org/10.2147/IJN.S141504
International Journal of Nanomedicine downloaded from https://www.dovepress.com/ by 118.70.13.36 on 23-Aug-2020
For personal use only.
Number of times this article has been viewed
This article was published in the following Dove Press journal: International Journal of Nanomedicine
Dovepress
Narayan et al
Various strategies that have shown improvement in solubility include solid dispersion technique,3,4 co-crystals,5,6
formation of inclusion complexes,7,8 crystal engineering,9
size reduction and nanonization,10,11 and self-emulsifying
drug delivery systems.12,13 Of these, nanonization technology
is the widely explored and well-established technique for improving the solubility of drugs. There are two approaches for size reduction, namely, bottom-up and top-down approach. In the former approach, controlled precipitation of the drugs is achieved using a suitable solvent. Addition of non-solvent results in super-saturation and nucleation, leading to smaller particles.14 The major disadvantage of this method is
the presence of residual organic solvents. The latter approach involves size reduction of particles to nano range by using high-pressure homogenization (HPH) or milling techniques.15
Of late, another newer technique that is, hot-melt extrusion with HPH is slowly gaining importance.16 In the present study,
the nanocrystals approach to improve the solubility of a poorly soluble drug aceclofenac (ACF) was attempted using wet mill-ing method by utilizmill-ing Quality by Design (QbD) approach.
Drug nanocrystals are crystals of parent compound usu-ally of size ,1 µm. They are usually composed of 100% drug without being carriers stabilized with surfactants or steric sta-bilizers. They are widely accepted because of their advantages over others, that is, they are carrier-free nanoparticles and are easily scalable. A number of approved drug nanocrystals are available in the market like Rapamune® (Pfizer Inc., NY, USA),
Emend® (Merck & Co., Inc., NJ, USA), Tricor® (AbbVie Inc.,
North Chicago, IL, USA), Megace® (Par Pharmaceutical, Inc.,
NJ, USA) ES.17–19 In spite of the fact that bottom-up process for
the production of nanocrystals has greater potential in improving the solubility, and hence bioavailability, due to efficient particle size reduction below 100 nm and amorphization of the drugs, the currently marketed products have been fabricated by top-down approach. The drawback of this approach is the scale-up problems, wide particle size distribution, and longer processing time.20,21 The feasibility of using the top-down approach has been
proven by the use of this technology for the production of the commercially available products. Most of these products rely on the use of media milling and HPH approach.16 Both these
processes carry out size reduction in the liquid suspension form. Hence, careful selection of appropriate type and concentration of stabilizers is the key in the formation of stable nanosuspension.22
Out of these two methods, media milling has tremendous poten-tial to produce commercially viable products due to its ease of scale-up that makes the laboratory scale design of nanocrystals valuable. Wet milling technique utilizes ball milling using mill-ing media (glass, zirconium or stainless steel balls).23
In the present study, the advantages of wet milling technique using ball mill with milling media were exploited to produce nanocrystals of ACF. Milling is a technique where the coarse particles are broken down into smaller ones by the utilization of mechanical energy. It is one of the easiest ways of producing nanocrystals even on a commercial scale and is highly versatile as any active pharmaceutical ingredient can be processed efficiently.18 Literature has
reported increased solubility and bioavailability of drugs with particle size reduction by ball milling. ACF is a non-steroidal anti-inflammatory drug that has poor water solu-bility, resulting in low bioavailability. It has log P-value of 2.170.24 Scientists have worked on improving the solubility
of ACF by various approaches like solid dispersion,9,25
cyclodextrin complexes,26,27 chitosan nanoparticles,28 and
nanocrystals.29,30 Recently, Park et al prepared decorated ACF
nanocrystals using nanoprecipitation technique. The size was controlled by probe-sonication.29 There is another literature
on ACF-Soluplus® nanocomposites by high-shear
homog-enization using a probe sonicator.31 Nevertheless, most of
these methods use many excipients that may be an economic burden. Also, researchers have used probe-sonication as the tool for size control. Probe sonication induces high energy to the dispersion and reduces the particle size; however, the high energy is not optimal as this may alter the surface characteristics of the drug. The present research work makes use of cost-effective methodology and equipment, that is, ball milling. The nanocrystals produced from ball milling have the additional advantage of up-scaling and down-scaling as per the requirements. In addition, application of QbD will help to reduce the variability that affects product quality and minimize the risk factors. QbD establishes the relationship between the formulation process variables and critical quality attributes (CQAs). Implementation of QbD concepts in drug development will provide high-quality medicines to the consumers at low cost and assures to improve manufacturing quality performance significantly. Accordingly, in the present study, Box–Behnken Design (BBD) was used for construct-ing the design space.32,33 There are number of designs
avail-able for designing the experiments such as screening design including full factorial,34 Plackett–Burman,35 and mixture
designs.36 BBD is a response surface design and has
advan-tages of predicting the curvature compared with screening designs, as BBD is a second-order quadratic model for nonlinear responses. While other response designs, includ-ing central composite design, require experiments to be performed at 5 levels for each factor, BBD requires 3 levels with lesser number of experimental trials.33
International Journal of Nanomedicine downloaded from https://www.dovepress.com/ by 118.70.13.36 on 23-Aug-2020
Dovepress Nanocrystals of aceclofenac
Materials and methods
Materials
ACF was obtained from Lupin Research Park, Pune, India. Polyvinyl alcohol (PVA) with average molecular weight of 30,000–40,000 g/mol was procured from Sigma-Aldrich, St Louis, MO, USA. All other chemicals used were of analytical or high-performance liquid chromatography (HPLC) grade.
analysis of acF
The amount of ACF present in the formulation and plasma was analyzed by ultraviolet (UV) and HPLC method, respectively. ACF present in the formulation was estimated spectrophotometrically (UV-1601 PC; Shimadzu Corpora-tion, Kyoto, Japan) at a wavelength of 275 nm. ACF in the plasma was quantified using a validated HPLC method ( Shimadzu LC-2010HT; Shimadzu Corporation).37 A sample
quantity of 80 µL was injected into the HPLC column (Hypersil BDS C18, 5 µm) and maintained at 25°C, which was eluted out using methanol: 0.3% triethylamine pH 7.0 (60:40 v/v) as mobile phase. The flow rate was maintained at 1.0 mL/min and the ACF was detected at 275 nm using UV detector. Prior to ACF analysis in plasma, the samples were processed and drug was extracted from the same using acetonitrile by protein precipitation method. To 100 µL of rat plasma, 25 µL of 500 µg/mL concentration of venlafax-ine (internal standard) and 200 µL of chilled acetonitrile were added and vortexed (Spinix™ MC-01, Vortex Shaker; Tarsons®Products Pvt. Ltd., Kolkata, India) for 1 min. To
this, 675 µL of diluent (methanol:water =80:20 v/v) was added. The above solution was vortexed again to ensure thorough mixing and then centrifuged (3K30; Sigma®
Laborzentrifugen, Osterode am Harz, Germany) at 10,000 rpm for 10 min at 4°C. The supernatant obtained was injected into HPLC. Both the peaks were found to be resolved with a retention time of 10.208 min and 18.285 min for ACF and venlafaxine, respectively.
Formulation design of nanocrystals by
QbD approach
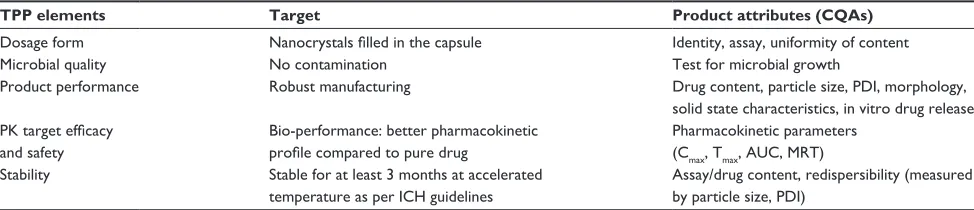
The nanocrystals of ACF were prepared by adopting the QbD approach. The target product profile (TPP) was set to ensure quality product and is shown in Table 1. Based on the literature available, some of the critical material attributes (CMAs) and critical process parameters (CPPs) were identified that may affect the TPP. The parameters taken into consideration were the milling time, size of balls used, concentration of stabilizer and amount of drug. A risk assessment analysis was performed based on the literature available and the low-risk factors were eliminated from the study. The risk assessment matrix is shown in Table 2. Particle size, polydispersity index (PDI), and zeta potential were chosen as the main risk factors affecting the product performance and for the analysis of CQAs.
Design of experiments (Doe) for
optimization of acF nanocrystals
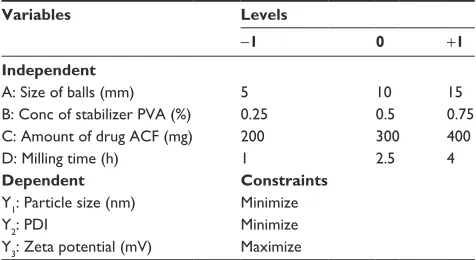
DoE is an integral part of QbD that aids in the planning, optimization and systematic screening of the parameters involved. BBD was used in the present study and particle size (Y1), PDI (Y2), and zeta potential (Y3) were selected as the CQAs. The independent variables taken into consideration were size of balls (A), concentration of stabilizer (B), amount of drug (C), and milling time (D). The speed at which the ball mill rotated was kept constant. The 4 factors were evaluated at 3 levels (−1, 0, +1). Numerous experimental designs are available to optimize the formulations that vary based on its applications. In the current study, BBD was selected to study the main as well as interaction effects of the independent variables on the responses. The main aim of the work was to obtain nanocrystals with minimum particle size. BBD is very efficient when the number of factors is more than 3 and to minimize the number of runs as compared with that of central composite design. The values of the coded factors
Table 1 TPP for the development of nanocrystals of acF
TPP elements Target Product attributes (CQAs)
Dosage form Nanocrystals filled in the capsule Identity, assay, uniformity of content
Microbial quality No contamination Test for microbial growth
Product performance robust manufacturing Drug content, particle size, PDI, morphology,
solid state characteristics, in vitro drug release PK target efficacy
and safety
Bio-performance: better pharmacokinetic profile compared to pure drug
Pharmacokinetic parameters (cmax, Tmax, aUc, MrT)
stability stable for at least 3 months at accelerated
temperature as per Ich guidelines
assay/drug content, redispersibility (measured by particle size, PDI)
Abbreviations: acF, aceclofenac; aUc, area under the curve; cmax, maximum plasma concentration; cQas, critical quality attributes; Ich, International council for
harmonisation of Technical requirements for Pharmaceuticals for human Use; MrT, mean residential time; PDI, polydispersity index; PK, pharmacokinetic; Tmax, time for
maximum plasma concentration; TPP, target product profile.
International Journal of Nanomedicine downloaded from https://www.dovepress.com/ by 118.70.13.36 on 23-Aug-2020
Dovepress
Narayan et al
Table 2 risk assessment matrix elucidating the effect of cMas and cPPs on product attributes
Drug product’s CQAs Risk assessment matrix
CMAs CPPs
Surfactant type
Conc of surfactant (%)
Amount of drug (mg)
Milling time (h)
Ball mill speed (rpm)
Size of balls (mm)
Particle size Medium Medium Medium high high high
PDI Medium high Medium high high high
Zeta potential high high Medium Medium Medium Medium
Drug content low low low low low low
rate and extent of release Medium Medium Medium high high high
Abbreviations: cMas, critical material attributes; cPPs, critical product parameters; cQas, critical quality attributes; PDI, polydispersity index.
for each of the levels are shown in Table 3. The equations were constructed using Design-Expert® software (Trial
version 10; Stat-Ease Inc., Minneapolis, MN, USA) and analysis of variance (ANOVA) was used to analyze the model statistically. The experiments were performed in a random fashion as suggested by the software. Based on the results suggested by the software, the optimized batch was prepared again to calculate the relative error and the deviation between the theoretical and practical approach. Three-dimensional response surface plots were designed to clearly identify the effect of variables.
Nanocrystal preparation by wet milling
method
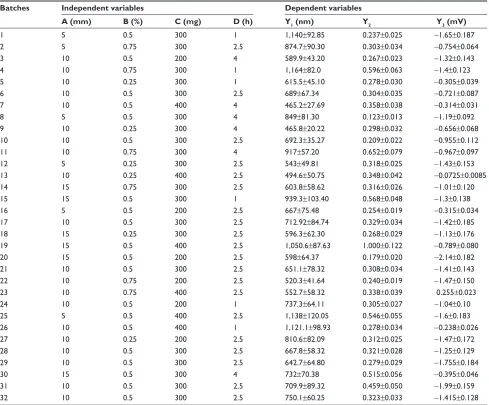
Nanocrystals of ACF were produced by wet milling technique using a ball mill (PM100; Retsch Inc., Newtown, PA, USA). A suspension of ACF in 60 mL of PVA solution was prepared. In order to ensure homogenous dispersion, the suspension was stirred using a magnetic stirrer for 15 min. The drug suspen-sion was wet milled using preweighed balls (100 g) at constant milling speed of 400 rpm. To evaluate the effect of milling time, size reduction was performed for 1, 2.5, and 4 h. The drug amount was varied between “low” and “high” levels of 200 and 400 mg, respectively. Composition of various batches for
formulation is given in Table 4. The obtained suspension was then centrifuged (3K30; SigmaLaborzentrifugen) at 22,000 rpm for 15 min to remove the dispersion medium. The pel-lets obtained were finally dried at 45°C for 24 h to obtain the nanocrystals of ACF.
characterization of the nanocrystal
formulation
Mean particle size, PDI and zeta potential
Particle size, size distribution, and zeta potential of the nanocrystals were determined by dynamic light scattering technique using Malvern Zetasizer (ZEN 3600; Malvern Instruments, Malvern, UK) and these were also as a part of process analytical tool. The analysis was carried out in triplicates at 25°C±1°C.38,39 The results are presented as
mean ± SD in Table 4.
solid-state characterization
To evaluate the crystalline state of both pure drug and nanocrystal formulation, powder X-ray diffraction (XRD) and differential scanning calorimetric (DSC) studies were performed. XRD pattern was recorded using X-ray diffractomer (X’Pert Powder PAN analytical system, Almelo, the Netherlands) with Cu Ka radiation generated at 40 mA and 35 kV. Scanning of the samples was performed in the range of 5°C–80°C. DSC analysis of the samples was performed using DSC 60 Calorimeter (DSC-60 Plus; Shimadzu Corpora-tion). Weighed amount of samples were placed in aluminum sealed pans and heated from 0°C to 250°C at a heating rate of 10°C/min and under dry nitrogen flow (30 mL/min).
Particle morphology
The morphology of the surface of drug nanocrystals was observed under scanning electron microscope (JSM 50 A; JEOL, Tokyo, Japan). The samples were gold plated with sputter coater, placed on aluminum plates, and observed at an acceleration voltage of 15 kV.
Table 3 Variables in Box-Behnken design to form acF nano-crystals
Variables Levels
−1 0 +1
Independent
a: size of balls (mm) 5 10 15
B: conc of stabilizer PVa (%) 0.25 0.5 0.75
c: amount of drug acF (mg) 200 300 400
D: Milling time (h) 1 2.5 4
Dependent Constraints
Y1: Particle size (nm) Minimize
Y2: PDI Minimize
Y3: Zeta potential (mV) Maximize
Abbreviations: acF, aceclofenac; PVa, polyvinyl alcohol; PDI, polydispersity index.
International Journal of Nanomedicine downloaded from https://www.dovepress.com/ by 118.70.13.36 on 23-Aug-2020
Dovepress Nanocrystals of aceclofenac
saturation solubility study of nanocrystals
formulation
Saturation solubility of pure drug and optimized nanocrystals formulation was tested in water and 0.1 N HCl. An excess amount of unmilled ACF and ACF nanocrystals were added to 10 mL of each solvent separately and shaken in a water bath shaker for 24 h at room temperature. The mixture was then filtered using 0.22 µm filter and the filtrate was suit-ably diluted. The absorbance of the solution was measured at 275 nm using a UV spectrophotometer (UV-1601 PC; Shimadzu Corporation) to determine the solubility of ACF.
In vitro release studies
In vitro release profile of pure ACF and ACF nanocrystals was determined using USP-I apparatus (Electrolab, Mumbai, India). ACF and nanocrystals equivalent to 100 mg of ACF were filled into separate capsules and carefully placed in
the dissolution jar. The release of the drug was studied in 900 mL of 0.1 N HCl containing 2% Tween 80 maintained at 37°C±0.5°C at 75 rpm.28 Sample quantities of 5 mL were
withdrawn at predetermined time intervals and equal volume of medium was replaced in the jar to maintain sink condi-tions. The samples were filtered using 0.22 µm filters and analyzed spectrophotometrically (UV-1601 PC; Shimadzu Corporation) at 275 nm.
Pharmacokinetic studies
The pharmacokinetics of the formulated nanocrystals of ACF was compared with that of pure drug in Wistar albino rats. The animals were maintained at a temperature of 25°C±3°C and 60%±5% relative humidity (RH). They were housed in wire cages with free access to feed and water ad libitum. The animals for the study were subjected to overnight fasting. The study was carried out in accordance with The Committee
Table 4 composition and responses of nanocrystals of acF
Batches Independent variables Dependent variables
A (mm) B (%) C (mg) D (h) Y1 (nm) Y2 Y3 (mV)
1 5 0.5 300 1 1,140±92.85 0.237±0.025 −1.65±0.187
2 5 0.75 300 2.5 874.7±90.30 0.303±0.034 −0.754±0.064
3 10 0.5 200 4 589.9±43.20 0.267±0.023 −1.32±0.143
4 10 0.75 300 1 1,164±82.0 0.596±0.063 −1.4±0.123
5 10 0.25 300 1 615.5±45.10 0.278±0.030 −0.305±0.039
6 10 0.5 300 2.5 689±67.34 0.304±0.035 −0.721±0.087
7 10 0.5 400 4 465.2±27.69 0.358±0.038 −0.314±0.031
8 5 0.5 300 4 849±81.30 0.123±0.013 −1.19±0.092
9 10 0.25 300 4 465.8±20.22 0.298±0.032 −0.656±0.068
10 10 0.5 300 2.5 692.3±35.27 0.209±0.022 −0.955±0.112
11 10 0.75 300 4 917±57.20 0.652±0.079 −0.967±0.097
12 5 0.25 300 2.5 543±49.81 0.318±0.025 −1.43±0.153
13 10 0.25 400 2.5 494.6±50.75 0.348±0.042 −0.0725±0.0085
14 15 0.75 300 2.5 603.8±58.62 0.316±0.026 −1.01±0.120
15 15 0.5 300 1 939.3±103.40 0.568±0.048 −1.3±0.138
16 5 0.5 200 2.5 667±75.48 0.254±0.019 −0.315±0.034
17 10 0.5 300 2.5 712.92±84.74 0.329±0.034 −1.42±0.185
18 15 0.25 300 2.5 596.3±62.30 0.268±0.029 −1.13±0.176
19 15 0.5 400 2.5 1,050.6±87.63 1.000±0.122 −0.789±0.080
20 15 0.5 200 2.5 598±64.37 0.179±0.020 −2.14±0.182
21 10 0.5 300 2.5 651.1±78.32 0.308±0.034 −1.41±0.143
22 10 0.75 200 2.5 520.3±41.64 0.240±0.019 −1.47±0.150
23 10 0.75 400 2.5 552.7±58.32 0.338±0.039 0.255±0.023
24 10 0.5 200 1 737.3±64.11 0.305±0.027 −1.04±0.10
25 5 0.5 400 2.5 1,138±120.05 0.546±0.055 −1.6±0.183
26 10 0.5 400 1 1,121.1±98.93 0.278±0.034 −0.238±0.026
27 10 0.25 200 2.5 810.6±82.09 0.312±0.025 −1.47±0.172
28 10 0.5 300 2.5 667.8±58.32 0.321±0.028 −1.25±0.129
29 10 0.5 300 2.5 642.7±64.80 0.279±0.029 −1.755±0.184
30 15 0.5 300 4 732±70.38 0.515±0.056 −0.395±0.046
31 10 0.5 300 2.5 709.9±89.32 0.459±0.050 −1.99±0.159
32 10 0.5 300 2.5 750.1±60.25 0.323±0.033 −1.415±0.128
Abbreviation: acF, aceclofenac.
International Journal of Nanomedicine downloaded from https://www.dovepress.com/ by 118.70.13.36 on 23-Aug-2020
Dovepress
Narayan et al
for the Purpose of Control and Supervision of Experiments on Animals (CPCSEA) guidelines and the protocol was approved by the Institutional Animal Ethical Committee, Kasturba Medical College, Manipal (IAEC/KMC/07/2017). The animals weighing 200±8 g were divided into 2 groups of 6 animals each and treated orally with a dose of 10 mg/kg as mentioned later in this study. The drug and formulation were dispersed in 0.5% carboxymethyl cellulose (CMC) before administration. Blood samples were withdrawn periodically at 0.5, 1, 2, 4, 6, 8, and 12 h post-dosing in tubes containing 10% ethylenediaminetetraacetic acid (EDTA). Plasma was separated by centrifugation (3K30; Sigma Laborzentrifugen) and stored at −80°C until further analysis. The amount of drug in plasma was quantified using HPLC method. The pharma-cokinetic parameters Cmax, Tmax, area under the curve (AUC), and Ke were determined by non-compartmental analysis using WinNonlin Software v.5.2 (Pharsight Corporation, Mountain View, CA, USA).
1. Group I – Pure drug p.o.
2. Group II – ACF nanocrystals formulation p.o.
stability studies
The developed formulation was subjected to accelerated stabil-ity testing as per The International Council for Harmonisation of Technical Requirements for Pharmaceuticals for Human Use (ICH) guidelines at 40°C±2°C/75%±5% RH to assess the long-term storage of the formulation. The formulation was placed in United States Pharmacopeia Type-1 flint vials and hermetically sealed with bromobutyl rubber plugs and aluminum caps. The samples were stored in humidity cham-bers (Thermolab, Mumbai, India) for 90 days and evaluated for particle size and solubility at the end of the study.
statistical analysis
The data obtained was expressed as mean ± SD. Student’s
t-test utilizing GraphPad Prism® (v 1.13) software (La Jolla,
CA, USA) was used to compare the different groups. The value of P,0.05 was considered as statistically significant.40
Results and discussion
The development of nanocrystals formulation was carried out as per QbD guidelines where the CQAs and CPPs were iden-tified. To assess the effect of material attributes and process parameters on CQAs, DoE was applied to arrive at the opti-mized formulation. A total of 32 runs as per BBD were gener-ated and the responses obtained are summarized in Table 4. The responses observed were fitted into various models like linear and quadratic using Design-Expert software (Trial version 10; Stat-Ease Inc., MN, USA) to interpret the effects
of the factors. The independent variables were identified, and their effect on the dependent variables was analyzed using statistical tools (ANOVA) and three-dimensional (3D) plots. The plots help to study the effect of factors on the responses and also aid in assessing the interaction effect of 2 factors at the same time. The model generated for each of the dependent variables and their influence on the responses is discussed below. The BBD was found to be slightly efficient than other response surface designs but has demonstrated significant efficiency than 3-level full factorial design. Stabilizers play a crucial role in the formulation of nanocrystals. Polymeric stabilizers usually work as steric barriers by getting adsorbed on the particle surface. The surface covering prevents further particle aggregation. Polymers also hinder the collision and growth of particles by accumulating in the hydrodynamic layer between the particles. In the present study, PVA was selected as the stabilizer as it is nonionic, non-toxic and biocompatible.41 In addition to this, it has good aqueous
solubility, swelling properties and can form an efficient steric barrier preventing particle aggregation.42
effect of independent variables on
particle size
Particle size is the most important factor governing the solubility of nanocrystals thus improving the bioavailability of a drug. The mean particle size of unmilled ACF was 3,428.42±267.23 nm and that of nanocrystals was found to be in the range of 465.2±27.69 to 1,164±82.0 nm. BBD suggested a linear model for the effect of particle size. The relationship between the coded factors and particle size was assessed using Equation 1 and 3D plots.
Particle size = 740.67 − 57.64A + 92.22B
+ 74.93C − 141.53D (1)
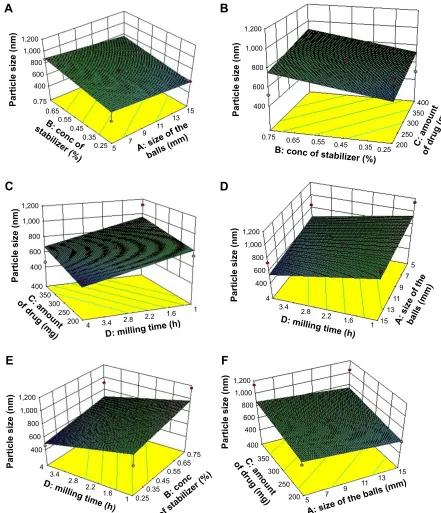
As per the ANOVA results for optimization, a model F-value of 3.52 was obtained, which suggests that the model is significant. There is only 1.94% chance that model F-value this large could be due to noise. This was further supported by Prob . F-value, which was ,0.05, indicating that the model terms are significant. Based on the equation, it can be observed that milling time (D) had a profound effect on the particle size (P,0.05). Both milling time (D) and size of balls (A) had negative coefficients whereas the value of coefficients for concentration of PVA (B) and amount of ACF (C) was positive. The negative sign for the coefficient of milling time indicates that the particle size decreases with an increase in the milling time. This can be attributed to the increase in the energy and shear forces produced
International Journal of Nanomedicine downloaded from https://www.dovepress.com/ by 118.70.13.36 on 23-Aug-2020
Dovepress Nanocrystals of aceclofenac
due to impact between the grinding balls and the drug that provides high energy to break the microparticles to nanosized particles.15 The positive sign of coefficients for
the concentration of PVA and amount of ACF indicates that the particle size increases as the value of the variables increases. The effect of the parameters is clearly observed in the 3D plots shown in Figure 1A–F. As per the reports,
an increase in the PVA concentration increases the particle size due to the increased viscosity of the dispersion medium, resulting in decreased attrition between balls and particles and also leading to greater amount of coating on the particle surface.43–46 The increase in the amount of ACF was found
to increase the particle size. This could be possibly due to the increased amount of drug in the dispersed phase that
$VL]HRIWKH
EDOOVPP %FRQFRI
VWDELOL]HU
3DUWLFOHVL]HQP
&DPRXQW RIGUXJPJ %FRQFRIVWDELOL]HU
3DUWLFOHVL]HQP
$
%
'PLOOLQJWLPHK
&DPRXQW RIGUXJPJ
3DUWLFOHVL]HQP
$VL]HRIWKHEDOOVPP 'PLOOLQJWLPHK
3DUWLFOHVL]HQP
&
'
'PLOOLQJWLPHK
%FRQF RIVWDELOL]HU
3DUWLFOHVL]HQP
$VL]HRIWKHEDOOVPP
&DPRXQW RIGUXJPJ
3DUWLFOHVL]HQP
(
)
Figure 1 Three-dimensional plots showing the effect of independent variables on particle size.
Notes: (A) effect of concentration of stabilizer and size of the balls on particle size; (B) effect of concentration of stabilizer and amount of drug on particle size; (C) effect
of amount of drug and milling time on particle size; (D) effect of milling time and size of the balls on particle size; (E) effect of milling time and concentration of stabilizer on
particle size; (F) effect of amount of drug and size of the balls on particle size.
Abbreviation: conc, concentration.
International Journal of Nanomedicine downloaded from https://www.dovepress.com/ by 118.70.13.36 on 23-Aug-2020
Dovepress
Narayan et al
results in inefficient particle size reduction.47 The larger the
size of the balls, the greater is the contact between the drug particles and the balls, leading to better attrition between the two. Hence better size reduction with smaller size particles can be obtained.48 In the present work, similar results were
obtained on varying the size of the grinding balls.
effect of independent variables on PDI
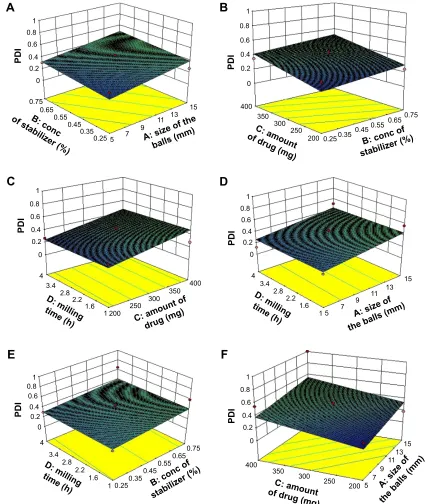
The PDI value ranging from 0.123 to 0.65 supported the presence of homogeneous and narrow particle size distribu-tion. One of the batches showed a high PDI of 1.000, which suggests that the batch showed inhomogeneity in particle size. Usually, a PDI value of ,0.5 is considered to be acceptable. A linear model was used to represent the factors affecting for PDI. Equation 2 shows the relationship between PDI and the coded factors.
PDI = 0.36 + 0.089A + 0.052B + 0.11C
− 0.004083D (2)
From Equation 2, we can observe that the effect of the four factors on PDI is comparatively lesser than that to particle size. The size of balls (A), the concentration of PVA (B), and the amount of ACF (C) were found to be directly related whereas the milling time (D) was inversely related to the PDI. The ANOVA analysis of the model with F-value of 3.00 indicates that it was significant. There was only 3.59% chance that the F-value could be due to noise. Prob . F-value ,0.05 indicates that the model generated is significant. The amount of ACF was found to affect the PDI (P,0.05) significantly. As the amount of ACF was increased, there was a chance of inefficient particle size reduction, which could lead to non-uniform particle size distribution and result in high PDI, which would be in accordance with the results of particle size. The 3D plots depicting the effect of variables on PDI are presented in Figure 2A–F.
effect of independent variables on zeta
potential
Zeta potential is useful in interpreting the stability of nano-suspension. Generally, a zeta potential greater than +30 and −30 mV is considered to be stable. The higher the zeta, the greater will be the repulsion among the particles render-ing the suspension stable. The zeta potential values of ACF nanocrystals ranged from −0.0725 to −2.14 mV as shown in Table 4. This low value suggests inefficient covering on the surface of the nanocrystals by PVA, resulting in unstable dispersion. When neutral polymers are used, a shift in the
shear plane away from the surface was observed, resulting in lower values for zeta potential.45
The polynomial regression equation
generated for the coded factors is shown
below
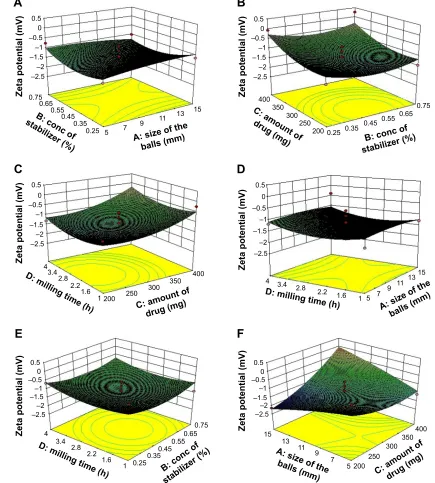
Zeta potential = −1.36 + 0.015A − 0.024B + 0.42C
+ 0.091D − 0.14AB + 0.66AC + 0.051CD
− 0.085A2+ 0.33B2+ 0.31C2+ 0.28D2
(3)
The quadratic model with F-value of 2.55 indicates that the model was significant with 3.32% chances that it could because of noise. In this case, the amount of ACF (C) and combined effect of size of balls and amount of ACF (AC) played a significant role in influencing the zeta potential of the dispersion (P,0.05). The 3D plots shown in Figure 3A–F show the effect of variables on zeta potential. The increase in the amount of PVA was directly related to its zeta potential. The nonionic polymer PVA is reported to stabilize a variety of nanoparticle systems. With the increase in PVA con-centration, absolute value of zeta potential was decreasing. However, it was going toward positive and stabilizing the system. As the amount of ACF increased, an increase in zeta potential moving toward zero was observed. The interactive effect of the size of balls together with the amount of ACF had a direct correlation with the zeta potential of the drug suspension. Keeping in mind the stability issues related to the nanocrystals in dispersion form on extended storage condition, and as per the TPP, the final intended dosage form was solid, the resulting formulation was converted to a dry powder by centrifugation. Hence the low zeta potential would probably not have significance in the current study.
Optimization of the formulation
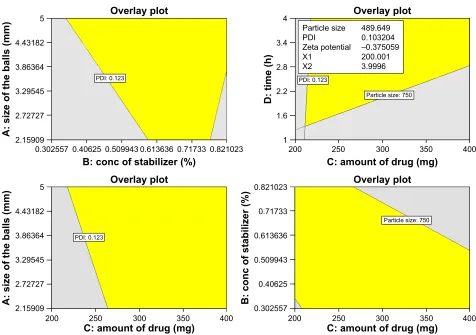
The purpose of optimization was to obtain a product with desired CQAs with predefined responses. In our present study, the analysis was performed using Design-Expert software, and the solution was generated with a goal of attaining minimum particle size and PDI with maximum zeta potential. Figure 4 shows the optimum design space comprised of the yellow overlap region. The design space was very wide. Many solutions were suggested by the software based on the design space; however, the optimum formulation was selected based on the desirability value. The value near to 1.00 was chosen. The software suggested a solution with desirability value of 0.892. It predicted that ACF nanocrys-tals with desired quality would be obtained by milling the
International Journal of Nanomedicine downloaded from https://www.dovepress.com/ by 118.70.13.36 on 23-Aug-2020
Dovepress Nanocrystals of aceclofenac
dispersion containing 200 mg ACF (C) in 0.25% PVA (B) solution for 4 h (D) using balls of 5 mm (A). A laboratory experiment with the predicted solution was performed, and the CQAs were evaluated to validate the procedure. The results of the predicted and obtained results are shown in Table 5. The percentage error was found to be low (,5%)
indicating that the results obtained were considered to have a strong correlation with the software-generated results. The low percentage error can also be an indicator that the formulation developed with the optimized CMAs and CPPs may yield reproducible results with less variation in the CQAs of the product.
$VL]HRIWKH
EDOOVPP %FRQF
RIVWDELOL]HU
3',
$
%FRQFRI VWDELOL]HU
&DPRXQW RIGUXJPJ
3',
%
'PLOOLQJ WLPHK
&DPRXQWRI GUXJPJ
3',
&
'PLOOLQJ WLPHK
$VL]HRI WKHEDOOVPP
3',
'
'PLOOLQJ WLPHK
%FRQFRI VWDELOL]HU
3',
(
$VL]HRI
WKHEDOOVPP
&DPRXQW RIGUXJPJ
3',
)
Figure 2 Three-dimensional plots showing the effect of independent variables on PDI.
Notes: (A) effect of concentration of stabilizer and size of the balls on PDI; (B) effect of concentration of stabilizer and amount of drug on PDI; (C) effect of amount of
drug and milling time on PDI; (D) effect of milling time and size of the balls on PDI; (E) effect of milling time and concentration of stabilizer on PDI; (F) effect of amount of
drug and size of the balls on PDI.
Abbreviations: conc, concentration; PDI, polydispersity index.
International Journal of Nanomedicine downloaded from https://www.dovepress.com/ by 118.70.13.36 on 23-Aug-2020
Dovepress
Narayan et al
characterization of the nanocrystals
solid-state characterization
A slight reduction in peak intensity but not a significant one could be appreciated from the XRD of ACF nanocrystals when compared with that of unmilled ACF. The characteristic peaks for ACF nanocrystals were found at the same 2θ value as that of unmilled ACF. This shows that the crystallinity of the ACF was not affected to a greater extent after the milling process. Reports suggest that polymeric stabilizers do not alter the crystal
structure of drug particle that matches the obtained results where PVA was used as stabilizer.49 Figure 5A and B shows the XRD
pattern of unmilled powder and the nanocrystals.
Thermal properties
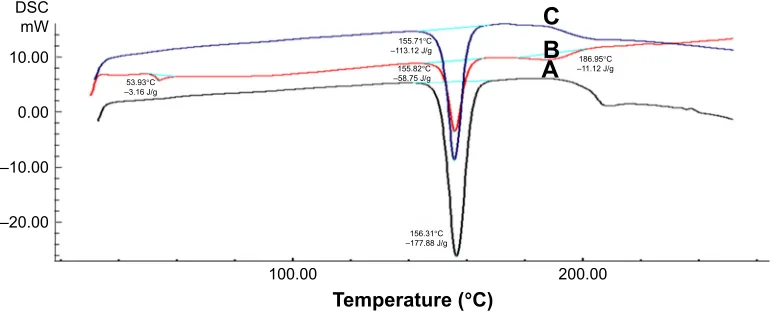
DSC thermograms of pure ACF (a) showed a typical endo-thermic peak at 156.31°C with an enthalpy of −177.88 J/g. The physical mixture of ACF and PVA (1:1 ratio) gave a peak at 155.82°C, and the nanocrystals of ACF showed a peak at
Figure 3 Three-dimensional plots showing the effect of independent variables on zeta potential.
Notes: (A) effect of concentration of stabilizer and size of the balls on zeta potential; (B) effect of concentration of stabilizer and amount of drug on zeta potential; (C) effect
of amount of drug and milling time on zeta potential; (D) effect of milling time and size of the balls on zeta potential; (E) effect of milling time and concentration of stabilizer
on zeta potential; (F) effect of amount of drug and size of the balls on zeta potential.
Abbreviation: conc, concentration.
± ± ± ± ±
&DPRXQWRIGUXJPJ
$VL]HRIWKH EDOOVPP =HWDSRWHQWLDOP9
± ± ± ± ±
'PLOOLQJWLPHK
&DPRXQWRI GUXJPJ
=HWDSRWHQWLDOP9
$VL]HRIWKH EDOOVPP
%FRQFRI VWDELOL]HU
=HWDSRWHQWLDOP9
± ± ± ± ±
'PLOOLQJWLPHK
%FRQFRI VWDELOL]HU
=HWDSRWHQWLDOP9
±
± ±± ±
± ± ± ± ±
'PLOOLQJWLPHK
$VL]HRIWKH EDOOVPP
=HWDSRWHQWLDOP9
=HWDSRWHQWLDOP9
± ± ± ± ±
&DPRXQWRI GUXJPJ
%FRQFRI VWDELOL]HU
$
%
&
(
)
'
International Journal of Nanomedicine downloaded from https://www.dovepress.com/ by 118.70.13.36 on 23-Aug-2020
Dovepress Nanocrystals of aceclofenac
155.71°C, which corresponds to the melting point of ACF and an enthalpy of −113.12 J/g indicating slightly reduced crystallinity.50–52 The results show the absence of any
interac-tion between the drug and stabilizer PVA (Figure 6).
Particle morphology
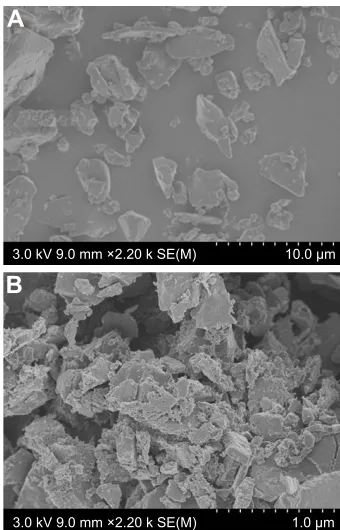
The surface morphology of the nanocrystals was analyzed by scanning electron microscopy (SEM) studies. SEM images of unmilled ACF and nanocrystals are shown in Figure 7. Unmilled ACF was observed to be discrete in nature with smooth surface and crystalline in appearance. The surface texture of ACF nanocrystal particles was rough with much abrasiveness and disorderliness compared with unmilled ACF. The SEM results resemble those observed in some
studies, which showed that milling altered the surface rough-ness and shape of particles.38
saturation solubility studies of
nanocrystal formulation
The saturation solubility of the pure drug and nanocrystals of ACF is shown in Figure 8. The figure indicates that there was a profound increase in the solubility of nanocrystals compared with that of pure drug. The solubility of pure ACF and nanocrystals of ACF in water was found to be 0.02±0.0013 and 0.0399±0.0024 mg/mL, respectively. In 0.1 N HCl, the solubility was found to be 0.0344±0.0026 mg/mL for pure ACF and 0.0569±0.003 mg/mL for ACF nanocrystals. This increase in solubility could be attributed to the reduction in
Figure 4 Design space of acF nanocrystals comprised of the overlap region of ranges for the different critical quality attributes.
Abbreviations: acF, aceclofenac; PDI, polydispersity index.
%FRQFRIVWDELOL]HU
2YHUOD\SORW
&DPRXQWRIGUXJPJ 3DUWLFOHVL]H 2YHUOD\SORW
$VL]HRIWKHEDOOVPP
&DPRXQWRIGUXJPJ 3',
2YHUOD\SORW
%FRQFRIVWDELOL]HU
$VL]HRIWKHEDOOVPP
3',
2YHUOD\SORW
'WLPHK
&DPRXQWRIGUXJPJ 3',
3DUWLFOHVL]H 3DUWLFOHVL]H
3',
=HWDSRWHQWLDO ;
;
±
Table 5 comparative values for observed and predicted results
Responses CMAs and CPPs CQAs
A (mm) B (%) C (mg) D (h) Y1 (nm) Y2 Y3 (mV)
software-predicted results 5.0 0.25 200 4 489.6 0.103 −0.375
Obtained results 5.0 0.25 200 4 484.7±54.12 0.108±0.009 −0.380±0.045
error* (%) – – – – 1.00 −4.85 −1.33
Note: *error = (software predicted results − obtained results)/software predicted results ×100.
Abbreviations: cMas, critical material attributes; cPPs, critical process parameters; cQas, critical quality attributes.
International Journal of Nanomedicine downloaded from https://www.dovepress.com/ by 118.70.13.36 on 23-Aug-2020
Dovepress
Narayan et al
Figure 5 X-ray diffraction patterns for (A) pure unmilled acF and (B) acF nanocrystals.
Abbreviation: acF, aceclofenac. H
H H
7KHWDWKHWDGHJ
,QWHQVLW\FSV
&ROOHFWHGGDWD
$
H H H H H H
7KHWDWKHWDGHJ
,QWHQVLW\FSV
&ROOHFWHGGDWD
%
Figure 6 Differential scanning calorimetric (Dsc) thermograms for (A) unmilled acF (B) physical mixture of unmilled acF + PVa and (C) acF nanocrystals.
Abbreviations: acF, aceclofenac; Dsc, differential scanning calorimetric; PVa, polyvinyl alcohol.
'6&
P:
7HPSHUDWXUH°&
$
%
&
°& ±-J
°& ±-J °& ±-J
°& ±-J
°& ±-J
±
±
particle size, leading to increase in the surface area and thus improved solubility as per Ostwald–Freundlich equation.53
The increased wettability owing to the presence of surface coating of PVA around the hydrophobic surface of ACF nanocrystals could also be a possible reason for the improve-ment in the solubility.54
In vitro release studies
The in vitro drug release profile of ACF nanocrystals showed an improvement in the drug release at the end of 2 h, that is, 100.07%±1.38%, whereas the pure drug showed a release of around 47.66%±4.53% in 0.1 N HCl (Figure 9). This 2.19-fold increase in dissolution profile of the drug may be due to decrease in the particle size and high surface area, thus an improved dissolution of the drug as per Noyes– Whitney equation.14 This could be speculated to be due to the
decrease in diffusion layer thickness and hence an increase in concentration gradient, leading to increase in dissolution velocity. The high surface-to-volume ratio of nanoparticles also aids in the hydration and hence enhances the dissolution
velocity.21 Presence of layer of PVA around the nanocrystals
enhances the wettability of the poorly soluble drug and con-tributes to improved dissolution rate. The increased saturation solubility of the ACF nanocrystals also supports this high dissolution velocity of the nanocrystals.
Pharmacokinetic studies
Pharmacokinetic studies of the ACF nanocrystals in rats echoed similar results as that of in vitro studies. The plasma concentration-time profiles following single oral admin-istration (10 mg/kg) of ACF nanocrystals and pure ACF are depicted in Figure 10. The pharmacokinetic parameters are tabulated in Table 6. The results showed a significant increase in Cmax of the ACF nanocrystals compared with that of pure ACF showing good oral absorption. ACF nanocrys-tals demonstrated significant high AUC compared with that of pure drug showing higher bioavailability of drug from the formulation. The increase in both Cmax and AUC could be due to increased rate and extent of absorption of nanocrystals due to higher dissolution velocity. This suggests that the
International Journal of Nanomedicine downloaded from https://www.dovepress.com/ by 118.70.13.36 on 23-Aug-2020
Dovepress Nanocrystals of aceclofenac
Figure 7 scanning electron microscopy images of (A) unmilled acF (B) acF nanocrystals.
Abbreviation: acF, aceclofenac.
N9PPîN6(0 P
$
N9PPîN6(0 P
%
Figure 8 saturation solubility studies of pure acF and acF nanocrystals.
Abbreviation: acF, aceclofenac.
6DWXUDWLRQVROXELOLW\PJP/
:DWHU 1+&O 3XUH$&)
$&)QDQRFU\VWDOV
Figure 9 In vitrorelease profile of pure ACF and ACF nanocrystals.
Abbreviation: acF, aceclofenac.
7LPHPLQ
FXPXODWLYHGUXJ
UHOHDVH
3XUH$&) $&)QDQRFU\VWDOV
ACF nanocrystals can be used to reduce the dose of ACF. There was no significat difference in mean residential time, elimination half life (t1/2), and elimination rate constant (Ke) between the groups. Student’s t-test results indicated that there was a significant statistical difference (P,0.05) in the Cmax and AUC of the developed nanocrystals when compared with that of pure ACF.
stability studies
Particle size and solubility were determined to ensure that the characteristics of the formulation remain unchanged through-out its shelf life. No significant difference was observed in the samples. The particle size at the end of 90 days was found to 512.5±49.38 nm. The solubility of ACF nanocrystals in water and 0.1 N HCl was found to be 0.0302±0.0029 mg/mL and 0.0528±0.0057 mg/mL, respectively. The results revealed that the ACF nanocrystals were found to be stable under the specified conditions throughout their shelf life.
Conclusion
The present study illustrates the efficiency of particle size reduction in improving the solubility and thus the bioavail-ability of ACF by top-down approach. The CQAs and
Figure 10 Plasma concentration-time profile for pure ACF and ACF nanocrystals.
Abbreviation: acF, aceclofenac.
7LPHK
3ODVPDFRQFHQWUDWLRQ
JP/
3XUH$&) $&)QDQRFU\VWDOV
Table 6 Pharmacokinetic parameters for pure acF and acF nanocrystals
Parameters Pure ACF ACF nanocrystals
cmax (µg/ml) 1.96±0.17 3.75±0.28a
Tmax (h) 1.00±0.25 1.00±0.25
t1/2 (h) 3.42±0.15 3.27±0.10
aUc0–12 (µg⋅h/ml) 5.8±0.87 9.0±1.00a
MrT (h) 4.30±0.95 4.00±0.69
Ke (h−1) 0.202±0.001 0.267±0.0005
Notes: all values are expressed as mean ± sD, n=3; asignificantly different at 95% confidence interval.
Abbreviations: acF, aceclofenac; aUc, area under the curve; cmax, maximum
plasma concentration; Ke, elimination rate constant; MrT, mean residential time;
Tmax, time for maximum plasma concentration; t1/2, elimination half life.
International Journal of Nanomedicine downloaded from https://www.dovepress.com/ by 118.70.13.36 on 23-Aug-2020
Dovepress
Narayan et al
CPPs were identified and the formulation was optimized at 3 levels and 4 factors using BBD. The optimum formula-tion was the one containing 0.25% PVA and 200 mg of ACF which was milled for 4 h using balls of size 5 mm to obtain minimum particle size of 484.7±54.12 nm and PDI of 0.108±0.009. The low percentage error confirms the agree-ment between the theoretical and practical data. Further, the ACF nanocrystals showed an improved solubility in water and 0.1 N HCl, which was supported by the increased disso-lution velocity in in vitro release studies. The increase in the solubility of ACF was mainly due to particle size reduction rather than amorphization as the ACF nanocrystals showed crystalline nature evident from the solid-state characteriza-tion results. The pharmacokinetic data demonstrated an improved bioavailability and absorption of ACF, which sup-ported the results obtained by in vitro studies. On the basis of the results obtained, it can be concluded that formulation of ACF nanocrystals by ball milling combined with QbD approach can help to reduce the dose, cost and ensure quality and safety of the product. The developed ACF nanocrystals could be exploited as a possible alternative to its currently available dosage forms.
Acknowledgments
The authors are thankful to Manipal University for providing the infrastructure facilities and Department of Biotechnology, New Delhi, India, for providing the financial support by a grant (BT/Bio-CARe/03/9943/2013–14), for carrying out this research work.
Disclosure
The authors report no conflicts of interest in this work.
References
1. Ku MS, Dulin W. A biopharmaceutical classification-based Right-First-Time formulation approach to reduce human pharmacokinetic variability and project cycle time from First-In-Human to clinical Proof-Of-Concept.
Pharm Dev Technol. 2012;17(3):285–302.
2. Kalepu S, Nekkanti V. Insoluble drug delivery strategies: review of recent advances and business prospects. Acta Pharm Sin B. 2015;5(5): 442–453.
3. Meka AK, Pola S, Tupally KR, Abbaraju PL. Development, evalua-tion and characterizaevalua-tion of surface solid dispersion for solubility and dissolution enhancement of Irbesartan. Int J Drug Dev Res. 2012;4(1): 263–273.
4. Thirupathaiah A, Sunder RS. Formulation and evaluation of simvastatin solid dispersions by solvent evaporation method. Res J Pharm Biol Chem. 2016;7(4):2516–2528.
5. Sanphui P, Devi VK, Clara D, Malviya N, Ganguly S, Desiraju GR. Cocrystals of hydrochlorothiazide: Solubility and diffusion/permeability enhancements through drug-coformer interactions. Mol Pharm. 2015; 12(5):1615–1622.
6. Good DJ, Naír RH. Solubility advantage of pharmaceutical cocrystals.
Cryst Growth Des. 2009;9(5):2252–2264.
7. Darekar T, Aithal KS, Shirodkar R, Kumar L, Attari Z, Lewis S. Characterization and in vivo evaluation of lacidipine inclusion com-plexes with β-cyclodextrin and its derivatives. J Incl Phenom Macrocycl
Chem. 2016;84(3–4):225–235.
8. Jafar M, Ali S, Ghonaim HM. Improved solubility and dissolution rate of ketoprofen by beta cyclodextrin ternary complexes incorporating hydrophilic polymers. Int J Drug Deliv Technol. 2017;7(1):45–51. 9. Blagden N, de Matas M, Gavan PT, York P. Crystal engineering of
active pharmaceutical ingredients to improve solubility and dissolution rates. Adv Drug Deliv Rev. 2007;59(7):617–630.
10. Li HY, Pan TT, Cui Y, et al. Improved oral bioavailability of poorly water-soluble glimepiride by utilizing microemulsion technique. Int J
Nanomedicine. 2016;11:3777–3788.
11. Narayan R, Attari Z, Sreenivasa Reddy M, Koteshwara KB. Enhanced solubility and bioavailability of pioglitazone nanosuspension. Adv Sci
Lett. 2016;22(4):987–994.
12. Kamble RN, Mehta PP, Kumar A. Efavirenz self-nano-emulsifying drug delivery system: in vitro and in vivo evaluation. AAPS
Pharm-SciTech. 2016;17(5):1240–1247.
13. Bandi S, Sanka K, Bakshi V. Enhanced oral delivery of risperidone through a novel self-nanoemulsifying powder (SNEP) formulations: in-vitro and ex-vivo assessment. J Microencapsul. 2016;33(6): 544–553.
14. Tan Y, Yang Z, Peng X, et al. A novel bottom-up process to produce nanoparticles containing protein and peptide for suspension in hydro-fluoroalkane propellants. Int J Pharm. 2011;413(1–2):167–173. 15. Junyaprasert VB, Morakul B. Nanocrystals for enhancement of oral
bioavailability of poorly water-soluble drugs. Asian J Pharm Sci. 2015; 10(1):13–23.
16. Ye X, Patil H, Feng X, et al. Conjugation of hot-melt extrusion with high-pressure homogenization: a novel method of continu-ously preparing nanocrystal solid dispersions. AAPS PharmSciTech. 2016;17(1):78–88.
17. Raghava Srivalli KM, Mishra B. Drug nanocrystals: a way toward scale-up. Saudi Pharm J. 2016;24(4):386–404.
18. Möschwitzer JP. Drug nanocrystals in the commercial pharmaceutical development process. Int J Pharm. 2013;453(1):142–156.
19. Junghanns JU, Müller RH. Nanocrystal technology, drug delivery and clinical applications. Intl J Nanomedicine. 2008;3(3):295–309. 20. Van Eerdenbrugh B, Vermant J, Martens JA, et al. A screening study
of surface stabilization during the production of drug nanocrystals.
J Pharm Sci. 2009;98(6):2091–2103.
21. Elsayed I, Abdelbary AA, Elshafeey AH. Nanosizing of a poorly soluble drug: technique optimization, factorial analysis, and pharma-cokinetic study in healthy human volunteers. Int J Nanomedicine. 2014; 9(1):2943–2953.
22. Van Eerdenbrugh B, Van den Mooter G, Augustijns P. Top-down production of drug nanocrystals: nanosuspension stabilization, minia-turization and transformation into solid products. Int J Pharm. 2008; 364(1):64–75.
23. Patravale VB, Date AA, Kulkarni RM. Nanosuspensions: a promising drug delivery strategy. J Pharm Pharmacol. 2004;56(7):827–840. 24. Akkus Arslan S, Tirnaksiz F. A nonsteroidal anti-inflammatory drug:
Aceclofenac. FABAD J Pharm Sci. 2010;35:105–118.
25. Maulvi FA, Dalwadi SJ, Thakkar VT, Soni TG, Gohel MC, Gandhi TR. Improvement of dissolution rate of aceclofenac by solid dispersion technique. Powder Tech. 2011;207(1–3):47–54.
26. Dua K, Pabreja K, Ramana MV. Enhancement of dissolution behavior of aceclofenac by complexation with β-cyclodextrin-choline dichloride coprecipitate. J Disp Sci Tech. 2011;32(10):1477–1484.
27. Ranpise NS, Kulkarni NS, Mair PD, Ranade AN. Improvement of water solubility and in vitro dissolution rate of aceclofenac by complexation with β-cyclodextrin and hydroxypropyl-β-cyclodextrin. Pharm Dev Tech. 2010;15(1):64–70.
28. Mutalik S, Anju P, Manoj K, Usha AN. Enhancement of dissolution rate and bioavailability of aceclofenac: A chitosan-based solvent change approach. Int J Pharm. 2008;350(1–2):279–290.
International Journal of Nanomedicine downloaded from https://www.dovepress.com/ by 118.70.13.36 on 23-Aug-2020
International Journal of Nanomedicine
Publish your work in this journal
Submit your manuscript here: http://www.dovepress.com/international-journal-of-nanomedicine-journal
The International Journal of Nanomedicine is an international, peer-reviewed journal focusing on the application of nanotechnology in diagnostics, therapeutics, and drug delivery systems throughout the biomedical field. This journal is indexed on PubMed Central, MedLine, CAS, SciSearch®, Current Contents®/Clinical Medicine,
Journal Citation Reports/Science Edition, EMBase, Scopus and the Elsevier Bibliographic databases. The manuscript management system is completely online and includes a very quick and fair peer-review system, which is all easy to use. Visit http://www.dovepress.com/ testimonials.php to read real quotes from published authors.
Dovepress
Dove
press
Nanocrystals of aceclofenac
29. Park JJ, Meghani N, Choi JS, Lee BJ. Development and evaluation of decorated aceclofenac nanocrystals. Colloids Surf B Biointerfaces. 2016;143:206–212.
30. Pattnaik S, Swain K, Manaswini P, et al. Fabrication of aceclofenac nanocrystals for improved dissolution: Process optimization and physicochemical characterization. J Drug Deliv Sci Tech. 2015;29: 199–209.
31. Patnaik S, Aditha SK, Rattan T, Kamisetti V. Aceclofenac-soluplus nanocomposites for increased bioavailability. Soft Nanosci Letters. 2015; 5(2):13–20.
32. Xu X, Khan MA, Burgess DJ. A quality by design (QbD) case study on liposomes containing hydrophilic API: I. Formulation, processing design and risk assessment. Int J Pharm. 2011;419(1–2):52–59. 33. Patravale VB, Disouza JI, Rustomjee M. Pharmaceutical Product
Development: Insights into Pharmaceutical Processes, Management and Regulatory Affairs. New York, NY: CRC Press, Taylor & Francis
Group; 2016.
34. Vo AQ, Feng X, Pimparade M, et al. Dual-mechanism gastroreten-tive drug delivery system loaded with an amorphous solid dispersion prepared by hot-melt extrusion. Eur J Pharm Sci. 2017;102:71–84. 35. Vo AQ, Feng X, Morott JT, et al. A novel floating controlled release
drug delivery system prepared by hot-melt extrusion. Eur J Pharm
Biopharm. 2016;98:108–121.
36. Masoumi HRF, Basri M, Samiun WS, Izadiyan Z, Lim CJ. Enhancement of encapsulation efficiency of nanoemulsion-containing aripiprazole for the treatment of schizophrenia using mixture experimental design.
Int J Nanomedicine. 2015;10:6469–6471.
37. Usha AN, Mutalik S, Reddy MS, Ranjith AK, Kushtagi P, Udupa N. Preparation and, in vitro, preclinical and clinical studies of aceclofenac spherical agglomerates. Eur J Pharm Biopharm. 2008;70(2): 674–683.
38. Loh ZH, Samanta AK, Sia Heng PW. Overview of milling techniques for improving the solubility of poorly water-soluble drugs. Asian J
Pharml Sci. 2014;10(4):255–274.
39. Ramasamy T, Tran TH, Choi JY, et al. Layer-by-layer coated lipid– polymer hybrid nanoparticles designedfor use in anticancer drug delivery. Carbohydr Polym. 2014;102:653–661.
40. Ramasamy T, Ruttala HB, Chitrapriya N, et al. Engineering of cell microenvironment-responsive polypeptide nanovehicle co-encapsulating a synergistic combination of small molecules for effective chemotherapy in solid tumors. Acta Biomaterialia. 2017;48:131–143.
41. Ramasamy T, Ruttala HB, Kanu BG, et al. Smart chemistry-based nanosized drug delivery systems for systemic applications: a compre-hensive review. J Control Rel. Epub 2017 May 1.
42. Li JK, Wang N, Wu XS. Poly(vinyl alcohol) nanoparticles prepared by freezing–thawing process for protein/peptide drug delivery. J Control
Release. 1998;56(1–3):117–126.
43. Narayanan K, Subrahmanyam VM, Venkata Rao J. A fractional facto-rial design to study the effect of process variables on the preparation of hyaluronidase loaded PLGA nanoparticles. Enzyme Res. 2014;2014: 162962.
44. Sjöberg M, Bergström L, Larsson A, Sjöström E. The effect of polymer and surfactant adsorption on the colloidal stability and rheology of kaolin dispersions. Colloids Surf A Physicochem Eng Aspects. 1999; 159(1):197–208.
45. Rachmawati H, Rahma A, Al Shaal L, Müller RH, Keck CM. Destabi-lization mechanism of ionic surfactant on curcumin nanocrystal against electrolytes. Scientia Pharmaceutica. 2016;84(4):685–693.
46. Tefas LR, Tomuţă I, Achim M, Vlase L. Development and optimization of quercetin-loaded plga nanoparticles by experimental design. Clujul
Medical. 2015;88(2):214–223.
47. Sharma N, Madan P, Lin S. Effect of process and formulation variables on the preparation of parenteral paclitaxel-loaded biodegradable poly-meric nanoparticles: a co-surfactant study. Asian J Pharm Sci. 2016; 11(3):404–416.
48. Shin H, Lee S, Suk Jung H, Kim JB. Effect of ball size and powder loading on the milling efficiency of a laboratory-scale wet ball mill.
Ceramics Int. 2013;39(8):8963–8968.
49. Peltonen L, Hirvonen J. Pharmaceutical nanocrystals by nanomilling: Critical process parameters, particle fracturing and stabilization methods. J Pharm Pharmacol. 2010;62(11):1569–1579.
50. Paradkar AR, Pawar AP, Chordiya JK, Patil VB, Ketkar AR. Spherical crystallization of celecoxib. Drug Dev Ind Pharm. 2002;28(10): 1213–1220.
51. Cirri M, Maestrelli F, Furlanetto S, Mura P. Solid-state characteriza-tion of glyburide-cyclodextrin co-ground products. J Thermal Analysis
Calorimetry. 2004;77(2):413–422.
52. Corti G, Maestrelli F, Cirri M, Mura P, Zerrouk N. Dissolution and per-meation properties of naproxen from solid-state systems with chitosan.
Drug Deliv. 2008;15(5):303–312.
53. Khadka P, Ro J, Kim H, et al. Pharmaceutical particle technologies: an approach to improve drug solubility, dissolution and bioavailability.
Asian J Pharm Sci. 2014;9(6):304–316.
54. Jain S, Sharma JM, Jain AK, Mahajan RR. Surface-stabilized lopinavir nanoparticles enhance oral bioavailability without coadministration of ritonavir. Nanomedicine (Lond). 2013;8(10):1639–1655.
International Journal of Nanomedicine downloaded from https://www.dovepress.com/ by 118.70.13.36 on 23-Aug-2020