self-modulation of a 400 GeV proton bunch
P. Muggli1, E. Adli2, A. Alexandrova3, L. Amorim4, R.
Apsimon5, R. Baartman6, A.-M. Bachmann1, M. Barros
Marin7, F. Batsch1, J. Bauche7, V. K. Berglyd Olsen2, M.
Bernardini 7, R. Bingham8, B. Biskup7, A. Boccardi7, T.
Bogey7, T. Bohl 7, C. Bracco7, F. Braunmuller1, S. Burger7, P.
N. Burrows9, G. Burt5, S. Bustamante7, B. Buttenschn10, A,
Butterworth7, A. Caldwell1, M. Cascella11, L. Ceurvorst9, E.
Chevallay7, H. Damerau7, L. Deacon11, A. Dexter5, P. Dirksen6,
S. Doebert7, E. Effinger7, V. Fedosseev7, E. Feldbaumer7, T.
Feniet7, R. Fiorito3, R. Fonseca4, F. Friebel7, S. Gessner7, A.
Goldblatt7, A. A. Gorn12, O. Grulke10, E. Gschwendtner7, A.
Guerrero7, J. Hansen7, C. Hessler7, W. Hofle 7, J. Holloway9,
M. H¨uther1, L. Jensen7, S. Jolly10, M. Kasim9, F. Keeble10, A.
Lasheen7, T. Lefevre7, G. LeGodec7, M. Levy9, Y. Li13, S. Liu6,
N. Lopes4 ,K. V. Lotov12, M. Martyanov1, S. Mazzoni7, D.
Medina Godoy7, O. Mete5, V. A. Minakov12, R. Mompo7, J.
Moody1, M. Moreira4, N. Moschuering14, C. Mutin7, P.
Norreys9,8, E. ¨Oz1, E. Ozturk7, A. Pardons7, C. Pasquino7, K.
Pepitone7, A. Petrenko7, G. Plyushchev7,1, A. Pukhov15, N.
Ratan9, K. Rieger1, H. Ruhl14, J. Sadler9, F. Salveter7, N.
Savard1, J. Schmidt7, G. Schneider7, I. A. Shalimova 16, E.
Shaposhnikova 7, P. Sherwood11, L. Silva4, L. Soby7, A. P.
Sosedkin12, R. I. Spitsyn12, K. Szczurek7, R. Trines8, P. V.
Tuev12, M. Turner7, V. Verzilov6, J. Vieira4, M. Vincente
Romero7, H. Vincke7, C. P. Welsch3, B. Williamson13, M.
Wing11, G. Xia13
1Max Planck Institute for Physics, M¨unchen, Germany 2University of Oslo, Oslo 0316, Norway
3University of Liverpool, Liverpool L69 7ZE, UK
4GoLP/Instituto de Plasmas e Fuso Nuclear, Instituto Superior Tcnico, Universidade
de Lisboa, Lisbon, Portugal
5Lancaster University, Lancaster LA1 4YR, UK
6TRIUMF, 4004 Wesbrook Mall, Vancouver V6T2A3, Canada 7CERN, Geneva, Switzerland
8STFC Rutherford Appleton Laboratory, Didcot OX11 0QX, UK 9University of Oxford, Oxford OX1 2JD, UK
Germany
11UCL, Gower Street, London WC1E 6BT, UK
12Budker Institute of Nuclear Physics SB RAS, Novosibirsk 630090, Russia 13University of Manchester, Manchester M13 9PL, UK
14Ludwig-Maximilians-Universitt, Munich 80539, Germany
15Heinrich-Heine-University of D¨usseldorf, Moorenstrasse 5, D¨usseldorf 40225,
Germany
16Institute of Computational Mathematics and Mathematical Geophysics SB RAS,
Novosibirsk 630090, Russia
E-mail: [email protected]
July 2017
Abstract. AWAKE is a proton-driven plasma wakefield acceleration experiment. We show that the experimental setup briefly described here is ready for systematic study of the seeded self-modulation of the 400 GeV proton bunch in the 10 m-long rubidium plasma with density adjustable from 1 to 10×1014cm−3. We show that the short
laser pulse used for ionization of the rubidium vapor propagates all the way along the column, suggesting full ionization of the vapor. We show that ionization occurs along the proton bunch, at the laser time and that the plasma that follows affects the proton bunch.
1. Introduction
Plasma-based accelerators (PBAs) hold the promise of accelerating particles with a higher gradient than radio-frequency accelerators. A PBA can be driven by an intense laser pulse [1] or relativistic particle bunch [2]. A PBA acts as an energy transformer, extracting energy from the driver, transferring it to the the wakefields sustained by the plasma electrons, and then to the witness bunch. The energy carried by the drive bunch is the maximum energy that can be transferred to the witness bunch. Relativistic proton bunches produced by synchrotrons such as the SPS, LHC, Tevatron, RHIC, etc. carry many kilojoules of energy. Proton bunches are therefore interesting drivers to accelerate particles to very high energies in a single plasma.
Plasma wakefields are fields sustained by an electron density perturbation in an otherwise neutral plasma. In one dimension, plasma wakefields are sustained by an electro-static relativistic electron or Langmuir wave. The driving of large amplitude wakefields requires a relativistic particle bunch (i.e., with velocity vb ∼= c), or a laser
pulse, with transverse and longitudinal dimensions on the order of the cold plasma skin depth c/ωpe. This is usually expressed as kpeσr ≤ 1 and kpeσz ≤ 1. Here kpe = ωpe/c
is the wavenumber and ωpe =
p
nee2/0me is the angular frequency of a relativistic
plasma wave sustaining the wakefields in a plasma with electron densityne. The bunch
or pulse rms transverse and longitudinal sizes are σr and σz, respectively. Focusing
thereby limiting the charge of the particle bunch or the energy of the laser pulse, that is limiting the energy they carry. Short particle bunches and laser pulses (<1 ps or 300 ps) usually carry an energy lower than 100 J.
The CERN accelerator complex provides relativistic proton (p+) bunches that carry
20 kJ (Super Proton Synchrotron, SPS, 3×10¹¹p+/bunch, 400 GeV/p+, γ
0 ∼=427) to
112 kJ (Large Hadron Collider, LHC, 1011p+/bunch, 7 TeV/p+, γ
0 ∼=7500). However,
these bunches are long, with σz=10-12 cm. AWAKE aims to use these bunches to drive
wakefields in plasmas. In the following we use the AWAKE baseline parameters given in Table 1, unless otherwise specified.
The longitudinal electric field sustained by plasma wakefields can reach an amplitude on the order of the cold plasma wave-breaking field [3]: EW B =mecωpe/e∼=
p
ne[1014cm−3] GV/m. When adjusting the plasma density to satisfy kpeσz ∼= 1, the
estimate for the maximum longitudinal electric field can be expressed asEW B = mec 2 e
1 σz. Withσz=12 cm one obtains EW B ∼= 27MV/m in a plasma with ne ∼= 8×1010cm−3 [4].
Producing a high-energy p+ bunch with length shorter than 1mm to reach
large wakefield amplitudes (∼1 GV/m as suggested in [5]) is very challenging. The usual magnetic compression methods would require a large additional energy spread (∆E/E ∼= 1%) and a large magnetic chicane or drift space (km length) [6].
ReachingEW B >1 GV/m requiresne>1014cm−3 andσz <5mm. In order to avoid
transverse breaking up of the bunch because of the current filamentation instability (CFI) [7], the radius of the plasma, and thus its density, must be such thatkpeσr .1 [8].
In AWAKE the p+/bunch can be focused to a rms radius σ
r = 200µm, which requires
a plasma density of ne ≤ 7×1014cm−3 for kpeσr ≤ 1. In this case the bunch is many
wakefields periods long and ineffective at driving wakefields.
A bunch withσz λpe = 2π/kpe drives low amplitude wakefields with multiple λpe
periods, as was demonstrated in [9]. These wakefields have accelerating and decelerating longitudinal fields (Ez). When the bunch particles have a relativistic factor γ >1 their
periodic energy gain and loss from the wakefields can lead to longitudinal bunching at the scale ofλpeonly over large distances. In the AWAKE case the difference in travel distance
between two particles of similar energy γ0, one gaining and one losing energy from the
wakefields and thus separated by 2∆γ γ0 is given by ∆L∼= γ12 0
2∆γ
γ Lλpe. Therefore
longitudinal bunching from periodic energy gain/loss from the wakefields cannot be used to modulate the p+ bunch charge or current.
At the plasma entrance, the transverse fields (Er−vbBθ ∼=Er−cBθ) are focusing
over most of the drive bunch length. In the transverse dimension, the particles have non-relativistic velocities whose rms value can be evaluated at a beam waist from the bunch normalized emittance N as: σv⊥/c ∼= N/(γσr) and thus σv⊥/c 1 when N 1. Therefore, even the weak transverse wakefields driven by the long bunch
process [11]. After saturation, the self-modulation has transformed the long bunch into a train of bunches, each shorter than λpe and with period λpe. The formation of the
bunch train is thus due purely to the transverse action of the wakefields. Assuming that the kpeσr . 1 condition is satisfied, the individual bunches satisfy kpeσz ≤ 1 and the
train can thus resonantly and effectively drive the wakefields to large amplitude. Counting on the noise in the bunch and plasma as sources to initiate the modulation process would mean that the phase of the wakefields along the Gaussianp+bunch would
be random and vary from event to event. This would make deterministic injection of electrons in the focusing and accelerating phase of the wakefields impossible. Therefore the self-modulation process must be seeded. Seeding also reduces the plasma length needed for the modulation process to saturate. Seeding methods include: a short laser or particle bunch preceding the long bunch and driving wakefields; a short particle bunch of charge opposite that of the drive bunch traveling within the drive bunch; a sharp ”cut” in the front of the drive bunch distribution; a relativistic ionization front, created for example by a laser pulse traveling within the drive bunch; pre-modulation of the drive bunch. Seeding the wakefields at a level exceeding the noise level means that the seeded self-modulation (SSM) amplifies the initial wakefields rather than develops from random noise.
2. The AWAKE Experiment
The AWAKE experiment at CERN [12] aims to study the driving of wakefields using
p+ bunches and to demonstrate the acceleration of electrons externally injected in these
wakefields. Table 1 lists the general experimental parameters.
In the following we describe the main elements of the AWAKE experiment, as well as the diagnostics that were implemented to characterize the modulated p+ bunch
exiting the plasma.
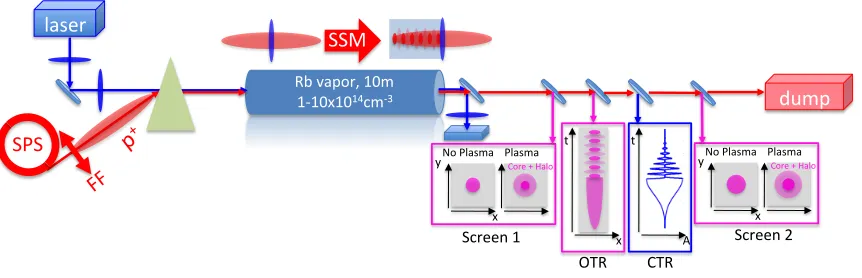
Figure 1 shows a schematic of the AWAKE experiment. The p+ bunch is extracted
from the SPS with the parameters in Table 1. It is put on the trajectory of the laser pulse by a bending dipole magnet that is part of a magnetic dogleg. The final focus system focuses the bunch near the entrance of the vapor source. The short laser pulse propagates within the p+ bunch to form the plasma by ionization of the rubidium (Rb)
vapor, thereby seeding the SSM (Fig. 2 and see below). The SSM develops along the plasma. We measure the effect of the SSM on the p+ bunch downstream from the
plasma.
The development of the SSM and the growth of the wakefields lead to two observable effects on the p+ bunch: defocusing of some of the protons and modulation of the p+
bunch density, reaching zero near the bunch axis in case of SSM saturation and large amplitude wakefields. Bunch diagnostics include: two screens to observe p+ defocused
Table 1. Beam, vapor, plasma and laser parameters of the AWAKE experiment.
Parameter Symbol Value Range Unit
p+ Bunch -
-Energy W0 400 - GeV
Relativistic Factor γ0 427 -
-Population N 3×10¹¹ (1
−3)×1011 p+ /bunch
Length σz 12 - cm
Focused Size σr 200 - µm
Normalized Emittance N 3.5×10⁻⁶ - m-rad
β-function at Waist β0= γ0σ2r
N 5 - m
Relative Energy Spread ∆W0/W0 0.03% -
-Rubidium Vapor Rb
-Density nRb 7×10¹⁴ (1−10)×1014 cm−3
Column Length LRb 10 - m
Column Radius rRb 2 - cm
Fiber/Ti:Sapphire Laser
Central Wavelength λ0 780 - nm
Bandwidth ∆λ0 ±5 - nm
Pulse Length τ0 120 - fs
Max. Compressed Energy Emax 450 - mJ
Focused Size rl 1 - mm
Rayleigh Length Zr 5 - m
Plasma
-Electron Density ne 7×10¹⁴ (1−10)×1014 cm−3
Electron Plasma Frequency fpe 237 90-284 GHz
Electron Plasma Wavelength λpe 1.3 3.3-1 mm
Length Lp 10 - m
Radius rp >1 - mm
radiation emitted by the p+ bunch train.
!"
#"
$%&"
!"
'"
(%&"
)"
#" *+",-./0." ,-./0."
(+12"3"4.-+"
561227"8"
)"
#" *+",-./0." ,-./0."
(+12"3"4.-+"
561227"9"
&:";.<+1="8>0" 8?8>#8>8@60?A" -./21"
55B"
5,5"
CD0<"
[image:5.612.82.513.520.659.2]!"#
$"#
[image:6.612.175.416.86.317.2]%"#
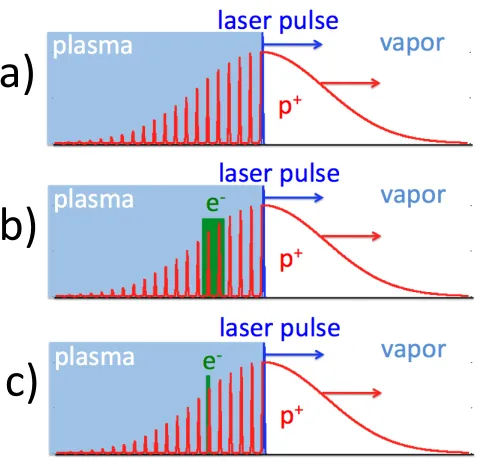
Figure 2. The three schemes of the AWAKE experiment: a)p+bunch, Rb vapor and
ionizing laser pulse to study the SSM; b) a long electron bunch (σz = (1−2)λpe) is
injected and a fraction of the electrons is captured and accelerated; c) a short electron bunch (σz λpe) is injected and accelerated with a narrow energy spread while
preserving its initial emittance. The ratioσz/λpe is much smaller than in AWAKE.
2.1. Plasma Source
The plasma source consists of a Rb vapor source and of a laser for ionization of the vapor.
2.1.1. Requirements The source must fulfill a number of requirements.
The plasma electron density must be adjustable in the (1−10)×1014cm−3 range.
Numerical simulations show that at these densities the SSM takes a few meters to develop from its seed value. The plasma length must therefore be in the 10 m range.
The cold plasma skin depth is smaller than ∼530µm. The plasma radius must therefore be of the order of ∼1 mm.
The SSM can develop in plasmas with large density gradients [13]. However, the injection and acceleration of an initially low energy electron bunch (∼= 15M eV) are very sensitive to plasma density variations. Numerical simulations show that, with the seed at the peak of the p+ bunch, the wakefields amplitude typically peaks approximately
σz after the ionization seeding location [11]. That is, the location for injection of
electrons along the bunch corresponds to ∼ 100λpe. Therefore, if the plasma density
were to change by a relative amount δne/ne0 with δne ne0, the plasma wavelength
would change by a relative amount δλpe/λpe = 12δne/ne0. At the location of electron
and focusing phase of the wakefields, corresponding to a λpe/4 extent according to
linear plasma wakefield theory, translates into a relative density uniformity estimate of δne/ne0 < (1/4)(1/Nλpe) all along the plasma. This leads to δne/ne0 < 0.25% for Nλpe = 100.
At the same time, assuming the electrons are injected along thep+bunch trajectory,
they must cross the plasma density ramps at the entrance and exit of the plasma. The electrons have a low energy at the plasma entrance and are sensitive to the transverse fields driven by the yet unmodulatedp+ bunch. Linear theory indicates that these fields
are globally focusing for particles with the same sign as the drive bunch, i.e., defocusing for the electrons in this case. The length of the plasma density ramp must therefore be kept as short as possible, shorter than 10 cm according to numerical simulations [14]. The energy of the accelerated electrons exiting the plasma is much larger than their injection energy. They are thus much less sensitive to the defocusing effect of the wakefields in the exit ramp. However, the length of both ramps is similar.
The plasma density must also be stable over time.
2.1.2. Rubidium Vapor Source The (neutral) vapor density of the Rb source [15] developed for AWAKE (see Fig. 3) satisfies the requirements outlined in the previous paragraph [16]. The source meets the density uniformity requirement by imposing with a heat exchanger a very uniform temperature (δT /T < 0.25%) and assuming no vapor flow along the 10 m. The heat exchanger circulates an inert heat carrying fluid (GaldenR HT 270) in a 70 mm tube surrounding the 40 mm vacuum tube containing the
Rb vapor. Measurements show a temperature uniformity better that 0.5 K around 500 K (δT /T <0.1%), near the temperature necessary to reach the highest density expected in AWAKE. The AWAKE density range is obtained at temperature between 150 and 230◦C.
Letting the Rb vapor expand in a vacuum volume with its walls maintained below the Rb condensation temperature of 39.48◦C leads to a density ramp scale length on the
order of the diameter of the aperture through which the vapor expands. The diameter of the aperture at the entrance and exit of the vapor source is 1 cm.
Two reservoirs located near the ends of the source evaporate the Rb. After filling the source volume the vapor flows from each reservoir to its closest aperture, with a flow path in the source of only a few centimeters. White light interferometry near both ends of the source, where there is no flow, yields the Rb density with a relative accuracy of better than 0.2% [17].
The vapor source includes ”shutters” that are inserted in the along the beam path in the expansion volumes and opened only for ≈ 1s for each p+ bunch event. These
shutters collect the Rb vapor and decrease the amount of Rb condensing along the beam line vacuum elements upstream and downstream of the vapor source ends.
Rb Sources
Viewports Aperture
10m
Expansion Volume
Laser
p+, e-‐
10m
Laser
[image:8.612.148.534.102.428.2]p+, e-‐
Figure 3. Top: schematic of the Rb vapor source with the hot regions (Rb reservoirs, heat exchanger) in red-orange colors and the cold regions in blue color (expansion volume) [15]. Bottom: picture of the actual source in the AWAKE experiment.
density: ne =nRb.
2.1.3. Laser Ionization Rubidium has a low ionization potential for its first electron (4.177 eV) and is thus easier to ionize than elements that are in gaseous phase at room temperature (e.g., Ar, He, etc.). The appearance intensity for ionization of a Rb atom is on the order of 1.7×10¹²Wcm−2 [18]. The ionization potential for the second Rb
electron is 27.28 eV, which requires an approximately ∼455 times higher intensity to ionize. We expect no secondary ionization with the laser intensities available at AWAKE (<1.2×10¹⁴W cm−2). Rubidium has a large atomic mass (Z=85, 87 for the two isotopes
present in ∼72% and ∼28% fractions in natural Rb), which contributes to minimizing the possible deleterious effects of plasma ions motion [19].
A simple estimate including the energy necessary for ionizing a tube of Rb vapor 10 m-long and 1 mm in radius (volume ∼8 cm3) with a density of 1015cm3 (∼ 8×10¹⁵
∼70 mJ per laser pulse is necessary.
The laser system consists of an erbium-doped fiber oscillator, frequency doubled to seed a Ti:Sapphire chirp-pulse amplification chain. The system produces pulses with characteristics given in Table 1. They are ∼120 fs-long, carry up to 450 mJ and are focused to a peak intensity of ∼ 1.2×10¹⁴Wcm−2 with a spot with radius 1 mm and
propagate with a Rayleigh length of ∼5m. The laser is operated at 10 Hz to maintain optimal thermal characteristics and stability of the amplification chain. However, the last amplifier is pumped with a few microseconds delay with respect to the laser pulse, except when in synchronization with the p+ bunch, i.e., once every ∼30 s. The 10 Hz
repetition rate produces only ∼10 mJ, which spares the optics and the vapor source components.
The focused intensity exceeds the appearance intensity for the ionization of the first Rb electron. However, the laser spectrum overlaps the D2 optical transition of Rb at 780.2 nm. Since this transition originates from the atom ground state, absorption and anomalous dispersion can strongly affect the laser pulse propagation, even in the low density vapor. At very low intensity, only a very small Rb vapor density-length (nRb = 6×1014cm−3 over 3.5 cm) product is sufficient to stretch the short laser pulse
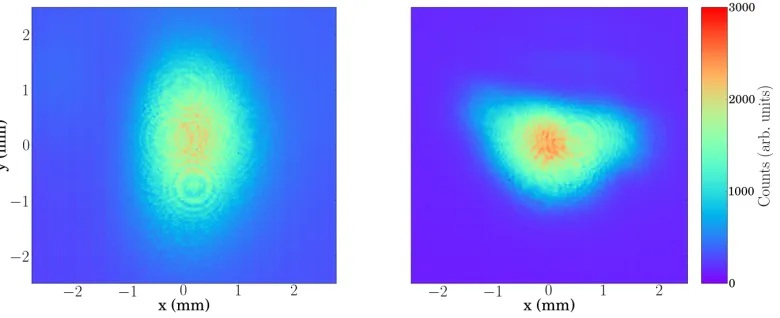
by a factor of more than five and thereby reduce its intensity proportionally [20]. At high intensity, the front of the laser pulse may stretch in the vapor. However, when the pulse intensity exceeds the ionization threshold, the remainder of the pulse can propagate along the plasma because the plasma is a very weakly dispersive medium over the laser pulse bandwidth. Measurements of the transverse laser pulse profile (see Fig. 4) and auto-correlation indeed show that above approximately 100 mJ, the laser pulse propagates through the 10 m vapor column. Figure 4 shows that the laser pulse experiences some transverse distortion and this will be the topic of further experimental and simulation work. The propagation of the laser pulse is the indication of the depopulation of the Rb atom ground state. Ionization from the first excited state or from other states also populated by the laser pulse photons should occur at even lower intensity than from the ground state. Therefore, with sufficiently high laser pulse intensities, the resonant interaction between the laser pulse and the Rb atoms could actually enhance the ionization process.
The timing between the p+ bunch and the laser pulse can also be set such that
ionization occurs ahead of the p+ bunch. This would mimic the case of a preformed
plasma. The plasma itself is produced at the time of the laser pulse. At each location and from the time of production, the plasma density can evolve through diffusion because of its finite transverse size, or through (mainly) three-body recombination. These processes have different evolution time scales. At the low plasma densities of AWAKE, the evolution is typically at the microsecond time scale (see measurements in Ref. [21]).
instability [22, 23]. Third, can the competition be suppressed (over the AWAKE plasma length) by seeding the self-modulation instability [23].
For example, the results obtained in Ref. [23] could be interpreted the following way. The part of the p+ bunch behind the seed point experiences SSM in a first
[image:10.612.103.493.290.449.2]plasma, while the front of the bunch that propagates in a vapor remains unaffected. In a second, preformed and long plasma dedicated to acceleration of electrons, the front part of the bunch could be subject to a self-modulation instability (unseeded) or to the hosing instability, depending on the noise level for the two instabilities. This could have important implication for the use of a second, pre-formed plasma for acceleration over long distances. We note here that the natural divergence of the front of the bunch, not subject to plasma focusing, could mitigate the growth of instabilities in the front of the bunch.
Figure 4. Images of the laser pulse transverse profile obtained by imaging the pulse at the vapor source exit. a) Propagation with 200 mJ in vacuum obtained without Rb vapor in the source, and b) with Rb vapor in the source withnRb= 7×1014cm−3and
240 mJ.
2.2. Self-Modulation Seeding
With the elements described above, the seeding of the SSM is possible. The part of the bunch ahead of the laser pulse does not interact with the neutral Rb vapor. The laser pulse that is itself shorter than the plasma period (120 fs4 ps) and the ionization process that occurs over an even shorter time scale provide a good seed for the SSM [24]. The sudden onset of the full plasma density in the middle of the p+ bunch is equivalent
to the sudden onset of the p+ bunch in a preformed plasma. This equivalence is used
to evaluate the seed wakefields amplitude (see below) and in numerical simulations so that neither the full bunch, nor the ionization process need to be simulated by using a ”cut” p+ bunch.
Assuming the laser pulse propagates along the 10 m in a plasma with density 1015cm−3, its velocity given by its group velocity v
g ∼=
1− 1
2 ω2
pe
ω2
l
c (for ω2
pe/ω2l 1,
∼
vb ∼=
1− 1
2γ2
c(for 1
γ2 1,∼= 5×10
−6 here). The dephasing distance between the two
and over the plasma length is thus: ∆L∼=vg
vb −1
L∼=21γ2 − ω2
pe
ω2
l
L∼= 50µmλpe.
Therefore, de-phasing between the laser pulse and the p+ bunch driving the wakefields
is not an issue for the seeding of the SSM. In addition, evolution of the laser pulse that does not decrease its intensity below the ionization intensity does not affect the seeding either since the laser pulse is so much shorter than the typical period of the wakefields. We evaluate the initial wakefields driven at the plasma entrance from PWFA linear theory [10]. With the AWAKE parameters (σz λpe) the bunch density can be
considered constant over a few plasma periods and the peak initial wakefield amplitude can be written as:
Wz =
e 0kpe
nb0·R(r), (1)
W⊥ = 2
e 0kpe2
nb0·dR(r)/dr, (2)
where nb0 is the bunch density at the seeding point. The terms R(r) and dR/dr
are geometric factors, which for kpeσr = 1 take the values R(r = 0) ∼= 0.46 and
dR(r = σr)/dr = −958m−1. This leads to initial values of 6.2 and 5.6 MV/m for
Wz andW⊥, respectively. Those amplitudes are much larger that the tens of keV values
expected from noise [25] and demonstrates the effectiveness of the seeding. Numerical simulations show that the wakefields grow from the seeded values to hundreds of MV/m values in∼4 m [12]. Therefore this seeding of the instability makes it possible to amplify the wakefields with well defined initial phase and amplitude.
Numerical simulations also show that, initially, the phase velocity of the wakefields is lower than that of the drive bunch and of the laser pulse [11]. The slow down is the result of the evolution of the p+ bunch and the growth of the wakefields. This means
that the phase of the wakefields at the point where the electrons would be externally injected for acceleration, that is, the phase of the wakefields relative to the laser pulse changes so much that the electrons find themselves in the wrong phase of the wakefields and probably move out of the wakefields and are lost through defocusing.
Figure 5 (from Ref. [26]) shows the typical evolution of the wakefields along the plasma near the injection point, a distance ξ ∼= σz=12 cm behind the laser pulse.
The figure is obtained from the moving window in 2D cylindrically symmetric PIC simulations using the code OSIRIS [27]. It confirms the expected evolution of the wakefields along the plasma. The transverse wakefields (Er −vb ×Bθ ∼= Er−c×Bθ)
are evaluated at the initial radius of the bunch, 200µm. The wakefields grow from initially focusing all along the bunch, to alternatively focusing/defocusing. During growth, the wakefields shift backwards in the moving window (itself moving at c) until z=4-5 m. Their phase remains essentially constant after that, i.e., after saturation of the SSM process. The longitudinal wakefields Ez follow the same trend (not shown).
show that the relative phase of the wakefields with respect to the moving window and the seed of the wakefields after z=4-5 m varies by less than λpe/10 with ne= 7×1014cm−3
and under variations of the bunch parameters N,σr,σz by ±5% [26].
44
(a) Perpendicular Wakefield Er−Bθ (b) Longitudinal WakefieldEz
Figure 4.2: Plasma wakefields at regions around ξ = -12 cm for different propagation lengths of the proton bunch in the plasma.
which corresponds to 0.013λp. The problem is not with the phase fitting routine (see
section A.6.3). We do not yet know why this happens in the simulation, so to keep simulations consistent for comparison, we keep the total file dump number at 50, and will later gauge the affect of having more file dumps (see section 4.7).
4.4
Changing Total Number of Protons
Simulations were run with the same parameters as in the initial case, but this time with the total number of protons in the bunch, Nb, changed by ±5%.
4.4.1
Wakefield Phase Difference
The respective phase shift of Ez for the region of ξ = -12 cm is shown in Figure
4.4 for simulations with the initial parameters and Nb±5%. We can see from this
figure that the increase/decrease of Nb directly correlates with an increase/decrease
in phase compared to the initial parameters case after z ≈ 3.5 m. We also see that the difference in phase between Nb±5% and the initial parameters is greater in the
region of maximum Ez between 3.5 and 5 m. This phase difference gets smaller after
the bunch has undergone SMI at the end of the plasma cell (which is also where Ez
decreases).
!"#$%&"
'( )*+ ,-!
"#.
/0
%
&
"
[image:12.612.184.407.153.339.2]#"#$%&"
Figure 5. Plot of the evolution of the transverse wakefields in phase and amplitude, focusing for protons in blue, along the bunch ξ and along the plasma z, around the point leading to the largest energy for electrons ξ ∼=12 cm. Parameters are those of AWAKE withne= 7×1014cm−3.
These results show that the strong seeding by the ionization front fixes the phase of the wakefields reached after saturation with variations that allow for external injection of electrons with the accelerating and focusing phase of the wakefields.
These results are also the seed for a study for AWAKE Run 2, whose goal is the acceleration of an externally injected electron bunch to a high energy (multi-GeV) with a narrow final energy spread and with preservation of the incoming bunch emittance (at the mm-mrad level). For these experiments the plasma could be split between a self-modulation and an acceleration section. The self-modulated plasma should be at least 4 m long. The electrons can then be injected from between the two plasmas and into the acceleration plasma where the evolution of the wakefields is expected to be less than during the development of the SSM. Since no seeding is required in the second plasma, the second source could be of a different kind to the first one. However, possible growth of the self-modulation instability in the front of the p+ bunch and from noise,
as well as of other competing instabilities should be studied carefully before adopting this scheme.
The current set up also allows for the study of the evolution of the p+ bunch in
3. SSM Diagnostics
The diagnostics are currently geared towards the effects of the SSM on the p+ bunch,
as outlined earlier: protons defocusing and modulation of the bunch density.
3.1. Protons Defocusing Measurements
The proton bunch is focused near the entrance of the plasma. Without plasma and with
β0 = 5mthe beam transverse rms size is 520µm at a screen located 2 m downstream and
830µm at a screen located 10 m downstream from the plasma exit. Without plasma, the bunch transverse profile is Gaussian at these two locations. Protons focused by and driving the wakefields exit at the end of the plasma and travel ballistically after that. Defocused p+ may leave the wakefields before the end of the plasma and travel
ballistically after that and form a halo around the focused core. A focused core and a halo on the transverse bunch images are evidence of the development of the SSM. With two screen the ballistic trajectory of the defocused protons can be reconstructed and the location along the plasma where they exited the wakefields can in principle be determined [28]. This measurement could yield important information about the saturation point of the SSM along the plasma as a function of the bunch and plasma parameters (ne, N, σz, etc.), a fundamental property of the SSM.
3.2. Proton Bunch Modulation Measurements
In its initial stage of growth, the SSM leads to modulation of the bunch radius. However, as the growth continue the SSM reaches a nonlinear stage in which the wakefields reach a significant fraction of the cold wave-breaking field. The plasma density perturbation sustaining these wakefields is also non-linear and so is the corresponding p+ bunch
density modulation.
When the p+ bunch enters a metal foil placed downstream from the plasma exit
it emits (backward) transition radiation (TR). This TR has a very broad spectrum, in theory from zero frequency to the metal equivalent electron plasma frequency, even in the x-ray range near atomic transitions. For a nanosecond bunch with time structure at the few picosecond scale and a radius of 200µm, the TR emitted in the visible range by the bunch ensemble is incoherent and is called optical transition radiation (OTR). Since the TR emission is prompt, the OTR light has the same time and spatial structure as the p+ and can thus be imaged and time resolved.
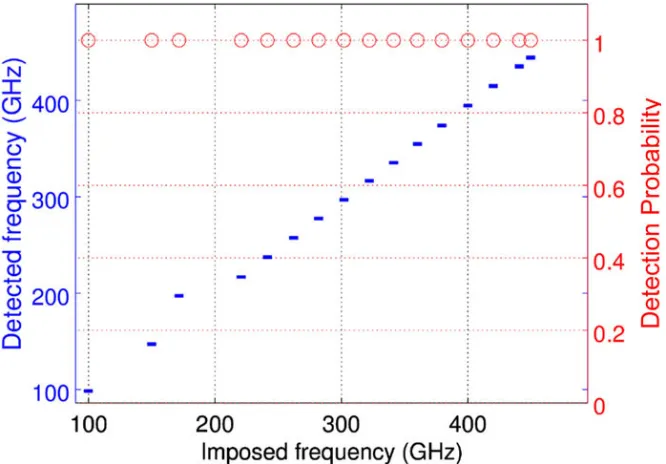
3.2.1. OTR and Streak Camera Measurements We demonstrated that a streak camera with picosecond impulse response can resolve the modulation frequency of a ns-long light pulse, i.e., with time structure similar to that expected from the p+ bunch OTR,
up to at least 450 GHz [29]. This is summarized in Fig. 6. The modulation of the input light was obtained by beating in an optical fiber two CW diode laser beams with precisely tunable frequencies. An optical fiber modulator gated the beat signal to give it a nanosecond length, similar to that expected from the OTR signal. Figure 7 shows
ÀJXUHVRQOLQHIMSHJð
[image:14.612.129.462.213.445.2]KWWSDLSVFLWDWLRQRUJQDKRPHOLWHUDWXPSXEOLVKHUDLSMRXUQDOVFRQWHQWUVLUVLLVVXHLPDJHVODUJHÀJXUHVRQOLQHI«
Figure 6. Detection probability (open circles) and mean detected frequency (dashes). A one percent false detection threshold allows the detection of frequencies up to 450 GHz. From Ref. [29].
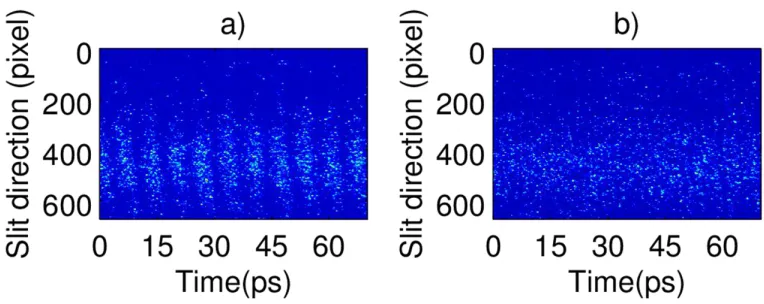
two streak images obtained during these measurements. Figure 7 a) shows that for low frequencies (<150 GHz), the modulation is directly visible on the image. Fourier analysis confirms the frequency of the modulation visible on the image and was used for Fig. 6. For higher frequencies (<300 GHz) the modulation is not visible (Fig. 7 b)), but Fourier analysis yields the expected modulation frequency value, as Fig. 6 shows. For even higher frequencies, the average of multiple Fourier power spectra yields the expected frequency. We note here that the test images were acquired at kHz repetition rate. In the initial AWAKE experiment, the p+ bunch is delivered to the plasma every
∼30 s. However, since the vapor and plasma source are thermal systems with large mass, the plasma density and thus the modulation frequency are expected to remain very constant over the time scale of tens of p+ bunch events. Averaging of the Fourier
signals is thus appropriate. Figure 8 shows streak images obtained with the SPS p+
bunch and the ionizing laser pulse. The first image shows that the p+ bunch and the
laser pulse can be synchronized and the laser pulse put in the middle of thep+bunch for
Figure 7. Images obtained during the streak camera tests with modulation frequencies of a) 150 and b) 450 GHz. From Ref. [29].
the laser oscillator at∼88 MHz and the SPS RF system frequency at∼200 MHz [30], and synchronizing the SPS extraction with the 10 Hz repetition rate of the laser amplification chain. The rms length of the p+ bunch is expected to be ∼400 ps and the image shows
∼ ±2σz of the bunch. The laser pulse appears longer than it is (∼120 fs) because of the
limited time resolution of the streak camera at this (slow) time scale. The second image is similar to the first image, except that the laser pulse now carries enough energy to ionize the Rb vapor and is thus blocked by the laser beam dumps (see Fig. 1) and not visible. However, it is clear that the p+ bunch is strongly affected at times after the
laser pulse, when it propagates in the plasma. The last figure shows that the plasma creation and the SSM can be triggered at an earlier time. Detailed results on the effect of the plasma on thep+ bunch and the seeding of the SSM are in preparation.
The p+ bunch has an arrival time jitter of ±15 ps with respect to the laser pulse.
This jitter is caused by synchrotron oscillations of thep+bunch with respect to the SPS
accelerating RF wave. However, the growth of the SSM is slow when compared to that jitter and this is therefore not expected to cause variation in the wakefields phase.
3.2.2. CTR Measurements The transition between coherent and incoherent emission occurs at frequencies such that ωτ ∼= 1, where τ =σz/c in the case of the unmodulated
bunch andτ =λpe/c in the case of a self-modulated bunch. Therefore the unmodulated
bunch emits CTR at frequencies lower than ∼40 GHz. Modulation frequencies are between 90 and 284 GHz for the AWAKE plasma density range. The bunch train emits CTR with a spectrum centered around the modulation frequency. The low frequency component corresponding to the bunch charge envelope is filtered out using a section of waveguide cut-off for frequencies below 60 GHz. The CTR is emitted in a cone of radially polarized radiation.
!
"#
$%
&'
(
&#
$%
&'
(
&#
!"
#
$%
&'
(
&#
)
*#+&',-#
./(
,#
01
[image:16.612.146.449.91.236.2]'#
Figure 8. Streak camera images at the nanosecond time scale. Left image: p+ bunch
and laser pulse at low power (no plasma). Middle image: p+ bunch with laser pulse
at at the same time as in the right image, but with high energy and blocked not to damage the streak camera (and thus not visible). see Fig. 1), creating a plasma for the part of the bunch behind of the laser pulse. The effect of the plasma on the bunch is clearly visible, the laser time or position is indicated by the red dashed line. Right: image similar to the middle image, but with the laser pulse earlier in the bunch demonstrating the ability to trigger the plasma at any time along thep+ bunch.
and decreases with increasing plasma density. The peak CTR intensity is in the 10-100 Wcm−2 at the location of the off-axis parabola used to collimate the CTR cone.
The CTR frequency (fCT R) can be analyzed simply with Schottky diodes placed
after cut-off waveguides. Suitable standard microwave band cut-off frequencies fco,W R−08−05−03 we use are 90 (WR-08), 140 (WR-05) and 220 GHz (WR-03). A system
of three diodes behind a centimeters-long waveguide and horn in each band is placed in the CTR emission cone with the proper orientation, that is with the small side of the waveguide horn along the CTR cone radius. The amplitude of the signal from these diodes directly yields information about the the CTR frequency content, for each event. For example, when operation at low plasma density (ne < 2.5 ×1014cm−3)
such that fCT R=fmod <fco,W R−05 a signal on the WR-08 diode could be the sum of
signals at all harmonics of fmod (weighted by the Schottky diode response at the various
harmonic frequencies). Similarly, a signal on the WR-05 diode with (2.5×10¹⁴ < n e<
6×1014cm−3) could be the sum of signals from the second and above harmonics of
fmod. And a signal on the WR-03 diode could be the sum of signals from the third and
above harmonics of fmod. Considering that the signal strength of each harmonic should
decrease with increasing harmonic number, harmonic signal ratios can be obtained from each event and as a function of the experimental parameters (ne, N, ...). With absolute
calibration of the detection system, an estimate of the bunch radial modulation depth, and, in the case of strong modulation, an estimate of the micro-bunch length with respect to λpe could be obtained.
For higher plasma densities the system only yields information about the first and second harmonics (fco,W R−05 < fmod < fco,W R−03) or even only about the first
We obtain precise measurements of the CTR and modulation frequency from heterodyne measurement systems in the WR-08 and WR-03 waveguide bands. The systems mix the CTR signal of unknown (but guessed from nRb assuming full laser
ionization) frequencyfCT R(usually referred to asfRF), with a signal of known frequency
fLO. The systems generate the frequency difference, called the intermediate frequency:
fIF =|fRF −fLO|. The value offLO is chosen to bringfIF into the bandwidth of a fast
oscilloscope: fIF ≤20 GHz. We then use Fourier or wavelet analysis to determine the
frequency content of the signal. Since the emission lasts for a time on the order of the half p+ bunch length (400-800 ps), the frequency difference must be kept large enough
to obtain a few periods of fIF in the signal. Measurements with two slightly different
values of fLO lift the ambiguity in frequency introduced by the absolute value in the
expression forfIF.
We operate the heterodyne systems simultaneously by splitting the CTR signal and also obtain harmonic content information, in this case avoiding contributions of multiple harmonics to a single signal since the signals are frequency resolved. We also developed a heterodyne system for which the local oscillator signal is generated directly on the mixing diode by two CW infrared laser pulse tuned to beat at fLO [32], the same laser
system used for the streak camera tests [29].
4. A look at the future
Current experiments focus on the study of the SSM physics and span till the end of 2017. These require only the p+ bunch, the Rb vapor source, the ionizing laser pulse
and the diagnostics described here (see Fig. 2 a)).
An electron beam injector capable of producing 10-20 MeV electrons is in its installation phase. The electron bunch length is ∼10 ps, long when compared to the period of the wakefields so that precise timing between the bunch and the wakefields is not critical for capture and acceleration. However, in this case only a fraction of the electrons are captured. The electron bunch is injected at the peak amplitude of the wakefields,∼σz behind the ionization laser pulse, as suggested by Fig. 2 b).
smaller than a plasma period, as suggested by simulations [26], and thus the effectiveness of the wakefields seeding. The position of the injected electrons with respect to the wakefields will thus be determined. These experiments will be performed first at low plasma densities for which the modulation of thep+ bunch density, akin to that of the
plasma electron density, can be directly observed on the streak camera images together with the accelerated electrons. At higher densities, only the modulation frequency can be determined for the Fourier transform of the bunch density and the phase information is lost.
These external injection experiments will sample the wakefields driven by the p+
bunch. A narrow final energy spread may be obtained because of the electron capture process [12].
In order to reach a high capture efficiency (100%), a narrow final energy spread (∼1%) and preserve the emittance of the incoming bunch (∼2µm), the injected electron bunch must be short (∼ 100f s < λpe/c) and carry a large enough charge to load
the wakefields. This is suggested in Fig. 2 c). In particular, with the parameters of Table 1 the plasma density perturbation does not reach the initial density. That means that plasma electrons remain in the wakefields structure, as in the linear regime. The transverse focusing force acting on the accelerated electrons is thus not linear with radius. The emittance of the witness bunch is not preserved.
However, beam loading can at the same time flatten the wakefields for a narrow final energy spread and evacuate the remaining electrons. In this situation, the bulk of the electron bunch propagates in an ion column void of plasma electrons and its emittance can be preserved, at least against geometric aberrations [33].
5. Summary
AWAKE is a proton-driven plasma wakefield acceleration experiment at CERN. Initial experiments focus on the seeded self-modulation of the 400 GeV proton bunch in a 10 m-long rubidium plasma with electron density adjustable in the 1 to 10×1014cm−3 range.
[1] T. Tajima and J. Dawson, , 267 (1979) [2] P. Chen et al ,Phys. Rev. Lett.54, 693 (1985)
[3] J. M. Dawson,Phys. Rev.113, 383 (1959)
[4] Caution has to be taken with this reasoning. Additional considerations come from the fact that at the lower density the bunch density is larger than the plasma density and the linear theory argument is not strictly valid. In addition the finite transverse size of the bunch should also enter the evaluation of the wakefields amplitude. However, the argument remains globally valid, the expected wakefields are indeed much higher in the high plasma density case.
[5] A. Caldwellet al ,Nature Physics 5, 363 (2009)
[6] G. Xiaet al , Proceedings IPAC2010, Kyoto, Japan, June 2010, p. 4395
[7] M. Tatarakiset al ,Phys. Rev. Lett.90, 17 (2003); C. M. Huntingtonet al ,Phys. Rev. Lett.106, 10 (2011)
[8] B. Allen et al ,Phys. Rev. Lett.109, 185007 (2012) [9] Y. Fang et al ,Phys. Rev. Lett.112, 045001 (2014) [10] R.Keinigset al ,Physics of Fluids30, no.1, 252 (1987) [11] N. Kumaret al ,Phys. Rev. Lett.104, 255003 (2010)
[12] AWAKE Collaboration,Plasma Phys. Control. Fusion56, 084013 (2014), E. Gschwendtner et al
, Nucl. Instr. and Meth. in Phys. Res. A829, 76 (2016), A. Caldwellet al , Nucl. Instr. and
Meth. in Phys. Res. A829, 3 (2016)
[13] C. B. Schroederet al ,Phys. of Plasmas19, 010703 (2012) [14] K. V. Lotovet al ,Phys. Plasmas21, 123116 (2014) [15] G. Plyushchev and R. Kersevan, in preparation
[16] E. ¨Ozet al , Nucl. Instr. Meth. Phys. Res. A740(11), 197 (2014) [17] E. ¨Ozet al , Nucl. Instr. and Meth. in Phys. Res. A829, 321 (2016) [18] S. Augstet al ,Phys. Rev. Lett.63, 2212 (1989)
[19] J. Vieiraet al ,Phys. Rev. Lett.109, 145005 (2012)
[20] A. Joulaeiet al ,Nucl. Instr. and Meth. in Phys. Res. A829, 339 (2016)
[21] S. Wang, PhD thesis, University of California, Los Angeles, 2002 (available athttp://www.seas. ucla.edu/plasma/files/Phd%20Thesis/2002_Wang_PhdThesis.pdf)
[22] D. H. Whittumet al ,Phys. Rev. Lett.67, 991 (1991) [23] J. Vieiraet al ,Phys. Rev. Lett.112, 205001 (2014)
[24] J. Vieiraet al ,Plasma Phys. Control. Fusion56, 084014 (2014) [25] K. V. Lotovet al ,Phys. Rev. ST Accel. Beams16, 041301 (2013) [26] N. Savard, Master Thesis, University of Victoria, 2016
[27] R. A. Fonsecaet al ,Lecture Notes in Computer Science23312002 (Berlin: Springer)
[28] M. Turneret al ,Nucl. Instrum. Meth. A829, 314 (2016); M. Turneret al ,Nucl. Instrum. Meth. A854, 100 (2017)
[29] K. Riegeret al , Review of Scientific Instruments88, 025110 (2017)
[30] H. Damerauet al , Proceedings of IPAC2016, Busan, Korea, May 2016, p. 3743 [31] M. Martyanovet al , in preparation.
[32] M. Martyanov, private communication.
[33] V. K. Berglyd Olsenet al, Proceeding of the 2016 North American Particle Accelerator Conference, Chicago, p. 457
![Figure 3. Top: schematic of the Rb vapor source with the hot regions (Rb reservoirs,heat exchanger) in red-orange colors and the cold regions in blue color (expansionvolume) [15]](https://thumb-us.123doks.com/thumbv2/123dok_us/9341472.436165/8.612.148.534.102.428/figure-schematic-source-regions-reservoirs-exchanger-regions-expansionvolume.webp)