The Structure of VOPc on Cu(111): Does V
O Point Up, or Down, or
Both?
P.J. Blowey,
†,‡R.J. Maurer,
§L.A. Rochford,
§,∥D.A. Duncan,
‡,⊥J.-H. Kang,
#D.A. Warr,
§A.J. Ramadan,
∇T.-L. Lee,
‡P.K. Thakur,
‡G. Costantini,
§K. Reuter,
○and D.P. Woodru
ff*
,††Department of Physics and§Department of Chemistry, University of Warwick, Coventry CV4 7AL, U.K.
‡Diamond Light Source, Didcot OX11 0QX, U.K.
∥School of Chemistry, University of Birmingham, Birmingham B15 2TT, U.K.
⊥Physik-Department E20, Technische Universitat Mü ̈nchen, 85748 Garching, Germany
#Department of Nano and Electronic Physics, Kookmin University, Seoul 136-702, Korea
∇Clarendon Laboratory, Department of Physics, University of Oxford, Oxford OX1 3PU, U.K.
○Department Chemie, Technische Universität München, 85748 Garching, Germany
*
S Supporting InformationABSTRACT: The local structure of the nonplanar phthalocya-nine, vanadyl phthalocyanine (VOPc), adsorbed on Cu(111) at a coverage of approximately one-half of a saturated molecular layer, has been investigated by a combination of normal-incidence X-ray standing waves (NIXSW), scanned-energy
mode photoelectron diffraction (PhD), and density-functional
theory (DFT), complemented by scanning tunnelling micros-copy (STM). Qualitative assessment of the NIXSW data clearly
shows that both“up”and“down”orientations of the molecule (with VO pointing out of, and into, the surface) must coexist on the surface. O 1s PhD proves to be inconclusive regarding the molecular orientation. DFT calculations, using two different dispersion correction schemes, show good quantitative agreement with the NIXSW structural results for equal co-occupation of
the two different molecular orientations and clearly favor the many body dispersion (MBD) method to deal with long-range
dispersion forces. The calculated relative adsorption energies of the differently oriented molecules at the lowest coverage show a
strong preference for the “up” orientation, but at higher local coverages, this energetic difference decreases, and mixed
orientation phases are almost energetically equivalent to pure“up”-oriented phases. DFT-based Tersoff−Hamann simulations of STM topographs for the two orientations cast some light on the extent to which such images provide a reliable guide to molecular orientation.
1. INTRODUCTION
The fact that phthalocyanines (Pc) are promising materials for solar photovoltaic cells and other electronic devices1,2has been one factor motivating many studies in the past few years of these molecules adsorbed on surfaces, particularly on close-packed coinage metal surfaces and mostly using scanning
tunnelling microscopy (STM).3Much of this work has focused
on copper phthalocyanine (CuPc) and other essentially planar phthalocyanines containing a single central atom that can be accommodated within the molecular plane. Only a few studies have been undertaken of nonplanar phthalocyanines centered by a diatomic moiety (GaCl, TiO, ClAl, VO) that is oriented perpendicular to the phthalocyanine ligand plane. While adsorption of these species on surfaces with which the interaction is mostly dispersion dominated (largely van der Waals in character) is expected to favor a molecular orientation in which this central diatomic moiety points out from the surface (“up”), on more strongly interacting substrates the expected preferred orientation is less clear. Here we report the
results of an investigation of the structure of vanadyl
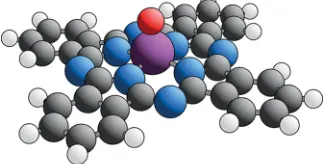
phthalocyanine (VOPc,Figure 1) on Cu(111).
Very few quantitative structural investigations have been reported of phthalocyanine adsorption in general, but for nonplanar phthalocyanines, in particular, there have been only three such studies. The quantitative structural technique of
normal-incidence X-ray standing wave (NIXSW)4 has been
applied to study TiOPc on Ag(111).5 It was concluded that
TiO points out of the surface (hereafter referred to as an“up” orientation) over the full range of submonolayer ordered phases, but at higher coverages, additional molecules with the TiO pointing“down”occur in a bilayer. These“head-to-head” bilayer structures are believed to be stabilized by the opposing dipole moments of the“up” and“down”species, and indeed,
Special Issue: Hans-Joachim Freund and Joachim Sauer Festschrift
Received: August 3, 2018 Revised: September 24, 2018 Published: October 12, 2018
Article
pubs.acs.org/JPCC Cite This:J. Phys. Chem. CXXXX, XXX, XXX−XXX
© XXXX American Chemical Society A DOI:10.1021/acs.jpcc.8b07530 J. Phys. Chem. CXXXX, XXX, XXX−XXX
License, which permits unrestricted use, distribution and reproduction in any medium, provided the author and source are cited.
Downloaded via 137.205.202.2 on January 11, 2019 at 13:56:56 (UTC).
this is the same structural arrangement found in bulk crystals
and thin films of these nonplanar phthalocyanines (e.g., refs
6−9). NIXSW has also been used to investigate GaClPc on
Cu(111)10 with the initial conclusion that the GaCl points
down to the surface to form a Cl-substrate covalent bond at submonolayer coverages, although both orientations were believed to occur at bilayer coverage. Subsequently, however, the same group undertook density-functional theory (DFT) calculations on this system and concluded that the lowest energy low-coverage structure actually involves scission of the
Ga−Cl bond, with the atomic Cl being coadsorbed with the
remaining GaPc species. The NIXSW data were reinterpreted as consistent with this dissociation model.11Finally, a
scanned-energy mode photoelectron diffraction (PhD) investigation of
VOPc on Au(111) led to the conclusion that in this system, the V−O bond points out of the surface.12
In the absence of such quantitative structural investigations, the most commonly used technique upon which orientation assignments have been made in the literature is STM. As
shown in Figure 1, VOPc, in common with other
phthalocyanine molecules, is 4-fold symmetric with four conjugated isoindole subgroups and a central species, which in this case is the vanadyl ion VO2+. If the molecule is adsorbed with its molecular plane parallel to the surface, this 4-fold symmetric shape can be recognized in STM images, while in images recorded in the constant tunnelling current mode, the center of the molecule is sometimes imaged as a dip (dark) and sometimes as a protrusion (bright). These two alternative images have been assumed to correspond to the two possible
orientations of the molecule, with the VO bond either
pointing“up”(out of the surface) or“down”(into the surface). Which image corresponds to which orientation has largely been a matter of conjecture, although complementary independent electronic structure information derived from X-ray absorption spectra (XAS) or X-X-ray photoelectron spec-troscopy (XPS) has been used to support some assignments. Most commonly, it has been asserted, or assumed, that the image with the bright protruding center corresponds to the
“up” orientation (e.g., refs13,14). Of course, it is clearly true that in this orientation, the O atom center lies higher above the surface than the surrounding C, N, and H atoms, so there certainly is a physical protrusion. However, STM maps the corrugation of the surface electronic structure, which does not necessarily follow the geometrical structure. STM images of VOPc adsorbed on Au(111) show no bright centers, but reasonable arguments have been presented as to why this may be compatible with an“up” orientation,15and this conclusion is consistent with the findings of the PhD study12
TiOPc is reported to adopt an“up”orientation on Ag(111) both in a low-coverage commensurate phase, which appears in
STM to contain an ordered arrangement of molecules showing both bright and dim centers, and in a higher-coverage phase, in which the imaged molecules all show a dip in their centers.16 This orientation assignment for the higher-coverage phase is consistent with the results of the NIXSW study.5By contrast, a very recent STM and STS (scanning tunnelling spectroscopy)
study of TiOPc on Cu(111), Ag(111), and Au(111)17 finds
evidence in STM images of both orientations coexisting on all these surfaces at submonolayer coverages, with a tendency to form up/down dimers. On Ag(111), in particular, local work function measurements achieved by measuring the dependence of the tunnelling current on the tip height were used to determine the orientation of the molecular dipoles. The molecular images with the central protrusion showed a local increase in work function attributed to the “up” orientation, and those with no central protrusion showed a local work
function decrease assigned to a “down” orientation. STM
images of TiOPc on Cu(110) show both central dips and central protrusions that have been assigned, respectively, to
“up”- and“down”-oriented species; these assignments seem to be based on the reduced (lower than 4-fold) symmetry of the
images of the molecules attributed to those in the “down”
orientation.18It was argued that this reduced symmetry could result from a molecular tilt that would not be expected to occur in the“up”orientation with the molecular plane parallel to the metal surface. An STM study of ClAlPc on Cu(111) also
shows two different types of molecular image. One with a
bright center was assigned to an “up” orientation, while the other image shows no bright center but a feature with reduced
(2-fold) symmetry that was assigned to a “down” species.19
ClB-subPc, which contains three conjugated isoindole groups,
has also been investigated by STM on Cu(111).20Also in this
system, two different local molecular images are seen. One
with a bright center that was assigned to an “up”orientation, but the other image with a dim center was assigned to a dissociated (BPc) species; in this case, these assignments were based on the results of complementary DFT calculations. There is clearly a parallel here between ClB-subPc and GaClPc, in that DFT calculations indicate release of Cl from both molecules on interaction with the Cu(111) surface.
VOPc has also been studied on both Ag(111) and Si(111) using the XAS and synchrotron X-ray photoelectron spectros-copy (SXPS) techniques;21the authors interpret their data as
indicating that the molecule adopts an “up” orientation on
Ag(111) but a “down”orientation on Si(111).
In the case of VOPc adsorbed on Cu(111), investigated here, STM images of submonolayer coverages show what
appears to be a random mixture of the two different types of
molecular images, most obviously interpreted as a mixture of
“up”and“down”orientations.13In order to try to understand the true situation better, we report here the results of the application of two quantitative structural techniques, NIXSW and PhD, to this system, complemented by DFT calculations of both the minimum energy structure and the expected STM images. The surface phases formed were further characterized
by STM, low-energy electron diffraction (LEED), and SXPS.
2. EXPERIMENTAL AND COMPUTATIONAL METHODS
[image:2.608.91.253.64.146.2]Initial characterization of the Cu(111)/VOPc adsorption system was conducted using an ultrahigh-vacuum (UHV) room temperature Omicron STM instrument also equipped with low-current LEED optics (Omicron SPECTALEED) and Figure 1.Ball-and-stick model representation of the VOPc molecule.
Coloring used is O = red, N = blue, C = black, H = white, and V = purple.
DOI:10.1021/acs.jpcc.8b07530
J. Phys. Chem. CXXXX, XXX, XXX−XXX
the usual facilities for in situ sample preparation, at the University of Warwick. Additional STM imaging was performed using a second, commercial (Createc) low-temper-ature STM instrument at Warwick, to produce images at a
sample temperature of ∼80 K. SXPS, NIXSW, and PhD
measurements were undertaken at the I09 UHV end-station of the Diamond Light Source equipped with a VG Scienta EW4000 HAXPES hemispherical electron analyzer (angular acceptance range±30°), which was mounted in the horizontal plane at 90°to the direction of the incident linearly polarized
undulator radiation. This chamber was also fitted with
low-current LEED optics (OCI BDL800IR-MCP LEED). The I09 beamline consists of two undulators that provide a separate
“hard” and “soft” X-ray source. A Si(111) double crystal
monochromator delivers the “hard”X-rays needed to perform
the NIXSW experiments at I09, while a grazing incidence plane grating monochromator delivers the soft X-rays required for the measurement of high-resolution SXP spectra and PhD data. The sample surface preparation was the same at all
instruments. Specifically, the Cu(111) single crystal was
prepared in situ using cycles of 1 keV Ar+ ion bombardment
for 30 min followed by annealing to ∼500 °C for another 30
min. All STM images were plane-corrected andflattened using
the open source image-processing software Gwyddion.22VOPc
powder (85% pure (dye content), Sigma-Aldrich, UK) was triply purified by thermal gradient sublimation and degassed 20
°C below the temperature at which significant evaporation
occurs for several days prior to use. VOPc was deposited onto
the Cu(111) surface from two different standard commercial
evaporation cells on the different analysis chambers, delivering
similar VOPcfluxes when operated at nominal temperatures of
∼270 and ∼380 °C. respectively, as measured by K-type
thermocouples.
All DFT calculations were performed with the all-electron local orbital code FHI-aims23and standard “tight” numerical settings using the PBE exchange-correlation functional.24The structures were relaxed with a force convergence criterion of 25 meV/Å. Long-range dispersion interactions were accounted for with the vdWsurfdispersion correction scheme25and the
short-range screened many body dispersion (MBD) method,26,27
with environment-dependent dispersion parameters as defined
by Ruiz et al.25This approach has been previously described.28 The optimized lattice constant of bulk Cu was 3.62 Å. We performed calculations for surface overlayers of VOPc on
Cu(111) in a range of different surface meshes in order to
represent low-coverage (LC) and high-coverage (HC) situations. Specifically for the LC case, a single molecule was placed in a (7×4√3)rect. unit mesh, while higher coverages
were represented by a single molecule in a (6×6) unit mesh
(HC1), two molecules in a (11×6) unit mesh (HC2), and
two molecules in a (10×3√3)rect. unit mesh (HC3). A 4×4
×1 Monkhorst−Pack Brillouin zone sampling was used for the
LC, HC1, and HC2 unit mesh structures. A 2 × 2 × 1
sampling was used for the HC3 unit mesh structure. The substrate slab was modeled with four layers, of which the lowest layer was frozen in its bulk truncated structure during geometry relaxations. The vacuum above the slab was chosen to exceed 30 Å. The adsorption energies were calculated as the differences between the energies of the relaxed slab with the adsorbed molecules and the isolated molecule and the clean relaxed surface. All calculation inputs and outputs have been
deposited as a data set in the NOMAD repository (https://
repository.nomad-coe.eu/) and are freely available.29
3. RESULTS AND DISCUSSION
3.1. Surface Characterization. For deposition of VOPc onto the Cu(111) surface at room temperature, no ordered surface phase was seen in LEED until an estimated coverage of approximately 90% of a saturated single layer of the molecule was achieved. The LEED pattern of the resulting ordered adsorption phase is described by the surface mesh matrix
(
6 2)
1 6 , as shown in Figure S1. However, STM images
recorded from this preparation showed that this procedure led to a surface in which partial coverage of a second layer of
VOPc occurred (Figure S2). It appears that, at room
temperature, it is not possible to prepare a surface comprising only a single complete layer of the molecule; instead, partial second layer growth occurs before the ordered LEED pattern appears.
As the objective of this investigation was to determine the orientation of VOPc molecules adsorbed only within a single layer on the Cu(111) surface, we have therefore concentrated
on measurements of surfaces with VOPc coverages signifi
-cantly less than those that give rise to the ordered
(
6 21 6)
overlayer. In order to provide a direct comparison of our results with earlier STM studies, we recorded some images of submonolayer coverages of VOPc on Cu(111) at a sample temperature of∼80 K, suppressing the rapid surface diffusion
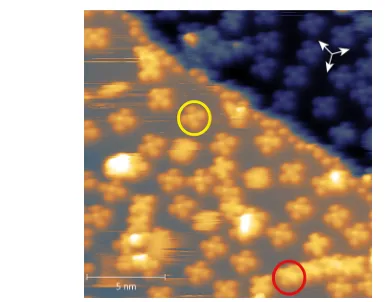
that precludes such imaging at room temperature. Figure 2
shows such an image, which displays very similar features to those previously reported by Niu et al.13recorded at a similar
temperature. In particular, it shows two different features
apparently attributable to VOPc molecules, namely, very dim crosses with a brighter center (circled in yellow) and slightly brighter crosses with no obvious darker or brighter center (circled in red). These are the two molecular images that have
been attributed to the two different molecular orientations.
Also, as seen in images reported by Niu et al., the molecules imaged as bright crosses seem prone to form ordered chains. A similar effect has also been reported in STM images from SnPc
on Ag(111).30 Indeed, in areas of the surface in which
essentially all of the molecules are isolated, there appears to be a dominance of molecular images with the bright centers (see
Figure S3). The two different types of molecular image are also
[image:3.608.322.518.365.516.2]evident in the higher-coverage
(
6 21 6)
phase as shown inFigure 2.STM image recorded at∼80 K at a lower coverage of VOPc (V=−1.5 V,I= 54 pA). Superimposed colored circles identify two different molecular image types described in the text, while the white arrows point along the <110> azimuthal directions of the surface.
DOI:10.1021/acs.jpcc.8b07530
J. Phys. Chem. CXXXX, XXX, XXX−XXX
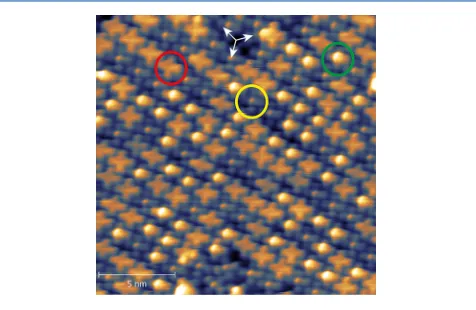
Figure 3, also imaged at∼80 K, on a surface prepared at room temperature.
In this image a third type of feature, having the appearance of a very bright disc (circled in green), is also visible.
Continuous imaging at ∼80 K revealed that these very bright
features are actually mobile on the surface and must therefore
correspond to adspecies above the single-layer VOPc film;
indeed, some of these features appear as streaks rather than spots. Whether these are additional VOPc molecules or contaminant species is unknown. They appear to move between sites atop those VOPc molecules that are imaged as crosses of intermediate brightness with no brighter center.
3.2. SXPS and NIXSW Measurements. The NIXSW technique4exploits the fact that at the conditions of an X-ray Bragg diffraction from a crystal, the incident and diffracted beams interfere to produce an X-ray standing wave with the same periodicity as that of the Bragg scattering planes. Under these conditions of total “reflection” (from a nonabsorbing crystal), extinction leads to afinite penetration of the X-rays, so the total reflectivity exists over a small but finite range of incidence energy or angle. Within this range, the nodal planes of the standing wave shift in a systematic fashion relative to the atomic scattering planes. Measuring the absorption of this
X-ray standing wave as a function of photon energy at specific
atoms immersed in this standing wavefield (both in and on the surface) therefore provides a means of determining the location of the absorber, relative to these scattering planes. In the present experiments, the (111) Bragg scattering condition was used with photon incidence near-normal to the Cu(111) surface to determine the heights of the VOPc constituent atoms above the substrate. Absorption at the
different atoms was monitored in an element- and
chemical-state specific fashion by measuring the C 1s, N 1s, O 1s, and V 2p core level photoemission spectra as a function of photon energy. Structural parameter values were then extracted after
correction for the effects of nondipolar backward−forward
angular distribution in the photoemission.4
NIXSW absorption profiles can be uniquely fitted by two
parameters, the coherent fraction, fco, and the coherent
position,p. In the simple ideal situation, in which an absorbing atom occupies a single well-defined height above the scattering
planes with no static or dynamic disorder, fco = 1, and the
actual height of the atom above the scattering planes is given byD= (n+p)d111, whered111is the layer spacing of the (111)
scattering planes (2.08 Å for Cu), and n is an integer. The
ambiguity introduced by n is because NIXSW measures
positions relative to the nearest extended bulk scattering plane.
Excluding significant surface relaxations (i.e., more than
∼0.01−0.02 Å) or surface reconstruction of the outermost
layer spacings of the underlying substrate, neither of which is expected to be the case for Cu(111), there is almost certain to
be only one value of n that leads to a realistic adsorbate−
substrate distance. More generally,fcois commonly regarded as an order parameter, and indeed, small random static or dynamic displacements of the absorber atoms and of the underlying crystalline substrate are typically found to reduce the coherent fraction by up to about 20%, a value consistent
with a calculated Debye−Waller factor based on reasonable
assumptions regarding the size of these displacements. Values offcoless than∼0.8 are generally due to the co-occupation of two or more sites having different heights. Specifically, if several sites with heightszjare equally occupied, each having a coherent fraction fj, then the resulting coherent position and
fraction are given by
i k
jjjjj y{zzzzz
∑
π = π
=
f p
n f
i z
d exp(i2 ) 1 exp 2
j n
j
j
co
1 111
Notice that this can be conveniently represented in an Argand
diagram by vectors of length fj and fco and direction
determined by angles (2πzj/d111) and 2πp.31 One particular consequence of this is that if one has two equally occupied sites with a height difference ofd111/2 the resulting value offco is zero.
In order to ensure that the measured NIXSW data corresponded to samples that only contained a single molecular layer, measurements were undertaken at the lowest coverages compatible with collecting data of an acceptable quality. Coverage estimates for these experiments were based on measurements of the relative intensities of the N 1s, C 1s, and Cu 3p emission peaks; the intensities of these spectra recorded from a higher-coverage surface that yielded the
(
6 2)
1 6 LEED pattern provided an additional internal
reference. On the basis of these measurements, the surface coverage used for the NIXSW measurements reported here
was∼50% of a saturated molecular layer or∼0.015 ML (using
the standard surface science definition that 1 ML corresponds to one adsorbate per surface atom). As this also corresponds to the atomic coverage of V and O, it is unsurprising that although even lower-coverage preparations allowed meaningful NIXSW measurements of C 1s and N 1s, it was not possible to obtain matching NIXSW data using the barely detectable O 1s or V 2p emission.
SXPS was also used to check on the possible influence of
damage to the adsorbed VOPc, be it dissociation due to
interaction with the substrate (as identified for GaClPc on
Cu(111)10,11) or radiation damage resulting from the incident synchrotron radiation. XP spectra were measured both at the
photon energies of∼3 keV used for the NIXSW measurements
but also at lower photon energies (∼400−700 eV) using the
soft X-ray capability of the beamline to achieve higher spectral resolution. In fact, evidence for radiation damage was more noticeable using the lower photon energies, so these soft SXP spectra were recorded after, rather than before, NIXSW Figure 3. STM image recorded at∼80 K of the
(
6 21 6)
phase ofVOPc on Cu(111) (V= 1.3 V,I= 54 pA). Superimposed colored circles identify three different molecular image types described in the text, while the white arrows point along <110> azimuthal directions of the surface.
DOI:10.1021/acs.jpcc.8b07530
J. Phys. Chem. CXXXX, XXX, XXX−XXX
measurements. Examples of spectra recorded at the higher
energies are shown in Figure 4. Both O 1s and V 2p spectra
showed evidence of a second chemically shifted component. Specifically, O 1s spectra showed a second peak with a binding energy∼1.7 eV larger than the molecular peak, while similarly
shifted components (by ∼2.0 eV to lower binding energy)
were seen on the V 2p1/2 and 2p3/2 peaks. One possible
interpretation of the two chemically shifted components is that they correspond to emission from“up”and“down”orientated VOPc molecules; indeed, the published assignment of VOPc
adopting only a“down”orientation on Si(111) was supported
by the observation of a chemical shift in the O 1s binding energy as a result of strong Si−O bonding.21However, in the present system, the relative intensities of the main and shifted
components varied very significantly between different
preparations at similar coverages. Moreover, if these two
components corresponded to the two differently oriented
species, we would expect them both to show high coherent fractions in the NIXSW experiments; by contrast, as reported below, the main O 1s peak from which reliable NIXSW parameters could be obtained always showed very low coherent fractions.
Our interpretation of the chemically shifted V 2p peaks in terms of dissociation is consistent with the fact that the shift appears to be the same as that seen in comparative spectra of
VOPc and VPc on Ag(111).32 Indeed, both of these shifted
components are to be seen in XP spectra recorded from thin
films of VOPc on Ni(111), assigned to“interface states”14that could also be a result of partial dissociation of VOPc at the reactive Ni(111) surface. The presence of these components does indicate that some partial fragmentation of the adsorbed VOPc occurs, and at least part of this seemed to be due to radiation damage. There was limited evidence that increased exposure of the sample to the X-ray beam caused these peaks to grow in the case of the low-coverage preparations, although this effect was seen to be more significant at higher (greater than one molecular layer) coverages. Notice, however, that the
chemical-state specificity provided by
photoemission-moni-tored NIXSW and PhD means that all NIXSW and PhD data presented here relate only to the O and V atoms in the
undamaged VOPc molecules. Thefit to the V 2p spectra also
includes broad satellites previously attributed to multiplet effects in V (e.g., ref14).
In the case of the C 1s emission, the associated photoemission spectrum clearly contains multiple peaks as seen inFigure 4. As is clear fromFigure 1, VOPc contains four chemically distinct C atom environments, of which three can be resolved in the SXPS, as shown in thefit ofFigure 4. The components at 284.6 and 285.1 eV are attributed to C atoms in the peripheral benzene rings, whereas the component at 285.9 eV is attributed to the pyrrole C atoms located in the inner ring of the phthalocyanine macrocycle, consistent with similar assignments by Zhang et al.33A weak feature, also observed in the spectra at soft X-ray energies, is tentatively attributed to shake-up satellites. However, the reliability and uniqueness of
this three-peak fit to individual spectra recorded during the
NIXSW photon energy scans is questionable, so for the C NIXSW, the total area integrated over all components was used as a more reliable measurement of the C absorption profile and thus of the average height of all the constituent C atoms.
The key results obtained from the NIXSW measurements, the values of the coherent fraction and coherent position for each of the elementally distinct atomic absorbers, are
summarized in Table 1. The measured NIXSW profiles are
illustrated in Figure S4. A striking feature of these results is that, with the exception of the value for V, all the coherent fraction values are rather low, with that for O particularly low. The implication is that the C, N, and O atoms must occupy at
least two different heights above the surface but that the V
atoms are either all at the same height above the surface or at two or more heights that differ by integral multiples of d111. The particularly low value offcofor O implies that if there are just two different adsorption sites for the VOPc molecule, the
height of oxygen atoms must differ by a value quite close to
d111/2. The fact that the coherent positions and fractions for C and N are very similar to each other would suggest that, even in the context of multiple adsorption geometries in which the molecular planes containing the C and N atoms are located at
two or more different adsorption heights, all of these
[image:5.608.51.295.86.314.2]contributing geometries must have the molecular planes approximately parallel to the surface. Evidently, in qualitative Figure 4. SXP spectra in the N 1s, C 1s, O 1s, and V 2p regions
recorded at a photon energy in the NIXSW range, together withfits showing the different spectral components. The main peaks for each atomic species are shown in red, while the background, satellite structure, and chemically shifted components are shown in blue, green, and purple, respectively.
Table 1. NIXSW Structural Parameter Values Obtained from Low-Coverage VOPc on Cu(111)a
C N V O
fco p fco p fco p fco p
0.51(5) 0.22(3) 0.41(5) 0.23(3) 1.00(15) 0.46(3) 0.21(8) 0.27(10)
aError estimates in the last digit are shown in brackets.
DOI:10.1021/acs.jpcc.8b07530
J. Phys. Chem. CXXXX, XXX, XXX−XXX
terms, these observations would be consistent with the VOPc
layer comprising a mixture of “up” and “down” orientated
molecules. More quantitative modeling depends on the molecule−substrate bonding geometries, including any quanti-tative changes in the internal conformation of the molecules. This will be discussed further following presentation of the results of our DFT calculations that offer further insight into these parameters.
3.3. Scanned-Energy Photoelectron Diffraction (PhD) Results. The PhD technique34 exploits the coherent interference of the directly emitted component of a photo-electron wavefield from a core level of an adsorbate atom with other components elastically scattered by nearby atoms. By scanning the photon energy, and thus the photoelectron energy and its associated wavelength, these scattering paths switch in and out of phase, leading to modulations in the angle-resolved photoemission signal detected outside the surface in specific directions. Calculations of this scattering (including the role of multiple scattering) lead to simulated PhD
modulation spectra for different model structures, the best
agreement with experiment corresponding to the best structural model. In investigations of atomic adsorbates, in particular, the dominant scattering events mostly involve backscattering from the outermost layers of the substrate. In the photoelectron energy range of interest (typically∼50−300
eV), scattering events involving near-180° scattering often
dominate as a result of a peak in the scattering cross section of many atoms at this angle. For this reason, a study of the O 1s and V 2p PhD seen in normal emission from VOPc adsorbed
on a surface has the potential to distinguish the “up” and
“down”geometries in a particularly simple fashion, exploiting
the backscattering within the vanadyl VO ligand that is
expected to be oriented perpendicular to the surface. The previous application of PhD to determine the orientation of
adsorbed VOPc was on the Au(111) surface.12 This system
was particularly well-suited to this simple interpretation,
because the adsorption in this case is in an incommensurate ordered phase. This ensures that the molecules could not have a well-defined local registry to the Au(111) surface layer, while Au is a particularly weak backscattering atom in the energy range of the measurement. The O 1s PhD along normal emission was clearly dominated by backscattering from the underlying V atom with VOPc adsorbed in an“up”orientation, although inclusion of other purely intramolecular scattering was found to be important to give a goodfit to the data.
For VOPc on Cu(111), on the other hand, the fact that the coverage investigated is below that at which any ordered phase occurs means it is certainly possible that a well-defined local geometryisoccupied (albeit with rapid diffusion between such sites); moreover, Cu is a strong backscattering atom in the energy range investigated. It is therefore clearly essential to include the role of Cu backscattering in the multiple scattering simulations for this system and particularly for any VOPc in a
“down” orientation, for which the O 1s PhD must be
dominated by the substrate backscattering. Calculations were
performed for model adsorption geometries varying the V−O
bond length and the size of the displacement of the V atom out of the CN plane as well as the height of the molecule above the surface. Notice that bending of the phthalocyanine ligand plane (as subsequently found in the DFT calculations) was not explored, as the single normal emission PhD spectrum is not sensitive to this effect. For the “down” orientation, the O atoms were assumed to be located in a hollow site, as favored
by the DFT calculations (see below). Specific models tested
were“up”and“down”geometries individually, together with a
model in which both “up” and“down” are equally occupied.
Within this mixed model, the geometry of each orientation was optimized independently. In fact, the optimized geometries of
the “up” and “down” models individually were found to be
closely similar to the optimized model when both species were
present. Figure 5 shows a comparison of the experimental
[image:6.608.139.474.69.300.2]normal emission O 1s PhD modulation with the three different
Figure 5.Comparison of the experimental normal emission O 1s PhD modulation spectrum with the results of multiple scattering simulations for the best-fit“up”,“down”, and mixed“up”and“down”VOPc geometries. On the left are shown the two components of the mixed model (with H atoms omitted and assuming a rigid phthalocyanine ligand plane).
DOI:10.1021/acs.jpcc.8b07530
J. Phys. Chem. CXXXX, XXX, XXX−XXX
best-fit models; also shown in thisfigure is the actual geometry of the two components of the mixed model (H atoms are too weakly scattering to play a significant role in PhD and thus are not included). Using our standard PhD methodology,33,35the best-fit structures were identified as those that give the lowest value of an objectiveR-factor (reliability factor). The values of this parameter for the three models were:“up”, 0.09; “down”,
0.13; mixed, 0.11. While the pure “up” geometry therefore
gives the best fit, the small data range means that all models
withR-values in the range defined by the minimum value and
the calculated variance,34namely, 0.09±0.04, are acceptable, so these measurements prove unable to distinguish the different models. However, the best-fit structures do provide some information on the preferred associated structural parameter values. In particular, the V atoms in the “up” and
“down”geometries are at almost exactly the same height above the surface, while the height difference of the O atoms in the two geometries is 3.30 Å, corresponding to a difference in the anticipated coherent positions of 0.58. These conclusions are qualitatively consistent with the measured NIXSW coherent fractions for these two atoms: very high for V and very low for O. The mixed model implied by the NIXSW data is, therefore, consistent with the PhD results.
3.4. Density-Functional Theory Structure Calcula-tions. As described in section 2, DFT calculations were
performed using two different methods of correcting for the
role of dispersion forces, namely the vdWsurf dispersion
correction scheme25 and the many body dispersion (MBD)
method.26 Both of these methods have been shown to
accurately represent the adsorption geometry of complex organic molecules on metal surfaces including porphines
adsorbed on Cu(111).28,36,37 The known overestimation of
adsorption energy in the pairwise description of vdWsurf is
partly remedied by the MBD method.38 The periodic
boundary conditions implicit in surface slab calculations require a commensurate ordered phase, while the experimental data were taken at a coverage too low, at room temperature, for any ordered phase to develop in islands sufficiently large to be detectable by LEED.
[image:7.608.315.557.53.320.2]In order to explore the possible influence of intermolecular interactions on the surface, several different periodic structures were thus calculated corresponding to different local coverages. For the lowest coverage, we used a near-square (7×4√3)rect. surface unit mesh containing a single VOPc molecule (“LC”,
Figure 6). In this mesh, the molecule−molecule separation is 17.7 Å, considered a good approximation for isolated adsorbed molecules. The corresponding coverage is 0.018 ML,
approximately the same as the average coverage used in the
NIXSW experiments. However, these experiments were performed at room temperature, at which no ordered phase forms, and many of the molecules can be expected to occupy small dynamically forming islands that have a higher local coverage.
Higher coverages were simulated by several alternative
structures. The simplest of these has a primitive (6 × 6)
surface unit mesh containing a single molecule. This
corresponds to a molecule−molecule spacing of 15.4 Å and
a coverage of 0.028 ML (“HC1”, Figure 6). Further
calculations were performed using larger unit meshes containing two molecules (either both with the same orientation or with two opposite orientations), allowing intermolecular interactions to render these two molecules locally inequivalent even with the same orientation. Specifi
-cally, the “HC2” model (Figure 6) has a primitive (11 ×6)
surface unit mesh with dimensions of 15.4 × 28.2 Å,
corresponding to a coverage of 0.030 ML. The HC2 mesh
calculations were performed for both molecules “up”, both
molecules “down”, and one molecule “up” with the other
molecule“down”. Finally, calculations were performed using a
(10 × 3√3)rect. unit mesh (dimensions of 13.3 ×25.6 Å)
containing one “up” and one “down” molecule with a total
coverage of 0.033 ML (“HC3”, Figure 6). Notice that the
molecular packing densities of all of these higher-coverage models are closely similar to that of the experimentally
observed
(
6 21 6)
high-coverage phase (0.029 ML), but theirlarger unit meshes allow the impact of the interaction between
adjacent “up”- and “down”-oriented molecules to be
investigated. As remarked above, in the surfaces explored experimentally by NIXSW and PhD, the high mobility of the VOPc molecules on the surface is expected to lead to many molecules transiently occupying islands of higher local coverage, for which the HC models can be expected to be relevant.
It is already clear from our qualitative discussion of the
NIXSW results that structural models based on only “up” or
“down” orientated molecules cannot be consistent with these
results. In particular, as there is only one O atom in each molecule, such a model can only have one height of O atoms above the surface, so the associated coherent fraction must be high (unity in the absence of static or dynamic disorder), whereas experimentally, this parameter is very low. This is
confirmed by the complete set of structural parameter values
found for the LC, HC1, and HC2 unit mesh structures, containing VOPc molecules that are all either in the “up” or
“down” orientations, calculated using the two different
Figure 6. Four different unit mesh structures used for the DFT calculations. LC, HC1, and HC2 structures shown here have only molecules in the“up”orientation, but other orientations were tested in the same unit meshes. The HC3 mesh contains one molecule of each orientation.
DOI:10.1021/acs.jpcc.8b07530
J. Phys. Chem. CXXXX, XXX, XXX−XXX
dispersion corrections that are listed inTable S1. Specifically, the values shown are the average heights of each atomic species above the mean location of the outermost Cu layer (which
does suffer some adsorbate-induced buckling). In order to
facilitate comparison with the NIXSW results, the calculated coherent fractions, which result from this range of heights, are also given. Because there is only a single molecule per unit
mesh, the corresponding predicted fcovalues for V and O are
unity. Clearly, none of these single-orientation structures led to structural parameter values compatible with the experimental NIXSW results that show low coherent fractions for the C, N,
and O atoms. To reproduce this effect, one must consider
models involving co-occupation of both orientations. Before doing so, however, it is instructive to look into some of the details of the single-orientation models.
Calculations for the LC mesh with VOPc in the “up”
orientation reveal the molecular geometry to be similar to that obtained from calculations of an isolated molecule in the gas phase. The molecule is positioned with the aromatic rings aligned with the high-symmetry directions of the surface, with a preference for adsorption centered above a bridge site (Figure 7). When describing the system with pairwise-additive
van der Waals forces (PBE+vdWsurf), the vanadium atom is
situated 0.70 Å above the average carbon position of the phthalocyanine core. In the“down”orientation, the molecule preferentially adsorbs with the V−O above a hollow site, and
the small oxygen−copper distance generates a significant
amount of steric strain. As a result, the adsorption height of the phthalocyanine carbon core is 0.21 Å higher, and the vanadium atom is situated only 0.13 Å further above the surface than the carbon atoms. When accounting for higher-order long-range dispersion interactions with the PBE+MBD method, which has been shown to yield excellent agreement with experiment for
both molecular adsorption geometries and energetics,39 we
find that the adsorption heights of the molecule in both
orientations are lower. Higher-order dispersion corrections screen the interactions and reduce the effective van der Waals radii that predominantly define the molecule−surface distance. The overall dispersion interactions are significantly reduced, as
reflected in a reduction in adsorption energy by more than 1
eV.
PBE+vdWsurf results for the higher-coverage HC1 unit cell
show a systematic upward shift of the molecular backbone by about 0.2 Å when compared to the LC results. However, the adsorption height differences between the “up” and “down” orientations are not significantly affected. In the case of PBE
+MBD, the molecular geometries of the “up” and “down”
molecules are asymmetrically distorted due to interactions with neighboring molecules. If one compares the atomic heights in the two different orientations, O, C, and N heights all differ significantly, whereas the vanadium atoms are found at almost exactly the same height. This would mean that a mixture of the two orientations would show a much higher coherent fraction for vanadium than for the other atoms, as also indicated by the PhD results and qualitatively consistent with the NIXSW results.
The HC2 unit cell corresponds to a coverage at which VOPc molecules can no longer be accommodated onto the surface in
a planar geometry (Figure 7). For both “up” and “down”
orientations, parts of the conjugated phthalocyanine system become tilted relative to the surface in order to accommodate
the molecules and maximize molecule−surface and lateral
intermolecular interactions; this is the origin of the significant decrease in thefcovalues for the C atoms, in particular. This
effect is found using both the vdWsurfand the MBD methods.
Notice, however, that no systematic global search for the most stable overlayer structure was conducted due to the computa-tional cost associated with the large HC2 unit cell.
As already discussed in the context of the experimental results, the NIXSW data clearly indicate that there must be two
different adsorption geometries involved, and the simplest
model is to assume equal occupation of the“up” and“down”
orientations. Figure 8shows a quantitative comparison of the
[image:8.608.52.293.308.507.2]experimental NIXSW coherent fractions, fco, and positions,p, shown as vectors in an Argand diagram (fcoexp(−i2πp)) with the predicted values obtained from the DFT calculations assuming a 1:1 mix of the two different molecular orientations. A complete tabulation of the individual parameters is shown in
Table S2.Figure 8shows clearly that values calculated by the
vdWsurf method, shown as dashed lines, provide less
satisfactory agreement with the experimental results than the values calculated using the MBD method (full lines). Moreover, the best agreement is for the LC and HC1 models. In particular, the highfcovalue for V and the lowfcovalue for O, which characterize the experimental results, are only reproduced in the PBE+MBD calculations for the LC and HC1 models. Indeed, even better agreement with theory and experiment would result from a mixture of these two models, a
scenario that may well reflect the extent of intermolecular
interactions in the disordered layer investigated experimentally. Notice that the parameter showing the worst agreement is the coherent position for the O atoms. However, with such a low measured value of the coherent fraction, the uncertainty in the associated coherent position value is high (at least ±0.1 and possibly significantly larger).
Overall, therefore, the DFT results provide clear quantitative support for the model implied by a simple qualitative evaluation of the NIXSW experimental results, namely, that this low-coverage preparation of VOPc on Cu(111) leads to a mixture of “up”- and “down”-oriented molecules of
approx-imately equal occupancy. Substantially different occupancies
would lead to a much higher coherent fraction for the O Figure 7. Side views of the structures obtained in the PBE+MBD
calculations for the“up”and“down”molecules in the LC unit mesh and for two“up”molecules in the HC2 unit mesh.
DOI:10.1021/acs.jpcc.8b07530
J. Phys. Chem. CXXXX, XXX, XXX−XXX
atoms, inconsistent with the experimental data. Of course, the adsorption energy associated with each orientation should provide a means to provide a quantitative estimate of their likely relative (equilibrium) occupancy. In this regard, however, the DFT results reveal significant variations in the
adsorption energies for different models. For the
lower-coverage structures, the adsorption energy of the “up”
orientation is favored over the“down”orientation by amounts
ranging from 0.21 eV in the PBE+vdWsurfcalculations for the
HC1 structure to 0.53 eV in the PBE+MBD calculations for the LC structure. Assuming a simple Boltzmann distribution, such large energy differences would be expected to lead to an almost 100% occupation of the“up”geometry if in equilibrium at room temperature. However, in calculations for
higher-coverage models, in which “up” and “down” orientation
molecules coexist, the adsorption energy is only slightly less
favorable than for molecules that are only in the “up”
orientation. In particular, in the HC2 unit mesh calculated using the PBE+MBD method, the adsorption energy of the mixed orientation model, in which the unit mesh contains one
“up” molecule and one“down”molecule, is only 50 meV per
molecule less favorable than the model with all molecules in the “up” orientation. This effect is likely to significantly
influence the NIXSW experimental results taken at a coverage
of ∼50% of a saturated single layer, in which most molecules
must have other nearest-neighbor molecules. Indeed, it is notable that in the STM image of the ordered layer (Figure 3), molecules with one type of image generally have one or more neighbors of the other type (orientation). At the lowest coverage (Figure 2), there also appears to be a dominance of a single orientation in the isolated molecules that lack near-neighbors, an effect also particularly clear in the STM image of
Figure S3. We note that, especially for the “down”-oriented
molecules, we expect that the self-interaction error inherent to both dispersion-corrected functionals will lead to a
misrepre-sentation of Pauli repulsion effects. This could potentially
affect the relative energetics. Unfortunately,
long-range-corrected hybrid functionals that would provide a partial remedy to this issue, such as HSE06+MBD, are currently computationally intractable for systems of this size.28
While the NIXSW experiments were deliberately conducted at the lowest coverage compatible with acceptable data quality, it was noted above that at room temperature, second layer growth was found to occur before thefirst layer was complete. One might then speculate that some second layer growth could occur already at even lower coverages. One possible explanation of the qualitative NIXSW results is therefore that the presence of two molecular orientations could be a result of the double-layer islands on the surface. In particular, the structure of both bulk crystalline VOPc, but also thin epitaxial
films of VOPc, involve double layers with a head-to-head
orientational relationship. To explore this possibility, further DFT calculations were performed using the preferred PBE
+MBD method on two double-layer structures that differ in
their relative registry. The results for the energetically more favorable registry (which proves to be similar to the registry in
bulk VOPc) are included in Table S2. Clearly, this structure
does not lead to structural parameter values compatible with the experimental NIXSW data. In particular, a low coherent fraction is found for V, whereas a high coherent fraction is found for O, the opposite to the measured behavior.
3.5. Density-Functional Theory STM Simulations. In
view of the many papers, described in theIntroduction, that
have attempted to use the appearance of STM images to determine the orientation of VOPc and similar adsorbed molecules (notably TiOPc), it is of interest to extract from the DFT calculations reported here some simple simulations of the images that would be expected. The standard approach to this,
which we have used here, is that of Tersoffand Hamann.40
Although this approach is widely used, it is important to recognize that it takes no explicit account of the nature of the scanning tip and is based only on the electronic structure of the surface being investigated. The results of simulations
corresponding to two different sample bias potentials are
shown for the LC phase inFigure 9.
As might have been expected and has been widely (but not universally) assumed, the simulated images (at both bias voltages) show a bright central protrusion for VOPc in the
“up” orientation, i.e., such that the VO bond points out of
the surface. However, the simulated images for the “down”
-oriented molecule also have a bright central part of the molecular images. In detail, the simulated images for the two orientations do differ. What is less clear, though, is the extent to which this level of detail would be readily detected, bearing in mind the limited resolution achievable in most STM instruments. In practice, STM images of VOPc on Cu(111) show some molecules with bright centers, some without; however, the simulations predict that both molecular orientations should image with a bright center, albeit with the contrast between the center and perimeter of the molecule
being weaker in the “down” orientation. Based on these
[image:9.608.54.292.58.304.2]simulations, it seems likely that the images showing the brightest centers probably do correspond to VOPc molecules in an“up”orientation. On this basis, the fact that STM results in a surface in which all molecules are isolated on the surface (Figure S3), showing almost only this type of bright-centered Figure 8.Comparison of the experimental NIXSW coherent fractions
and coherent positions, shown as vectors in an Argand diagram, for each of the elements within the VOPc molecule compared with the results of the DFT calculations for different unit meshes and computational methods, assuming equal occupation of the“up”and
“down”orientations.
DOI:10.1021/acs.jpcc.8b07530
J. Phys. Chem. CXXXX, XXX, XXX−XXX
molecular image, suggests that these are all in the “up” orientations, consistent with the DFT energetics. Of course, the exact appearance of these images is likely to be dependent on the nature of the underlying substrate and the tip being employed for imaging. As a consequence, this conclusion cannot be generalized to all studies of adsorbed VOPc or, indeed, extended to studies of adsorbed TiOPc.
4. CONCLUSIONS
Previous investigations of VOPc adsorption on Cu(111), and other surfaces, have attempted to determine the molecular orientation by indirect means. Here we have presented the results of a structural investigation, using two quantitative experimental techniques, NIXSW and PhD. The limited range of the O 1s PhD data, recorded only at normal emission, has proved to be inconclusive. The strong scattering of the Cu substrate atoms has meant that the limited data range that
proved effective in the study of VOPc on Au(111) [12] led to
ambiguity in which“up”,“down”, and mixed“up”and“down” orientations all gave theory−experiment agreement within the
acceptable range defined by the associated variance. By
contrast, NIXSW results obtained from surfaces with VOPc
coverages of ∼50% of a single saturated molecular layer are
clearly incompatible with all adsorbed VOPc molecules being in the same orientation, with qualitative evaluation clearly favoring co-occupation of both orientations. A more
quantitative evaluation of these results is afforded by the
outcome of detailed density-functional theory calculations that clearly identify not only the optimum structural solution but also the best dispersion correction to obtain this experiment−
theory agreement, namely, the many body dispersion on top of the PBE-GGA functional (PBE+MBD). Interestingly, these DFT results indicate that, at the lowest coverages, the “up” orientation of the molecules is strongly energetically favored. Indeed, ordered domains of pure “up” orientation are clearly favored over ordered domains of only“down”molecules at all
coverages. However, mixed “up”-and-“down” domains at
increased coverage have total energies very similar to those of pure“up”domains. Thisfinding is in qualitative agreement with STM measurements at the lowest coverage, in which a higher rate of occurrence is observed of geometries that are typically associated with “up”-oriented molecules. However,
our DFT-based Tersoff−Hamann simulations of the STM
images expected from these molecular orientations cast some doubt on the ability to use STM images for a unique assignment of molecular orientations. This further underscores the importance of quantitative experimental structural information as provided by NIXSW and PhD.
■
ASSOCIATED CONTENT*
S Supporting InformationThe Supporting Information is available free of charge on the
ACS Publications website at DOI:10.1021/acs.jpcc.8b07530.
LEED pattern and STM image of high-coverage ordered phase at room temperature; low-temperature STM at low coverage; experimental photoemission-monitored
NIXSW absorption profiles and fits; tables of DFT
structural parameter values and implied NIXSW parameters for single-orientation and double-orientation structural models (PDF)
■
AUTHOR INFORMATIONCorresponding Author
*E-mail:d.p.woodruff@warwick.ac.uk.
ORCID
D.A. Duncan: 0000-0002-0827-2022
A.J. Ramadan: 0000-0003-4572-3459
P.K. Thakur:0000-0002-9599-0531
G. Costantini:0000-0001-7916-3440
K. Reuter:0000-0001-8473-8659
D.P. Woodruff: 0000-0001-8541-9721 Notes
The authors declare no competingfinancial interest.
■
ACKNOWLEDGMENTSThe authors acknowledge the benefit of the award of beamtime
on the Diamond Light Source (reference numbers SI9459, NT14524, and SI15899). They also gratefully acknowledge computing time on SuperMUC of the Bavarian Academy of
Science and also on the Scientific Computing RTP at Warwick
and the EPSRC-funded HPC Midlands Plus (EP/P020232/1). D.A.D. would like to acknowledge funding from the Alexander
von Humboldt Foundation. P.J.B. acknowledges financial
support from the Diamond Light Source and EPSRC. G.C.
and D.A.W. acknowledge financial support from the EU
through the European Research Council (ERC) Grant
[image:10.608.71.271.56.364.2]“VISUAL-MS.”
Figure 9.Results of DFT simulations of STM images of the LC VOPc
“up” and “down” orientation models at two different sample bias potentials, together with the top views of schematic representations of the structures.
DOI:10.1021/acs.jpcc.8b07530
J. Phys. Chem. CXXXX, XXX, XXX−XXX
■
REFERENCES(1) Walter, M. G.; Rudine, A. B.; Wamser, C. C. Porphyrins and Phthalocyanines in Solar Photovoltaic Cells.J. Porphyrins
Phthalocya-nines2010,14, 759−792.
(2) De la Torre, G.; Claessens, C. G.; Torres, T. Phthalocyanines: Old Dyes, New Materials. Putting Color in Nanotechnology.Chem.
Commun.2007,20, 2000−2015.
(3) Wang, Y.; Wu, K.; Kröger, J.; Berndt, R. Structures of Phthalocyanine Molecules on Surfaces Studied by STM. AIP Adv. 2012,2, 041402.
(4) Woodruff, D. P. Surface Structure Determination Using X-Ray Standing Waves.Rep. Prog. Phys.2005,68, 743−798.
(5) Kröger, I.; Stadtmüller, B.; Kumpf, C. Submonolayer and Multilayer Growth of Titaniumoxidephthalocyanine on Ag(111).New
J. Phys.2016,18, 113022.
(6) Hiller, W.; Strähle, J.; Kobel, J.; Hanack, M. Polymorphie, Leitfähigkeit und Kristallstrukturen von Oxo-phthalocyaninato-titan-(IV).Z. Kristallogr. - Cryst. Mater.1982,159, 173−183.
(7) Griffiths, C. H.; Walker, M. S.; Goldstein, P. Polymorphism in Vanadyl Phthalocyanine.Mol. Cryst. Liq. Cryst.1976,33, 149−170.
(8) Ziolo, R. F.; Griffiths, C. H.; Troup, J. M. The Crystal Structure of Vanadyl Phthalocyanine, Phase II. J. Chem. Soc., Dalton Trans. 1980, 2300−2302.
(9) Yanagi, H.; Mikami, T.; Tada, H.; Terui, T.; Mashiko, S. Molecular Stacking in Epitaxial Crystals of Oxometal Phthalocyanines.
J. Appl. Phys.1997,81, 7306−7312.
(10) Gerlach, A.; Hosokai, T.; Duhm, S.; Kera, S.; Hofmann, O. T.; Zojer, E.; Zegenhagen, J.; Schreiber, F. Orientational Ordering of Nonplanar Phthalocyanines on Cu(111): Strength and Orientation of the Electric Dipole Moment.Phys. Rev. Lett.2011,106, 156102.
(11) Wruss, E.; Hofmann, O. T.; Egger, D. A.; Verwüster, E.; Gerlach, A.; Schreiber, F.; Zojer, E. Adsorption Behavior of Nonplanar Phthalocyanines: Competition of Different Adsorption Conformations.J. Phys. Chem. C2016,120, 6869−6875.
(12) Duncan, D. A.; Unterberger, W.; Hogan, K. A.; Lerotholi, T. J.; Lamont, C. L. A.; Woodruff, D. P. A Photoelectron Diffraction Investigation of Vanadyl Phthalocyanine on Au(1 1 1).Surf. Sci.2010,
604, 47−53.
(13) Niu, T.; Zhang, J.; Chen, W. Molecular Ordering and Dipole Alignment of Vanadyl Phthalocyanine Monolayer on Metals: The Effects of Interfacial Interactions.J. Phys. Chem. C2014,118, 4151−
4159.
(14) Adler, H.; Paszkiewicz, M.; Uihlein, J.; Polek, M.; Ovsyannikov, R.; Basova, T. V.; Chasse, T.; Peisert, H. Interface Properties of VOPć on Ni(111) and Graphene/Ni(111): Orientation-Dependent Charge Transfer.J. Phys. Chem. C2015,119, 8755−8762.
(15) Barlow, D. E.; Hipps, K. W. A Scanning Tunneling Microscopy and Spectroscopy Study of Vanadyl Phthalocyanine on Au(111): the Effect of Oxygen Binding and Orbital Mediated Tunneling on the Apparent Corrugation.J. Phys. Chem. B2000,104, 5993−6000.
(16) Fernández, L.; Thussing, S.; Mänz, A.; Witte, G.; Brion-Rios, A. X.; Cabrera-Sanfelix, P.; Sanchez-Portal, D.; Jakob, P. Structural and Vibrational Properties of the TiOPc Monolayer on Ag(111).J. Phys.
Chem. C2017,121, 1608.
(17) Zhao, W.; Zhu, H.; Song, H.; Liu, J.; Chen, Q.; Wang, Y.; Wu, K. Adsorption and Assembly of Photoelectronic TiOPc Molecules on Coinage Metal Surfaces.J. Phys. Chem. C2018,122, 7695−7701.
(18) Maughan, B.; Zahl, P.; Sutter, P.; Monti, O. L. A. Selective Cooperative Self-Assembly between an Organic Semiconductor and Native Adatoms on Cu(110).J. Phys. Chem. C 2015, 119, 27416−
27425.
(19) Niu, T.; Zhou, M.; Zhang, J.; Feng, Y.; Chen, W. Dipole Orientation Dependent Symmetry Reduction of Chloroaluminum Phthalocyanine on Cu(111).J. Phys. Chem. C2013,117, 1013−1019.
(20) Ilyas, N.; Harivyasi, S. S.; Zahl, P.; Cortes, R.; Hofmann, O. T.; Sutter, P.; Zojer, E.; Monti, O. L. A. Sticking with the Pointy End? Molecular Configuration of Chloro Boron-Subphthalocyanine on Cu(111).J. Phys. Chem. C2016,120, 7113−7121.
(21) Eguchi, K.; Takagi, Y.; Nakagawa, T.; Yokoyama, T. Molecular Orientation and Electronic States of Vanadyl Phthalocyanine on Si(111) and Ag(111) Surfaces.J. Phys. Chem. C2013,117, 22843− 22851.
(22) Nečas, D.; Klapetek, P. Gwyddion: an Open-Source Software for SPM Data Analysis.Open Physics2012,10, 181−188.
(23) Blum, V.; Gehrke, R.; Hanke, F.; Havu, P.; Havu, V.; Ren, X.; Reuter, K.; Scheffler, M. Molecular Simulations with Numeric Atom-Centered Orbitals.Comput. Phys. Commun.2009,180, 2175−2196.
(24) Perdew, J. P.; Wang, Y. Accurate and Simple Analytic Representation of the Electron-Gas Correlation Energy. Phys. Rev.
B: Condens. Matter Mater. Phys.1992,45, 13244−13249.
(25) Ruiz, V.; Liu, W.; Zojer, E.; Scheffler, M.; Tkatchenko, A. Density-Functional Theory with Screened Van Der Waals Interactions for the Modeling of Hybrid Inorganic-Organic Systems. Phys. Rev.
Lett.2012,108, 146103.
(26) Tkatchenko, A.; DiStasio, R.; Car, R.; Scheffler, M. Accurate and Efficient Method for Many-Body van der Waals Interactions.
Phys. Rev. Lett.2012,108, 236402.
(27) DiStasio, R. A., Jr.; Gobre, V. V.; Tkatchenko, A. Many-Body Van Der Waals Interactions in Molecules and Condensed Matter. J.
Phys.: Condens. Matter2014,26, 213202.
(28) Maurer, R. J.; Ruiz, V. G.; Tkatchenko, A. Many-Body Dispersion Effects in the Binding of Adsorbates on Metal Surfaces.J.
Chem. Phys.2015,143, 102808.
(29) When reusing these data, please cite the following DOI:http:// dx.doi.org/10.17172/NOMAD/2018.07.28-1.
(30) Wang, Y.; Kröger, J.; Berndt, R.; Hofer, W. Structural and Electronic Properties of Ultrathin Tin−Phthalocyanine Films on Ag(111) at the Single-Molecule Level.Angew. Chem.2009,121, 1287. (31) Woodruff, D. P.; Cowie, B. C. C.; Ettema, A. R. H. F. Surface Structure Determination using X-ray Standing Waves: A Simple View.
J. Phys.: Condens. Matter1994,6, 10633.
(32) Eguchi, K.; Nakagawa, T.; Takagi, Y.; Yokoyama, T. Direct Synthesis of Vanadium Phthalocyanine and Its Electronic and Magnetic States in Monolayers and Multilayers on Ag(111).J. Phys.
Chem. C2015,119, 9805−9815.
(33) Zhang, Y.; Learmonth, T.; Wang, S.; Matsuura, A. Y.; Downes, J.; Plucinski, L.; Bernardis, S.; O’Donnell, C.; Smith, K. E. Electronic Structure of the Organic Semiconductor Vanadyl Phthalocyanine (VO-Pc).J. Mater. Chem.2007,17, 1276−1283.
(34) Woodruff, D. P. Adsorbate Structure Determination Using Photoelectron Diffraction: Methods and Applications. Surf. Sci. Rep. 2007,62, 1−38.
(35) Duncan, D. A.; Choi, J. I. J.; Woodruff, D. P. Global Search Algorithms in Surface Structure Determination Using Photoelectron Diffraction.Surf. Sci.2012,606, 278−284.
(36) Maurer, R. J.; Ruiz, V. G.; Camarillo-Cisneros, J.; Liu, W.; Ferri, N.; Reuter, K.; Tkatchenko, A. Adsorption Structures and Energetics of Molecules on Metal Surfaces: Bridging Experiment and Theory.
Prog. Surf. Sci.2016,91, 72−100.
(37) Müller, M.; Diller, K.; Maurer, R. J.; Reuter, K. Interfacial Charge Rearrangement and Intermolecular Interactions: Density-Functional Theory Study of Free-Base Porphine Adsorbed on Ag(111) and Cu(111).J. Chem. Phys.2016,144, 024701.
(38) Liu, W.; Maass, F.; Willenbockel, M.; Bronner, C.; Schulze, M.; Soubatch, S.; Tautz, F. S.; Tegeder, P.; Tkatchenko, A. Quantitative Prediction of Molecular Adsorption: Structure and Binding of Benzene on Coinage Metals.Phys. Rev. Lett.2015,115, 036104.
(39) Maurer, R. J.; Liu, W.; Poltavsky, I.; Stecher, T.; Oberhofer, H.; Reuter, K.; Tkatchenko, A. Thermal and Electronic Fluctuations of Flexible Adsorbed Molecules: Azobenzene on Ag(111). Phys. Rev.
Lett.2016,116, 146101.
(40) Tersoff, J.; Hamann, D. R. Theory of the Scanning Tunneling Microscope. Phys. Rev. B: Condens. Matter Mater. Phys. 1985, 31, 805−813.
DOI:10.1021/acs.jpcc.8b07530
J. Phys. Chem. CXXXX, XXX, XXX−XXX