Munich Personal RePEc Archive
Money and Pay-As-you-Go Pension
Yasuoka, Masaya
Kwansei Gakuin University
14 December 2016
Online at
https://mpra.ub.uni-muenchen.de/75578/
Money and Pay-As-you-Go Pension
∗
Masaya Yasuoka
†December 14, 2016
Abstract
In an aging society with fewer children, a pay-as-you-go pension system presents severe difficul-ties. A decrease in the share of working people among the population raises the burden for pensions per capita to maintain a constant replacement ratio of pensions. This burden reduces capital accu-mulation. Therefore, income growth is prevented. The analyses in this paper demonstrate that if the replacement rate of pension is high, a decrease in population growth reduces the income growth rate even if a decrease in population growth can raise the income growth rate per capita because the capital stock that the workers can use increases. However, by setting an appropriate monetary policy for decreasing population growth, the income growth is not prevented by an increase in the burdens for pensions. The negative effect of the burden for pensions on income growth can be eliminated by the change of the money supply rate in the long run.
JEL Classification: H55, E52, O42, J11.
Keywords: Income growth, Pay-as-you-go pension, Monetary policy, Fewer children
∗The author is thankful to the seminar participants of Doshisha University and Kochi University of Technology for helpful
comments. Research for this paper was supported financially by JSPS KAKENHI Grant Number 26380253. Nevertheless, any remaining errors are the author’s responsibility.
†Corresponding to: School of Economics, Kwansei Gakuin University, 1-155 Uegahara, Ichiban-Cho, Nishinomiya, Hyogo
1
Introduction
In an aging society with fewer children, pension sustainability is an important topic. With pay-as-you-go
pension systems, incoming funds paid by younger people are distributed to older people as pensions in a
single period. Therefore, fewer children implies a decrease in the number of working people in the future.
The per-capita pension burden on younger people becomes larger or the per-capita pension benefit for
older people becomes smaller.
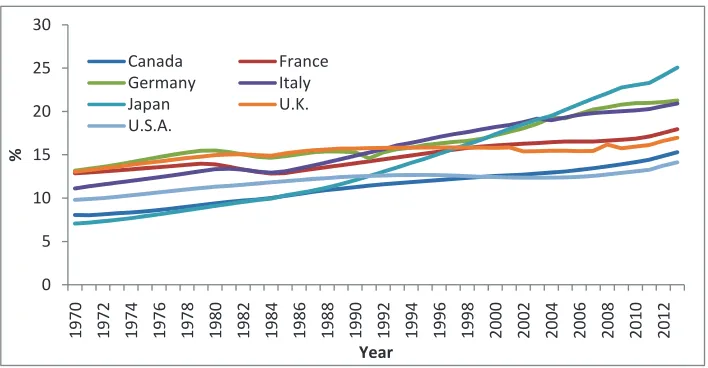
[Insert Fig. 1 around here.]
Fig. 1 shows the elderly population rate in some OECD countries. As shown in Fig. 1, the elderly
population rate continues to increase. Because of an increase in the elderly population rate, younger
people must pay for their government to provide a social security system that includes programs such as
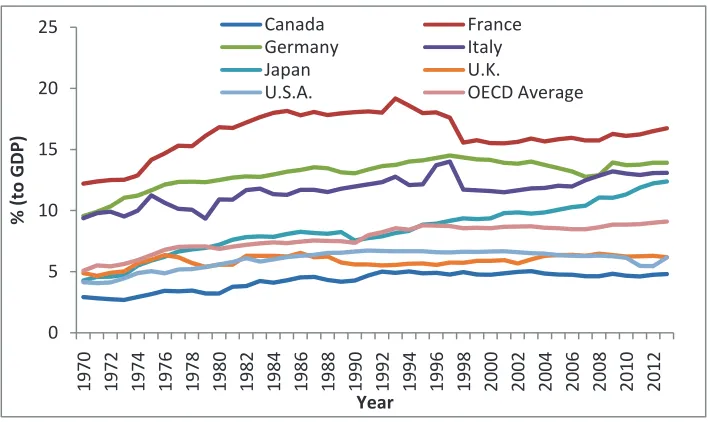
public pensions and medical services. As shown in Fig. 2, social security contributions continue increasing
in some OECD countries. Especially, in Japan, which is highest the elderly population late in the world,
social security contributions are steeply increasing.
[Insert Fig. 2 around here.]
To maintain the pension benefit, the government must raise the contribution rate for pensions: the
burden for younger people should be raised. However, without increasing the contribution rate, the
pension benefit can be raised. Fanti and Gori (2010) report that a decrease in the contribution rate for
pensions raises the pension benefit because capital accumulation is facilitated by increased saving. As
shown by the overlapping-generations model, a pay-as-you-go pension reduces savings, thereby inhibiting
capital accumulation. A decrease in the contribution rate increases capital accumulation. Consequently,
the wage rate increases. The government can collect sufficient revenue to provide pension benefits.
Other ways to increase the pension benefit without increasing the burden for younger people might
be used. A child-care policy such as a child allowance might be used. Van Groezen, Leers, and Meijdam
(2003) derive that child allowance can raise fertility. An increase in fertility increases the future number
of working people. Therefore, the pension sustainability is strong. Ab´ıo, Mahieu and Patxot (2004) and
Fenge and Meier (2005) consider an incentive policy by which the pension benefit depends on the number
As these related studies have demonstrated, some means to maintain or raise pension benefits in an
aging society with fewer children society exist. However, other policies can be considered for pensions:
monetary policies. This paper sets an endogenous growth model with money in the utility and
pay-as-you-go pension and examines how a decrease in population growth affects the income growth rate and
the inflation rate.
The main results derived by the analyses described in this paper are presented as follows. The effect
of a population growth rate decrease depends on the pension contribution rate. With a low contribution
rate, a decrease in the population growth rate raises the income growth rate. Even if a decrease in the
number of working people impedes capital accumulation because of an increase in the per-capita burden
for pension benefits, a decrease in the number of working people raises the per-capita capital stock and
raises the rate of productivity. The income growth rate increases if the latter effect is large.
This paper presents examination of the effect of monetary policy on the income growth rate and the
inflation rate. An increase in the money stock raises both the income growth rate and the inflation rate
on a balanced growth path. An increase in the inflation rate reduces the demand for money stock and
increases the demand for investment. An increase in investment raises the income growth rate because
of capital accumulation. Moreover, this paper presents derivation of an endogenous monetary policy.
Given a high replacement rate of the pension, a decrease in the population growth rate reduces the
income growth rate. Nevertheless, by virtue of an increase in money stock, the income growth rate can
be constant. Even if a decrease in population growth and the burden for pensions increases, appropriate
monetary policy measures can cancel the negative effects on the income growth rate.
Some studies related to monetary policy exist. Mino and Shibata (1995) examine how monetary policy
affects the income growth rate. In addition, Chang, Chen and Chang (2013) describe their examination
of how monetary policy affects the income growth rate and welfare in an endogenous growth model. Heer
and Maußner (2012) refer to the effects on income inequality. Bhattacharya, Haslag, and Martin (2009)
derive an optimal monetary policy. Gregorio (1993) also refers to an optimal monetary policy.
As derived herein, Corneo and Marquardt and Ono (2010) show that a pay-as-you-go pension reduces
Yakita (2006) sets an endogenous growth model with monetary policy and examines how increased life
expectancy affects the income growth rate and the inflation rate. Depending on the parameter conditions,
the effects of increased life expectancy on the income growth rate and the inflation rate are determined.
No report in the relevant literature describes consideration of monetary policy in a pay-as-you-go
pension model. This paper presents a derivation showing that the effect of fewer children on the income
growth rate depends on the contribution rate for pensions.
The remainder of this paper presents the following. Section 2 explains the model setting. Section 3
derives the equilibrium. Section 4 presents examination of the respective effects of fewer children on the
income growth rate and the inflation rate. Section 5 describes derivation of monetary policy measures
that might be used to maintain the income growth rate or the inflation rate. The final section concludes
this paper.
2
The Model
Three types of agents exist in this model economy: households, firms, and a government. This model
economy is assumed as a two-period overlapping-generations model.
2.1
Household
Individuals in the household live in two periods: young and old. In any t period, younger people and
the older people exist simultaneously. Younger people supply labor inelastically according to units of
time. The individuals in the household care about consumption during the younger period c1t, the
consumption in older periodc2t+1, and the real money stock per capitamt. These variables are assumed
as real variables. The utility function in this paper is assumed as the following log utility function with
money in the utility as assumed by Sidrauski (1967), Walsh (2010) and others
ut=αlnc1t+ (1−α) lnmt+ρlnct+1, 0< α <1, 0< ρ <1. (1)
In that equation, αdenotes the preference for money. Small αshows that the preference for money is
large. Also, ρdenotes the discount factor. During the young period, households supply labor to obtain
the real wage incomewt and pay the burden for public pensionτtwt, whereτt denotes the contribution
rate for pension.1 In the older period, the older people can receive the real pension benefitZ
t+1. Then,
the budget constraint in the young period is
st= (1−τt)wt−c1t−mt, (2)
wherestdenotes the real savings.2 The budget constraint in old period is
c2t+1= (1 +rt+1)st+ mt
1 +πt
+Zt+1, (3)
where 1+πtand 1+rt+1respectively denote inflation rate betweentandt+1 period and the real interest
rate.3 Then, using (2) and (3), lifetime budget constraint can be derived as
c1t+ c2t+1
1 +rt+1
= (1−τt)wt−
1− 1
(1 +rt+1)(1 +πt)
mt+ Zt+1
1 +rt+1
. (4)
The optimal allocations to maximize the utility function (1) subject to budget constraint (4) are derived
as
c1t= α
1 +ρ
(1−τt)wt+ Zt+1
1 +rt+1
, (5)
c2t+1 =
ρ(1 +rt+1)
1 +ρ
(1−τt)wt+ Zt+1
1 +rt+1
, (6)
mt=
1−α
(1 +ρ)1−(1+r 1
t+1)(1+πt+1)
(1−τt)wt+ Zt+1
1 +rt+1
. (7)
We assume (1 +rt+1)(1 +πt)>1 to hold a positive demand for money stock.
2.2
Firms
This model includes the assumption of the final goods production function as the following equation:
Yt=Ktθ(AtLt)1−θ, 0< θ <1, (8)
where Yt denotes final goods. Final goods Yt are produced by inputting capital stock Ktand labor Lt.
At denotes the productivity. Assuming a perfectly competitive market, the real wage rate wt and the
real interest rate 1 +rt+1are given as
wt= (1−θ)AtKtθ(AtLt)−θ, (9)
1 +rt+1 =θKtθ−1(AtLt)1−θ. (10)
2AssumingP
t as the price level,Ptst = (1−τt)Ptwt−Ptc1t−Ptmt is obtained. This real budget constraint in the
young period is derived by omitting the equation byPt.
3The nominal budget constraint isP
t+1c2t+1= (1 +it+1)Ptst+Ptmt+Pt+1Zt+1. Also, it+1 denotes the nominal
interest rate. Considering 1 +rt+1 = 1+1+πit+1
t+1 (Fisher equation) and omittingPt+1, the budget constraint in the older
This paper presents consideration of the Romer type externality given by Romer (1986), i.e., At=aKLtt
is assumed. This setting is given by Grossman and Yanagawa (1993). a denotes a positive parameter.
Then, the wage rate and real interest rate are given as
wt= (1−θ)a1−θkt, (11)
1 +rt=θa1−θ, (12)
wherekt≡ KLtt. The capital stock is assumed to be depreciated in a single period.
2.3
Government
The government supplies money at the rate ofµ(>0). Assuming an aggregate money stock asMt, then
the money stock in the next period is Mt+1 = (1 +µ)Mt. mt is real money stock per capita. we can
obtainmt= PMtNtt, wherePtdenotes the price level intperiod andNtdenotes the total population size of
younger people intperiod. Then, the older population size isNt−1intperiod. Assuming the population
growth rate as Nt+1
Nt = 1 +n, then the dynamics of money stockmt is
mt+1= 1 + µ
(1 +πt)(1 +n)
mt. (13)
The government can use seigniorage when issuing currency. The analyses in this paper subsume that the
seigniorage is used for non-productive government expenditure.
In addition to the money supply, the government runs a pay-as-you-go pension system. The
govern-ment collects revenue from younger people at the contribution rate τt and provides pension benefit Zt
for older people. Now, considering balanced budget constraint,Ztis assumed as presented below:
Zt=ǫwt. (14)
Therein, ǫ represents the replacement rate of pension (0 < ǫ < 1). The government collects the tax
revenue to provide fixed pension benefitǫwt, such as a defined benefit pension. Then, the pension benefit
isNtτtwt=Nt−1ǫwt, i.e., the following equation is reduced as
τ= ǫ
1 +n. (15)
The analyses in this paper assume that the contribution rate is constant over time. The contribution
growth rate. This paper presents consideration of the defined benefit pension. Such an increase in the
burden might occur in OECD countries. In Japan, the contribution rate for pension continues increasing
because of an aging society.4
3
Equilibrium
The equilibrium of this model economy can be specified by three market equilibria of the monetary
market, labor market, and capital market. Because of the inelastic labor supply, Nt = Lt and (11)
provide the labor market equilibrium.
The capital market equilibrium is derived as Kt+1 = Ntst, i.e., (1 +n)kt+1 = st. st is given as
st= (1−τ)wt−c1t−mt. Then, with (5), (7), (11), (12), (14), and (15), the dynamics of capital stock
per capitaktis derived as shown below:
kt+1 kt
=
1 +ρ−α− 1−α
1−(1+r)(1+1 πt)
1−1+ǫn(1−θ)a1−θ
(1 +n)(1 +ρ) +1−θ
θ
α+ 1−α
1−(1+r)(1+1 πt)
. (16)
This paper presents consideration of the equilibrium of balanced growth path. Now, when the growth
rate is defined as 1 +g (g >0), both the growth rate of capital stock per capita kt+1
kt given by (16) and
that of mt+1
mt given by (13) are equal to 1 +g.
5 Considering (7), (9), (14), and (15), the ratio of mt
kt is
given as
mt kt
= 1−α (1 +ρ)1−(1+(1+r)(1+n)π
t)
1− ǫ
1 +n
(1−θ)a1−θ+ǫ(1−θ)(1 +g)
θ
. (17)
In the balanced growth path with constant inflation rate π, mt
kt is also constant. Then, the growth rate
of mt+1
mt is 1 +g.
4
Fewer Children Society
This section presents an examination of how fewer children, i.e., a decrease in population growth rate
affects the income growth rate and inflation rate. The income growth rate 1 +gand the inflation rateπ
4In Japan, the contribution rate continues increasing to 18.3% by 2017.(Data: Ministry of Health, Labour and Welfare,
Japan)
5Considering (13) and (16), 1 +g=
1+ρ−α− 1−α
1−
(1+g)(1+n)
(1+r)(1+µ)
1− ǫ
1+n
(1−θ)a1−θ
(1+n)(1+ρ)+1−θ
θ
α+ 1−α
1−(1+(1+g)(1+n)
r)(1+µ)
is reduced. The growth rate 1 +gcan
in balanced growth path are given as
1 +g=
1 +ρ−α− 1−α
1−(1+r)(1+1 π)
1−1+ǫn(1−θ)a1−θ
(1 +n)(1 +ρ) +1−θ θ
α+ 1−α
1−(1+r)(1+1 π)
, (18)
1 +g= 1 +µ
(1 +π)(1 +n). (19)
Total differentiation of (18) and (19) by g, π and n at the balanced growth path reduces the following
equations as6
φ1−φ2
1 1+g
1+π dg dn dπ dn = φ3
−1+1+ng
,
where
φ1 = (1 +n)(1 +ρ) +
1−θ
θ α+
1−α
1−(1+r)(1+1 π)
!
>0,
φ2 = 1
−α
1−(1+r)(1+1 π)
2
1−θ
(1 +r)(1 +π)2
1 +g θ +a
1−θ
1− ǫ
1 +n
>0,
φ3 = 1 +ρ−α−
1−α
1−(1+r)(1+1 π)
!
ǫ(1−θ)a1−θ
(1 +n)2 −(1 +ρ)(1 +g).
The effects of decreased population growth (fewer children) on the income growth rate and inflation rate
in the balanced growth path are
dg dn =
1+g
1+πφ3−
1+g
1+nφ2
det , (20)
dπ dn =
−1+1+g
nφ1−φ3
det , (21)
where det = 1+1+gπφ1+φ2 > 0. The signs of these equations are ambiguous because the sign of φ3
is ambiguous. The first term of φ3 presents the positive effect of an increase in population growth
on the income growth. An increase in population growth reduces the burden of pensions for younger
people. Then, the younger people can increase the savings. Therefore an increase in capital accumulation
facilitates income growth in an increase in population growth n. However, the second term ofφ3 shows
the negative effect of an increase in population growth on the income growth. An increase in population
growth makes the population size large and reduces the capital stock per capita. Then, the income growth
per capita 1 +gis reduced. The positive effect on income growth shows the effect of a decrease in burdens
for pension. Withoutǫ, an increase in population growth brings about negative effects on income growth.
If φ3 > 0, i.e., the positive effect on income growth is larger than the negative effect on income
growth, then an increase in population growth brings about dπ
dn <0. However, even if the sign of dπ dn
is determined, the sign of dndg remains ambiguous because of the change in demand for money mt. This
point demonstrates that the inflation rate decreases in an increase in population growthn if dπ dn <0 is
obtained. A decrease in the inflation rate increases the demand for money, as shown by (7), because of
an increase in benefits from holding money. The household decreases savingsst. Capital accumulation
decreases because they hold more cash. Actually,φ2shows the effect of the demand for money on income
growth.
Then, how does a decrease in population growth affect the income growth and the inflation rate with
a pay-as-you-go pension? I defineǫ∗ to holdφ
3= 0.7 φ3>0 and dπdn<0 is obtained ifǫ∗< ǫ <1. That
is, a decrease in population growth increases the inflation rate. However, the effect on the income growth
is ambiguous becauseφ3>0 andφ2>0.
The sign of dgdn is always negative becauseφ3 <0 if ǫ < ǫ∗. Then, a decrease in population growth
increases income growth because the workers can use more capital stock per capita. However, the sign of
dπ
dn is ambiguous becauseφ1>0 andφ3<0. Then, the proof above reduces to the following proposition.
Proposition 1 A decrease in population growth increases the inflation rate ifǫ∗ < ǫ < 1. The effect
on the income growth rate is ambiguous. A decrease in population growth raises the income growth rate
ifǫ < ǫ∗. The effect on the inflation rate is ambiguous.
A decrease in population growth has the effect of increasing the capital stock per capita. Such a result
is derived in related studies such as that of the Solow (1956) model. However, this paper includes two
other effects. One is the effect of the pension burden. A decrease in population growth raises the pension
burden for younger people because people of working generations decrease. The burden per capita must
be pulled up when the government makes the level of pension benefit for older people constant if the
working generations of people decrease. The level of pension is the replacement ratio of pensionǫ. This
negative effect of a decrease in population on the income growth is greater ifǫis larger.
The other effect is the effect via the demand for money stock. As shown byφ2, a decrease in population
growth has the effect of an increase in the inflation rate.8 This effect decreases the demand for money
and then the savings to bring about increased capital accumulation. Therefore, an increased pension
burden does not necessarily decrease the income growth rate.
Yakita (2006) examines life expectancy effects on the income growth rate and inflation rate. An
increase in life expectancy and a decrease in the population growth are substantially equivalent in terms
of processes of an aging society with fewer children. Both this paper and Yakita (2006) present the same
result: the parameter conditions determine the effects on income growth and inflation. However, this
paper presents derivation indicating that the effect is determined by the replacement rate of the pension
ǫ.
5
Monetary Policy
This section presents an examination of how monetary policy affects the income growth and inflation rate.
Moreover, the following subsection presents examination of endogenous monetary policy. Concretely, we
derive the appropriate monetary policy to maintain the income growth rate or the inflation rate in an
environment with a decreasing population growth rate. As derived in the preceding section, a decrease in
the population growth rate might give negative effects on the income growth rate. This research shows
how the government should provide the money stock in a society with fewer children.
5.1
Effect of Monetary Policy
This subsection presents effects of monetary policy on the income growth rate and the inflation rate.
Total differentiation of (13) and (16) byg, π, andµpresents the following signs:
dg dµ =
φ21+1+gµ
det >0, (22)
dπ dµ =
φ11+1+gµ
det >0. (23)
These results are intuitive. An increase in the money supply increases the inflation rate based on the
‘quantity theory of money’. An increase in the inflation rate decreases the demand for money stock.
Then, households increase savings or investment for goods. Therefore, capital accumulation is facilitated.
5.2
Endogenous Monetary Policy
This subsection derived the endogenous monetary policy to maintain the income growth rate or the
inflation rate. The income growth rate and inflation rate might change if the population growth rate
decreases. This subsection presents consideration of a policy to maintain the income growth rate or the
inflation rate by changing the money supply rateµwith a decreasing population growth raten.
First, we derive the appropriate monetary policy to maintain the income growth rate dµdg = 0. A
decrease in the income growth rate reduces the income level in the future period. The welfare of future
generations might decrease. Consequently, there exists an appropriate reason to maintain the income
growth rate. From total differentiation of (18) and (19) byπ, nandµ, the following signs are obtained:
dµ dn =−
φ3 φ2 +
1 +µ
1 +n, (24)
dπ dµ =
1 +n
1 +µ
1
1+n
1+π − φ2
φ3
. (25)
These signs are ambiguous. However, without the burden for pensionǫ,φ3is invariably negative.
There-fore, dµdn > 0 and dπ
dµ >0. However, considering a pay-as-you-go pension, the sign of dµ
dn is ambiguous.
Now, this paper presents consideration of a case for which φ3 > 0, by which a decrease in population
growth negatively affects the income growth rate by an increase in the per-capita burden for pensions. A
decrease in population growth is expected to raise the supply rate of money stock to maintain the income
growth rate if φ3
φ2 >
1+µ
1+n. A decrease in the population growth negatively affects the income growth rate
because of an increase in the pension burden. The inflation rate must be raised to recover the income
growth.
However, if φ3
φ2 <
1+µ
1+n, then a decrease in population growth can be expected to reduce the supply
rate of money stock to maintain income growth. A decrease in population has a positive effect on the
inflation rate, as shown by (19) for given 1 +g. A high inflation rate accelerates investment. Then the
income growth is higher than the initial growth rate. The supply rate of the money stock should be
reduced to prevent income growth. The inflation rate is given as (25) to maintain the income growth
rate.
Second, we derive an endogenous monetary policy to maintain the inflation rate dπ
dµ = 0. An increase
should not be raised. Total differentiation of (18) and (19) byg, n, and µgives the following signs:
dµ dn =
1+n
1+g φ3
φ1 + 1
1+n
1+µ
, (26)
dg dµ =
1+g
1+µ
1 + 1+1+ngφ1
φ3
. (27)
Here,φ3>0 is assumed. Then, both dµdg and dµdn are positive. A decrease in population growth is expected
to reduce the supply rate of money stock, as shown by (26). Considering (19), a decrease in population
growth increases the inflation rate. The money supply rate is expected to decrease, not to increase the
inflation rate. Because of a decrease in the money supply, the income growth rate is reduced because the
burden for pension increases. Then, the following proposition is established.
Proposition 2 With a decrease in population growth raten, the government sets the monetary policy
to hold (24) to maintain the income growth rate. Then, the inflation rate is changed, as shown by (25).
The monetary policy is set as (26) if the government wants to maintain the inflation rate. Then, the
income growth rate is given as (27).
Considering (24)–(27) in φ3>0, the government should adopt some policy to maintain the income
growth rate because the inflation rate might decrease. The effects of these policies are determined by the
pension replacement ratioǫ.
6
Conclusion
This paper presents an examination of how a decrease in the population growth as shown in an aging
society with fewer children affects the income growth rate and the inflation rate in the balanced growth
path in the model with money in the utility and pay-as-you-go pension. A decrease in population growth
has a positive effect on income growth because the workers can use more capital stock per capita. However,
considering the pension burden, decreased population growth negatively affects income growth. Public
pensions have a negative effect on capital accumulation, as shown by many related studies. The per-capita
pension burden decreases. Capital accumulation might increase if younger people increase in number as
a result of child care policies. The government might decrease the pension burden for younger people
policy, even if a decrease in population growth decreases the income growth rate, income growth can be
References
[1] Ab´ıo G., Mahieu G. and Patxot C. (2004) “On the optimality of PAYG pension systems in an
endogenous fertility setting,”Journal of Pension Economics and Finance vol.3(1), pp.35-62.
[2] Bhattacharya J., Haslag J. and Martin A. (2009) “Optimal monetary policy and economic growth,”
European Economic Review vol.53, pp.210-221.
[3] Chang W.-Y., Chen Y.-A. and Chang J.-J. (2013) “Growth and welfare effects of monetary policy
with endogenous fertility,”Journal of Macroeconomicsvol.35, pp.117-130.
[4] Corneo G. and Marquardt M. (2000) “Public pensions, unemployment insurance, and growth,”
Jour-nal of Public Economics vol.75, pp.293-311.
[5] Fanti L. and Gori L. (2010) “Increasing PAYG pension benefits and reducing contribution rates,”
Economics Letters vol.107, pp.81-84.
[6] Fenge R. and Meier V. (2005) “Pensions and fertility incentives,” Canadian Journal of Economics
vol.38, pp.28-48.
[7] Gregorio J. D. (1993) “Inflation, taxation, and long-run growth,” Journal of Monetary Economics
vol.31, pp.271-298.
[8] Grossman G. M. and Yanagawa, N. (1993) “Asset bubbles and endogenous growth,” Journal of
Monetary Economics vol.31(1), pp.3-19.
[9] Heer B. and Maußner A. (2012) “The burden of unanticipated inflation: Analysis of an
overlapping-generations model with progressive income taxation and staggererd prices,”Macroeconomic Dynamics
vol.16, pp.278-308.
[10] Mino K. and Shibata A. (1995) “Monetary policy, overlapping generations, and patterns of growth,”
Economica vol.62, pp.179-194.
[11] Ono T. (2010) “Growth and unemployment in an OLG economy with public pensions,”Journal of
[12] Romer P. M. (1986) “Increasing returns and long-run growth,”Journal of Political Economy vol.
94(5), pp.1002-1037.
[13] Sidrauski M. (1967) “Rational Choice and patterns of growth in a monetary economy,”American
Economic Review vol.57(2), pp.534-544.
[14] Solow R. (1956) “A contribution to the theory of economic growth,”Quarterly Journal of Economics
vol.70(1), pp.65-94.
[15] van Groezen B., Leers, T. and Meijdam L. (2003) “Social security and endogenous fertility: pensions
and child allowances as Siamese twins,”Journal of Public Economics vol.87(2), pp.233-251.
[16] Walsh C.E. (2010) ”Monetary theory and policy, third edition,” MIT Press, Cambridge,
Mas-sachusetts, London, England.
[17] Yakita A. (2006) “Life expectancy, money, and growth,” Journal of Population Economics vol.19,
Appendix
The derivation of the signs
Total differentiation of (18) and (19) byg, π, n, andµ, the following equations are derived,
φ1dg−φ2dπ=φ3dn,
dg=−1 +g
1 +ndn−
1 +g
1 +πdπ+
1 +g
1 +µdµ.
Settingdµ= 0, (20) and (21) are derived. Setting dn= 0, (22) and (23) are derived. Settingdg = 0,
(24) and (25) are derived. Settingdπ= 0, (26) and (27) are derived.
The growth rate in balanced growth path
Considering (13), (16), and 1 +g= kt+1
kt =
mt+1
mt , the following equation is obtained as
1 +g=
1 +ρ−α− 1−α
1−(1+(1+gr)(1+)(1+nµ))
1−1+ǫn(1−θ)a1−θ
(1 +n)(1 +ρ) +1−θ
θ
α+ 1−α
1−(1+(1+gr)(1+)(1+nµ))
.
DefiningL= 1 +g andR=
1+ρ−α− 1−α
1−
(1+g)(1+n) (1+r)(1+µ)
(1−1+ǫn)(1−θ)a
1−θ
(1+n)(1+ρ)+1−θ
θ
α+ 1−α
1−
(1+g)(1+n) (1+r)(1+µ)
,LandRhas a unique intersect and
the growth rate in balanced growth path 1 +g∗ is obtained, as shown in Fig. 3.
[Insert Fig. 3 around here.]
The sign of
φ
3This appendix shows the sign ofφ3. I define the following equations:
¯
L= 1 +ρ−α− 1−α
1−(1+r)(1+1 π)
!
ǫ(1−θ)a1−θ
(1 +n)2 , (28)
¯
R= (1 +ρ)(1 +g). (29)
¯
Lincreases with an increase inǫ. ¯Rdecreases with an increase inǫbecause an increase inǫreducesgas
shown in Fig. 1. The sign ofφ3is negative because ¯L <R¯ ifǫ= 0. I think that the range ofǫis between
0 to 1 +nnot to be negative saving. ¯L >R¯ because ¯R becomes zero if ǫ= 1 +n. I can obtainφ3>0
andǫ∗ to holdφ
3= 0 in 0< ǫ <1 +n.
0 5 10 15 20 25 30 1 9 7 0 1 9 7 2 1 9 7 4 1 9 7 6 1 9 7 8 1 9 8 0 1 9 8 2 1 9 8 4 1 9 8 6 1 9 8 8 1 9 9 0 1 9 9 2 1 9 9 4 1 9 9 6 1 9 9 8 2 0 0 0 2 0 0 2 2 0 0 4 2 0 0 6 2 0 0 8 2 0 1 0 2 0 1 2 % Year Canada France Germany Italy Japan U.K. U.S.A.
0 5 10 15 20 25 1 9 7 0 1 9 7 2 1 9 7 4 1 9 7 6 1 9 7 8 1 9 8 0 1 9 8 2 1 9 8 4 1 9 8 6 1 9 8 8 1 9 9 0 1 9 9 2 1 9 9 4 1 9 9 6 1 9 9 8 2 0 0 0 2 0 0 2 2 0 0 4 2 0 0 6 2 0 0 8 2 0 1 0 2 0 1 2 % (t o G D P ) Year Canada France Germany Italy Japan U.K.
[image:19.595.76.431.88.299.2]U.S.A. OECDAverage
L, R
1 +g L
R
1 +g∗ (1+µ)(1+r)
[image:20.595.218.398.82.260.2]1+n ǫ↑
Fig. 3: Growth rate in balanced growth path.
ǫ
¯
L,R¯
¯
L
1 +n ǫ∗
¯
R
[image:20.595.220.385.334.507.2]