Effect of High Magnetic Field Annealing on Microstructure
and Texture at the Initial Stage of Recrystallization
in a Cold-Rolled Interstitial-Free Steel
Yan Wu
1;*1, Xiang Zhao
1;*2, Chang-Shu He
1, Yu-Dong Zhang
1,
Liang Zuo
1and Claude Esling
21Key Laboratory for Anisotropy and Texture of Materials (Ministry of Education),
Northeastern University, Shenyang 110004, P. R. China
2LETAM, CNRS-UMR 7078, University of Metz, Ile du Saulcy, 57045 Metz, Moselle, France
The effects of magnetic field annealing on microstructure and texture evolution at the initial stage of recrystallization in as-annealed interstitial-free (IF) steel sheet were investigated by the orientation imaging microscopy (OIM) and microhardness testing. The magnetic field annealing was conducted in a 12-tesla magnetic field at 650C for different time spans (0, 10 and 30 min) to obtain partially recrystallized microstructure in specimens. It was found that the magnetic field annealing retarded the recrystallization process, and favoured the development ofh110itexture components at the initial stage of recrystallization. Additionally, it is worth noting that, in the case of annealing for 10 min, we observed more pronouncedf111gh123icomponent associated with coarse grains in the magnetic field annealed specimen, which may suggest that this component was favoured by the applied high magnetic field in the early stage of nucleation and growth.
[doi:10.2320/matertrans.MI200707]
(Received May 1, 2007; Accepted July 9, 2007; Published October 25, 2007)
Keywords: high magnetic field, texture, recrystallization, nucleation, orientation imaging microscopy (OIM), interstitial-free (IF) steel
1. Introduction
As an important external field, it has been evidenced experimentally that magnetic field can affect the develop-ment of recrystallization and recrystallization texture in plastically deformed metallic materials,1–9) especially in
ferromagnetic materials.1–7)While for ferromagnetic
materi-als, the study of magnetic field annealing on recrystallization and texture evolution in silicon steel sheet and IF deep-drawing steel sheet has been an object of great attention. As reported else where,6,7)the research work of high magnetic
field annealing on recrystallization and texture evolution in IF steel sheet was mainly focused on the grain growth stage, by changing the annealing temperatures at a range of 650850C, and the holding time at an annealing
temper-ature (750C) near Curie point. The results show that the
recrystallization and the subsequent grain growth were retarded by the magnetic field annealing, and the recrystal-lization texture development was retarded to some extent, too. However, there are still several interesting issues remain to be studied. Undoubtedly, much work is still required to understand the underlying mechanism of high magnetic field inducing crystal orientation during the stage of nucleation and growth in IF steel sheet. So in the present paper, we particularly report the effects of high magnetic field anneal-ing on microstructure and recrystallization texture in a cold-rolled IF steel sheet at the initial stage of recrystallization.
2. Experimental
The material used was a 76% cold-rolled IF steel sheet of 1 mm thickness, having the chemical composition of
(mass%): 0.0023C, 0.056Ti, 0.014Si, 0.16Mn, 0.011P, 0.0064S, 0.052Al, 0.0018N. Specimens with the dimensions of 20mm10mm1mm were respectively subjected to isothermal annealing at 650C for different time (0, 10 and 30 min) in a furnace installed in a cryocooler-cooled super-conducting magnet at a heating rate of 5C/min, with and
without a 12-tesla magnetic field, and then cooled in the furnace. During the magnetic field annealing, a magnetic field was kept being applied in the whole heating and cooling processes. The specimens were placed at the center of the applied field with their rolling direction (RD) paralleling to the magnetic field direction (MD). The experimental setup is schematically shown in Fig. 1.
Microstructures of longitudinal sections of the specimens were examined by orientation imaging microscopy (OIM). In the maps, the recrystallized grains are highlighted (dark grains). The scan was carried out over the area of1191878 measuring points with a 0.07mm step size, and the corre-sponding ODFs were calculated using the Channel 5
Field Center Ar
Cooling Water
Specimen
TD RD MD
Furnace Cooling Water
Pt Heater
Magnet
Pt-Rh Thermocouple
Specimen Holder
Water-Cooled Jacket
Ar
Fig. 1 Schematic illustration of high magnetic field annealing equipment.
*1Graduate Student, Northeastern University
*2Corresponding author, E-mail: [email protected]
[image:1.595.325.525.617.766.2]software. The microhardness of the annealed specimens was made on their longitudinal sections with 50 g load and a holding time of 15 s. The average microhardness of each specimen was taken from 10 measurements.
3. Results and Discussion
3.1 Effects of high magnetic field annealing on micro-structure evolution
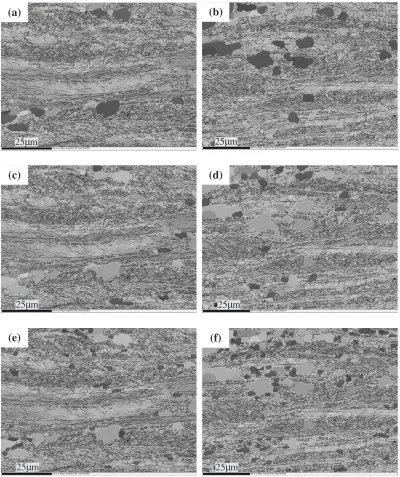
Figure 2 shows the microstructures of longitudinal sec-tions of the specimens annealed at 650C holding for
different time. In these OIM maps, both the rolling direction and the magnetic field direction are horizontal. The {111} oriented deformation bands (white color regions) in the maps are plotted with 15orientation spread from the exact {111} orientation. The relatively dark grains in Figs. 2(a), (b), (c),
(d) are the recrystallized nuclei and grains, which are surrounded by grain boundaries with misorientation over 10 and the misorientation in regions is less than 1. As
Figs. 2(a) and (b) show, in the case of holding for 0 min, there are many strong deformation bands retained in both the field and non-field annealed specimens, and only limited recrystal-lized nuclei can be observed among the {111} oriented deformation bands. When the holding time is 10 min (Figs. 2(c) and (d)), the retained deformation bands in the non-field annealed specimen are much smaller than in the field annealed specimen, correspondingly, the number of recrystallized nuclei in the former is also much more than the latter. Besides, from Figs. 2(c) and (d) we also can see that the recrystallized nuclei in both the field and non-field annealed specimens nucleated in {111} oriented deformation bands, which is also found in the work of Quadir10) and
(e)
(c)
(a)
25 mµ
25 mµ
100 mµ
(f)
(d)
(b)
100 mµ 25 mµ 25 mµ
[image:2.595.101.498.72.545.2]Tse,11)since the deformed {111} orientations display higher
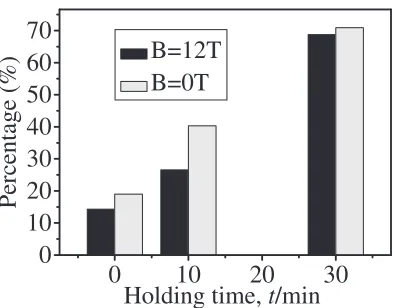
stored energy and fairly sharp orientation gradient, and are capable of providing the necessary geometrical conditions for nucleation and recrystallization. When the annealing time was further extended to 30 min, a lot of recrystallized grains appear in the annealed specimens, but the recrystallized grains in non-field annealed specimen are much larger than those in the field annealed specimen, as seen in Figs. 2(e) and (f). The quantitative comparison of their area percentage of recrystallized regions is shown in Fig. 3. It is obvious that the area percentage of recrystallized regions in all field-annealed specimens is lower than in the corresponding non-field annealed specimens. This is accordance with the microhard-ness results shown in Fig. 4. It is evident that, with the increasing of holding time, the microhardness of both field and non-field annealed specimens decreased remarkably, but the microhardness of field-annealed specimens is all higher than that of the corresponding non-field annealed specimens. The above results indicate that the magnetic field retards the recrystallization process.
So far, how a high magnetic field influences recrystalliza-tion is still unclear. As pointed elsewhere,12–15)the possible mechanisms might be related to magnetically ordered state and domain wall rearrangement induced by magnetic field, which are considered as two main factors affecting atomic diffusion and grain boundary migration. Anyway, for
iron-based alloys, the retardation of recrystallization by magnetic field application is known as a common feature of magnetic field annealing.16)
[image:3.595.72.269.69.223.2]3.2 Effects of high magnetic field annealing on texture evolution
Figure 5 shows the ODF 2¼45 sections of all
re-crystallized grains in annealed specimens holding for differ-ent time. Figure 6 displays the ODF 2¼45 section of
Bunge’s Euler space and the major orientation components along the (h110i==RD) and (h111i==ND) fibers. As Figs. 5(a) and (d) show, in the case of holding for 0 min, the orientation of recrystallized nuclei determined in the non-field annealed specimen is mainly f111ghuvwi, while it is a little different for the field annealed specimen, i.e. the orientation of the recrystallized nuclei is mainly consist of strongf110gh110iand weakf111ghuvwicomponents. In the case of holding for 10 min, the recrystallized grains in non-field annealed specimen exhibit a strongfiber texture with intensity peaks between f111gh123i and f111gh110i (Fig. 5(b)), while for the field annealed specimen, the orientation of the recrystallized grains mainly have strong
f111gh123iand weak {hkl}h110itextures (Fig. 5(e)). When
the annealing time was further extended to 30 min, the orientations distribution of recrystallized grains in field and non-field annealed specimens display similar morphologies with intensity peak at f111gh112i (Fig. 5(c), (f)), while for the field annealed specimen, the intensity of f111gh112i component is relatively lower than that of the non-field
0
0
10
20
30
40
50
60
70
Percentage (%)
Holding time, t/min
B=12T
B=0T
30
20
10
Fig. 3 Area percentage of recrystallized regions in the specimens annealed at 650C.
0
100
120
140
160
180
200
HV
Holding time, t/min
B=12T
B=0T
30
20
10
Fig. 4 Microhardness of the specimens annealed at 650C.
Fig. 5 ODF 2¼45 sections for the recrystallized grains of the specimens annealed at 650C: (a) 0T0min; (b) 0T10min; (c) 0T30min; (d)12T0min; (e)12T10min; (f)12T30min.
[image:3.595.311.541.72.190.2] [image:3.595.323.527.250.398.2] [image:3.595.69.268.279.433.2]annealed specimen. In addition, a texture component of
f443gh110i, which belongs to thefiber, is observed for the
field annealed specimen. Arrows in Figs. 5(d), (e) and (f) show the {hkl}h110i texture components determined in the field annealed specimens which are not visible in the ODFs of the non-field annealed specimens. The above results obvi-ously indicate that high magnetic field annealing favoured the development ofh110itexture components at the initial stage of recrystallization.
It is known that Magnetic field could lower the Gibbs free energy of differently orientated grains according to their magnetization. As a sequence, the changes of magnetic field free energy (G) affecting grains with h100i, h110i and
h111i orientations parallel to the direction of the magnetic
field (MD) can be written in the following sequence:13)
jGh111ij<jGh110ij<jGh100ij ð1Þ
Obviously, the free energy of the grains with h100i orientation parallel to the magnetic field is the lowest, and they have the largest driving force for recrystallization, then
the h110i oriented grains, and the h111i oriented grains.
While for the IF steel sheet investigated in this study, no measurable orientation intensity at {hkl}h100i was deter-mined before and after annealing, which suggests that nucleation of grains withh110iorientation become the most preferred during magnetic field annealing. Therefore, when the magnetic field direction parallel to the specimens’ rolling direction, at the initial stage of recrystallization, the h110i
(f)
(d)
(c)
(e)
(b)
(a)
25 mµ
25 mµ
25 mµ 25 mµ
25 mµ 25 mµ
[image:4.595.98.498.71.548.2]oriented nuclei are considered to be energetically favored, which make the nucleation and growth of h110i oriented nuclei in field annealed specimens become easier than that in the non-field annealed specimens. Besides, the selected annealing temperature of 650C is slightly over the
recrys-tallization temperature and lies within the ferromagnetic temperature range far from the Curie point, which might make the preferred orientation mechanism induced by magnetic free energy anisotropy play an important role in recrystallization nucleation.
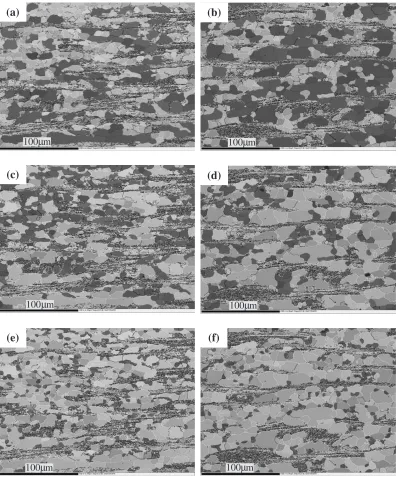
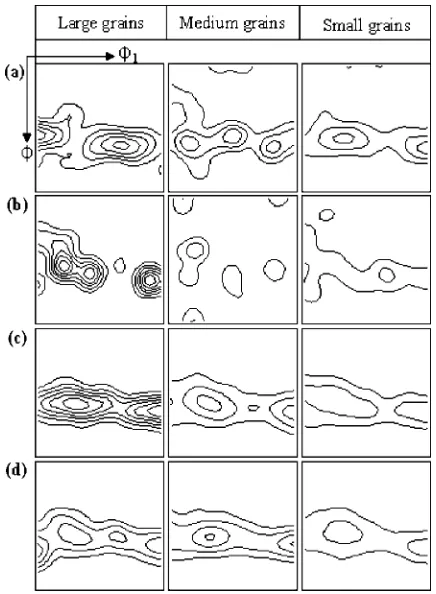
We further investigated orientation features among the large, medium and small recrystallized grains in field and non-field annealed specimens. Figure 7 and Figure 8 show the OIM (Band Contrast + Grain boundary) maps of
annealed specimens holding for 10 and 30 min, respectively. The dark color grains in the maps are the recrystallized grains with different size. The corresponding ODF 2¼45 sections of those recrystallized grains are shown in Fig. 9. It can be seen that, in the case of holding for 10 min without field (Fig. 9(a)), thef111gh110i,f111gh123iandf111gh112i orientations are respectively associated with the large, medium and small recrystallized grains. However, it is obviously different when applying the high magnetic field. After holding for 10 min in high magnetic field (Fig. 9(b)), the large recrystallized grains display a much stronger texture
at f111gh123i orientation. The medium and the small
recrystallized grains exhibit much weak textures, with intensity peak atf111gh123iandf111gh112i, respectively.
(f)
(e)
(d)
(c)
(b)
(a)
100 mµ
100 mµ 100 mµ
100 mµ 100 mµ
100 mµ
[image:5.595.100.498.71.551.2]When the holding time is 30 min (Fig. 9(c), (d)), all the recrystallized grains with different size determined in field and non-field annealed specimens exhibit a -fiber texture with intensity peak atf111gh112i.
In cold-deformed IF steel sheet, f111gh110i, f111gh123i
andf111gh112i are the main texture components of-fiber
texture. According to the research work of Takechiet al.17)
and Rajmohan et al.18) on the stored energy in particular
orientations in cold rolled IF steel, the stored energy in the deformed regions of f111gh112i orientation is higher than that in the regions off111gh110iandf111gh123iorientations. Consequently, nucleation occurs in f111gh112i oriented deformed matrix is considered to be energetically favored. Additionally, in iron,19)f111gh110i oriented crystals have a better 30h111i orientation relationship with f111gh112i oriented matrix (P13b CSL grain boundary). In general terms,PCSL grain boundaries have lower interface energy than random grain boundaries. So, at the initial stage of recrystallization, f111gh110i oriented nuclei will prefer to grow in f111gh112i oriented deformation matrix. Based on the above discussions, it is reasonable to speculate that the
f111gh110i oriented nuclei are very likely to develop into
coarse grains with the same orientation in a certain recrystallization stage. In the present study, the case of the non-field annealed specimen displays strong f111gh110i texture associate with large grains after holding for 10 min (Fig. 9(a)), which implies that this component nucleate earlier and have more time to grow as compared with other texture components. In the case of magnetic field annealing, the coarse grains are of strongf111gh123itexture component,
which suggests that the nucleation and growth of this component are favored by the applied high magnetic field during the initial stage of recrystallization.
It is known that, when applying a high magnetic field, the change of Gibbs energy of a grain depends on its orientation. Generally, the magnetocrystalline anisotropy energy Ek
(Jm3), which is the extra work required to turn the atomic spins from a nearby easy axis to the magnetic field direction, is given, for bcc metals, by the following equation:
Ek¼K1ð1222þ2232þ3212Þ þK2122232
þK3ð1222þ2232þ3212Þ2þ ð2Þ
Where, K1, K2, K3 is the magnetocrystalline anisotropy constant, and1,2,3 are the directional cosines between magnetization intensity M and three crystallographic axes. Usually, only K1 and K2 items are considered. Then, the results of calculation are
Ekh110i¼K1=4; ð1¼2¼1=
ffiffiffi
2 p
; 3¼0Þ;
Ekh123i¼K1=4þ9K2=686;
ð1¼1=
ffiffiffiffiffi
14 p
; 2 ¼2=
ffiffiffiffiffi
14 p
; 3 ¼3=
ffiffiffiffiffi
14 p
Þ:
For iron,K1ð104Þ>0,K2ð103Þ<0. So the sequence of magnetocrystalline anisotropy energy of grains with different orientations is as follows:
Ekh123i<Ekh110i ð3Þ
As a consequence, the changes of magnetic field free energy (G) affecting grains withh123i,h110iorientations paralleling to the direction of the magnetic field (MD) can be written in the following sequence:
jGh110ij<jGh123ij ð4Þ
Obviously, the free energy of the nuclei with h123i orientation paralleling to the magnetic field was lower. Thus, they have much larger driving force for nucleation and growth than nuclei with h110i orientations, which might explain why thef111gh123itexture component, as compared
with f111gh110i texture component, was favoured by the
magnetic field in the early stage of nucleation and growth.
4. Conclusion
A high magnetic field of 12-tesla was applied during annealing of cold-rolled IF steel sheet with the magnetic field direction paralleling to the rolling direction at 650C. It was
found that the magnetic field annealing retarded the recrys-tallization process, and favoured the development ofh110i texture components at the initial stage of recrystallization. It is worth noting that, as compared with f111gh110i texture component,f111gh123itexture component was favoured by magnetic field in the early stage of nucleation and growth.
Acknowledgements
This work was supported by the Liaoning Provincial Science and Technology Foundation of China (Grant No. 20051015), the National Science Found for Distinguish-ed Young Scholars (Grant No. 50325102), the key project of National Natural Science Foundation of China (Grant Fig. 9 ODF2¼45 sections of different size recrystallized grains in
[image:6.595.60.278.71.368.2]No. 50234020), the National Natural Science Foundation of China (Grant No. 50501006), and the ‘‘111’’ Project (Grant No. B07015).
The authors would like to appreciate the support of the Center for Materials Analysis and Testing and the High Magnetic Field Laboratory of Northeastern University for providing the facilities.
REFERENCES
1) R. Smoluchowski and R. W. Turner: J. Appl. Phys.20(1949) 745–746. 2) V. S. Bhandary and B. D. Cullity: Trans. Metall. Soc. AIME224(1962)
1194–1200.
3) H. O. Martikainen and V. K. Lindroos: Scand. J. Metall.10(1981) 3–8. 4) T. Watanabe, Y. Suzuki, S. Tani and H. Oikawa: Philo. Mag. Lett.62
(1990) 9–17.
5) N. Masahashi, M. Matsuo and K. Watanabe: J. Mater. Res.13(1998) 457–461.
6) C. S. He, Y. D. Zhang, X. Zhao, L. Zuo, J. C. He, K. Watanabe, T. Zhang, G. Nishijima and C. Esling: Adv. Eng. Mater.5(2003) 579– 583.
7) C. S. He, Y. D. Zhang, X. Zhao, L. Zuo and C. Esling: Mater. Sci. Forum495–497(2005) 465–470.
8) D. A. Molodov, S. Bhaumik, X. Molodova and G. Gottstein: Scripta Mater.54(2006) 2161–2164.
9) S. Bhaumik, X. Molodova, D. A. Molodov and G. Gottstein: Scripta Mater.55(2006) 995–998.
10) M. Z. Quadir and B. J. Duggan: Acta Mater.54(2006) 4337–4350. 11) Y. Y. Tse and B. J. Duggan: Metall. Mater. Trans.37A(2006) 1055–
1064.
12) F. S. Buffington, K. Hirano and M. Cohen: Acta Metall.9(1961) 434– 439.
13) H. O. Martikainen and V. K. Lindroos: Scand. J. Metall.10(1981) 3–8. 14) S. Nakamichi, S. Tsurekawa, Y. Morizono, T. Watanabe, M. Nishida
and A. Chiba: J. Mater. Sci.40(2005) 3191–3198.
15) K. Kawahara, Y. Ando, K. Nogiwa, Y. Yagyu, S. Tsurekawa and T. Watanabe: Ann. Chim. Sci. Mat.27Suppl 1 (2002) S269–S278. 16) T. Watanabe, S. Tsurekawa, X. Zhao and L. Zuo: Scripta Mater.54
(2006) 969–975.
17) H. Takechi, H. Katoh and S. Nagishima: Trans AIME242(1968) 56– 59.
18) N. Rajmohan, Y. Hayakawa, J. A. Szpunar and J. H. Root: Acta Mater. 45(1997) 2485–2494.