Structural and Thermoelectric Properties of Rare-Earth-Substituted Sr
3Fe
2O
7Hirofumi Kakemoto, Masahiko Ishikawa, Jiyo Yazaki and Hiroshi Irie
+Clean Energy Research Center, University of Yamanashi, Kofu 400-8511, Japan
The structural and thermoelectric properties of rare-earth (Sm)-substituted RuddlesdenPopper-type Sr3Fe2O7, Sr3¹xSmxFe2O7(SSFO, x=0, 0.1, 0.15), were investigated by measuring the temperature dependence of its crystallographic parameters, electrical conductivity, and Seebeck coefficient (S). A sharp increase in electrical conductivity (·) up to 60 S/cm (log·=1.78 S/cm) at 400500°C occurred as a result of oxygen reduction in thex=0 sample.Svalues changed from negative to positive with increasing temperature, presumably due to the increase in the number of oxygen vacancies, resulting in Fe ion hopping conduction. The introduction of Sm increased bothSand·, and the power factor of the oxide prepared withx=0.1 was approximatelyfivefold higher than that of the oxide withx=0. [doi:10.2320/matertrans.E-M2013821]
(Received February 27, 2013; Accepted July 8, 2013; Published August 30, 2013)
Keywords: RuddlesdenPopper structure, Sr3¹xRExFe2O7, Sm, oxygen vacancy, electrical conductivity, Seebeck coefficient, power factor
1. Introduction
Thermoelectric materials have the potential to recycle exhausted heat energy and are expected to be used to generate clean energy without polluting the environment. Thermal-electric conversion efficiency is represented by a dimensionlessfigure of merit,ZT=S2·T/¬, whereS,·and ¬ denote the Seebeck coefficient and electrical and thermal conductivities, respectively. According to classical semi-conductor theory, heavily doped semisemi-conductors with a carrier concentration (c) of³1019cm¹3 are suitable high-ZT materials,1) whereas metallic materials are not. Thus, the discovery of a largeS(³100 µV/K at 300 K) for NaxCoO2, a p-type oxide material that exhibits a metallic · with ac of ³1021cm¹3, has attracted considerable attention regarding the origin of its high ZT.2)Since this discovery, a series of misfit-layered cobaltites have been reported to be p-type thermoelectric oxides.37)
N-type thermoelectric oxides, which are required for use with p-type oxides to construct thermoelectric power generation modules, have been developed using perovskite-type materials and their related oxides. For example, heavily carrier doped SrTiO3 has been intensively inves-tigated because its value of c is over ³1021cm¹3. It also exhibits a rather large S owing to its large carrier effective mass (m*).810) However, the ZT values of such SrTiO
3 systems are still too low for practical applications (ZT>1). To overcome this demerit, an artificial superlattice has been designed and fabricated.11) By analogy with this, SrO(SrTiO3)n(n=integer) with a RuddlesdenPopper (RP)
structure in natural superlattices has been focused on. In general, an RP structure has the formula AO(ABO3)n
(An+1BnO3n+1, n=integer). The series of RP structures have a crystal structure in which distorted NaCl-type AO (rock salt) layers are interleaved with perovskite (ABO3)n
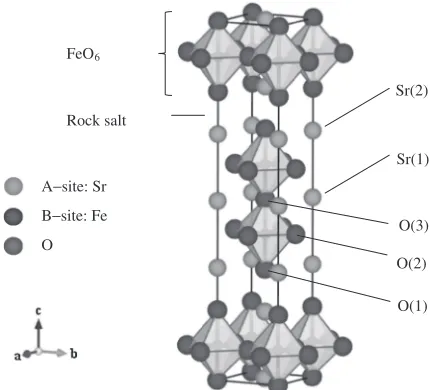
blocks along the c-axis, as shown in Fig. 1. Lee et al. investigated Nb-doped SrO(SrTiO3)nsamples (n=1, 2) and
clearly demonstrated their higher S than that of simple perovskite-type SrTiO3.12) To further increase S, the same group introduced symmetric TiO6 octahedra by introducing counterdopants at the Sr site. They restored the TiO6
octahedra to a higher symmetry and demonstrated the enhancement ofS.1315)
In this study, we focused on SrO(SrFeO3)n (n=2,
Sr3Fe2O7, SFO) as one of the RP-type structures. The ionic and electronic conductivities and magnetism have been investigated for SFO and metal-doped SFO with oxygen nonstoichiometry (Sr3Fe2O7¹¤).1626)The central oxygen O(3) site in Fig. 1 is generally unstable and has an oxygen vacancy.20,25,26) So far, there have been no reports on the value of S values of SFO-based materials. In contrast, Poulsenet al.reported the values ofSfor SrFeO3(n=¨in SrO(SrFeO3)n) and metal-doped SrFeO3.27,28) In the case of
SrFeO3 and La-doped SrFeO3, S changed from negative to positive at ³500°C, and was ³120 µV/K at 1000°C. By combining the results for S with those of · measurements, they concluded that the increase in S from negative to positive with increasing temperature was caused by the generation of oxygen vacancies, resulting in enhanced hopping conduction from Fe4+ to Fe3+. The number of oxygen vacancies was lower at lower temperatures, and thus the intrinsic conduction mechanism dominated, resulting in the negative value ofS.
A−site: Sr
B−site: Fe
O
Rock salt FeO6
O(3)
O(1) O(2) Sr(1) Sr(2)
Fig. 1 Structure of RuddlesdenPopper-type oxide Sr3Fe2O7 (An+1Bn
-O3n+1,n=2).
[image:1.595.319.534.278.473.2]By analogy with SrO(SrTiO3)n, we expect that layered
SFO will have a higher S than simple SrFeO3. When introducing a foreign element at the Sr site in SFO, we also anticipate that the number of oxygen vacancies will increase owing to the low crystal stability at higher temperatures, resulting in higher hopping conduction. Although based on the principles of hopping conduction, S is predicted to be nearly temperature independent, however, the increase in S values with increasing temperature (with higher hopping conduction) was reported in (Ca,Bi)Co4O9, (Ca,Bi)MnO3and other oxides.29,30)Thus, we can expect the higherSat higher temperatures. In addition, the increases in the number of oxygen vacancies and the amount of lattice distortion induced by oxygen vacancies (or the introduced foreign element) may result in a decrease in ¬lat. Moreover, if we choose a heavy element as the foreign element (e.g., Sm), a weak phonon drag effect will probably be induced through phonon scattering, resulting in a lower ¬lat.
Thus, in the present study, RP-type SFO and rare-earth (Sm)-substituted SFO (Sr3¹xSmxFe2O7, SSFO,x=0.1, 0.15)
ceramics were synthesized to investigate the effect of Sm substitution on (1) the correlation between the valency of Fe ions and the numbers of oxygen vacancies and (2) Fe4+Fe3+ hopping conduction, related to the thermoelectric properties of this material.
2. Experimental Procedure
SFO and SSFO ceramics were synthesized by a solid-state reaction. SrCO3, Fe2O3and Sm2O3powders were used as the starting materials and mixed by ball-milling in an ethanol medium. The mixed powders were first calcined at 800°C for 3 h and then heated at 1100°C for 5 h in air. The calcined powders were sintered 14 times at 1300°C for 8 h in air. In all cases, the heating rate was controlled to be 200°C/h. The size of the samples was³2 mm©20 mm©4 mm.
The crystal structure, phase and lattice constants of the prepared ceramics were determined by X-ray diffraction (XRD) at temperatures ranging from room temperature (RT) to 700°C (Rigaku, RINT-Ultima). The relative densities of the samples were estimated to be up to 90%of the theoretical values. Rietveld calculation was carried out using the RIETAN-FP program to obtain the lattice parameters of the ceramics.31)
The total amount of oxygen in the SFO and SSFO ceramics was measured by an iodometric method atRT.32)To quench the oxygen vacancies of SFO, it was rapidly cooled to¹196°C in liquid nitrogen after heating to 300 or 700°C. To measure·and S, two or four platinum (Pt) wires were respectively attached to either a Ag or Pt conductive region on the prepared rectangular samples.
The temperature dependence of S with increments of 5 15°C and that of · (Agilent Technologies, E5273A) for the samples were measured from 100 to 700°C by conventional two-probe steady-state and four-probe methods, respectively, using a digital thermometer (Model 7563, Yokogawa). The samples were heated to the measured temperature at a rate of 200°C/h and maintained for ³2 h at the temperature. Then we started to measure either · or S. The power factor (PF), expressed asS2·, was then calculated for each sample.
3. Results and Discussion
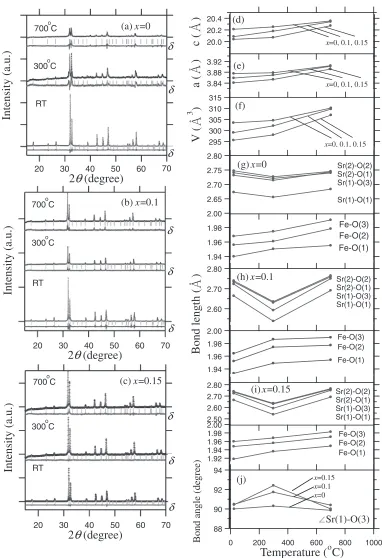
[image:2.595.304.549.576.725.2]Figures 2(a)2(c) show the observed XRD patterns, the patterns calculated by Rietveld analysis, and the differences between them for the prepared SFO and SSFO powders at RT, 300°C, and 700°C. The space groupI4/mmmwas used as the starting structural model of both SFO and SSFOs up to 700°C in the analysis.18)Figures 2(d), 2(e) and 2(f ) show the lattice constants and cell volumes, respectively, determined by the calculation. The calculated bond lengths (SrO, FeO) of SFO and SSFOs are shown in Figs. 2(g)2(i). In Fig. 2(j), the calculated bond angles (OSrO) are shown. The lattice parameters, atomic positions, occupancies of oxygen sites (O(1), O(2) and O(3)), and reliability factors obtained by Rietveld calculation are given in Tables 1 and 2. The observed XRD peaks shifted to a higher angle with increasing x, which is reasonable considering the ionic radii of Sr2+ (0.116 nm, sixfold coordination) and Sm3+ (0.0964 nm, sixfold coordination). However, because the A-site in the perovskite structure was 12-fold-coordinated, it was necessary to compare the effective ionic radii of Sr2+ and Sm3+ in 12-fold coordination geometry. Although the ionic radius of Sr2+ with 12-fold-coordination is 0.144 nm, that of Sm3+is unknown. Thus, we adopted the ionic radius of Sm3+with sixfold coordination (0.0964 nm) for the com-parative analysis. In addition, the XRD peaks of SFO and SSFOs shifted to a lower angle with increasing temperature. These observations are consistent with the lattice constants calculated using Rietveld analysis, that is, the lattice constants decreased with increasing x and increased with increasing temperature, as shown in Figs. 2(d) and 2(e), which reflect the cell volumes in Fig. 2(f ). As shown in Figs. 2(g)2(i), we observed the tendency that the bond length between Sr and O at 300°C decreased, accompanied by an increase in O(3)Sr(1)O(3) bond angle, whereas the bond length between Fe and O increased with increasing temperature. Note that the bond angles of OFeO (O(1), O(2) and O(3)) and OSrO (O(2)Sr(1)O(2), O(1)Sr(2)
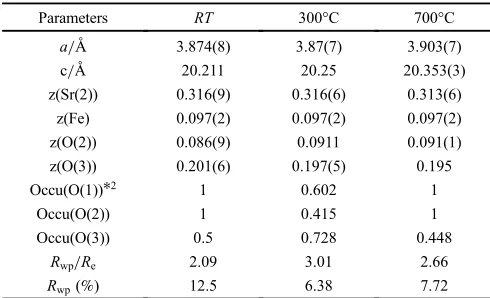
Table 1 Refined atomic parameters for Sr3Fe2O7(space group:I4/mmm*1) atRT, 300°C, and 700°C.
Parameters RT 300°C 700°C
a/¡ 3.874(8) 3.87(7) 3.903(7)
c/¡ 20.211 20.25 20.353(3)
z(Sr(2)) 0.316(9) 0.316(6) 0.313(6)
z(Fe) 0.097(2) 0.097(2) 0.097(2)
z(O(2)) 0.086(9) 0.0911 0.091(1)
z(O(3)) 0.201(6) 0.197(5) 0.195
Occu(O(1))*2 1 0.602 1
Occu(O(2)) 1 0.415 1
Occu(O(3)) 0.5 0.728 0.448
Rwp/Re 2.09 3.01 2.66
Rwp(%) 12.5 6.38 7.72
*1The atomic positions are Sr(1) (0, 0, 1/2), Sr(2) (0, 0, z), Fe (0, 0, z), O(1) (0, 0, 0), O(2) (0, 0, z) and O(3) (0, 1/2, z). The atomic sites are Sr(1) 2b, Sr(2) 4e, Fe 4e, O(1) 8g, O(2) 4eand O(3) 2a.
O(1) and O(2)Sr(2)O(2)) were almost the same regardless of temperature (not shown). Thus, the distortion of the FeO6 octahedron was not induced by the presence of oxygen defects; oxygen defects only caused an expansion of its volume with increasing temperature. Although we cannot yet give a definitive reason for this phenomenon, the tendency of the decreased bond length between Sr and O was probably caused by the generation of oxygen defects. As discussed
later (for the measurement of ·), this tendency was not distinct in the case of SFO because it retained oxygen up to ³400°C, whereas it was distinct in the case of SSFOs because they released oxygen to produce vacancies at a lower temperature. Note that the reliability factors (Rwp/Re,Rwp%) at 300°C are limited, whereas those at 700°C are reasonably good, which might be attributable to the larger lattice
fluctuation caused by the dynamics of oxygen release at
Intensity (a.u.)
70 60 50 40 30 20
2
θ
(degree)
δ
δ
δ
Intensity (a.u.)
70 60 50 40 30 20
2
θ
(degree)
δ
δ
δ
(b) x=0.1 700oC
300oC
RT
Intensity (a.u.)
70 60 50 40 30 20
2
θ
(degree)
δ
δ
δ
(a) x=0 700oC
300oC
RT
700oC
300oC
RT
(c) x=0.15
3.92 3.88 3.84 3.80
a (
)
0 20.4 20.2 20.0
c (
)
x=0, 0.1, 0.15
x=0, 0.1, 0.15 (d)
(e)
315 310 305 300 295 290
V (
3
)
0
x=0, 0.1, 0.15 (f)
2.00
1.98
1.96
1.94
1.92 2.80
2.75
2.70
2.65
Sr(2)-O(2) Sr(2)-O(1) Sr(1)-O(3)
Sr(1)-O(1)
Fe-O(3) Fe-O(2) Fe-O(1) (g) x=0
2.80
2.70
2.60
2.50
800 0
Sr(2)-O(2) Sr(2)-O(1) Sr(1)-O(3) Sr(1)-O(1)
(h) x=0.1
2.00
1.98
1.96
1.94
1.92
800 0
Fe-O(1) Fe-O(2) Fe-O(3)
2.00 1.98 1.96 1.94 1.92 1.90
0
o
C)
2.80 2.70 2.60 2.50
Sr(2)-O(2) Sr(2)-O(1) Sr(1)-O(3) Sr(1)-O(1)
Fe-O(3) Fe-O(2) Fe-O(1)
(i) x=0.15
Bond length (
)
94
92
90
88
1000 800 600 400 200 0
Temperature (
oC)
x=0.15
x=0.1
x=0 (j)
Sr(1)-O(3)
Bond angle (de
gree)
[image:3.595.107.489.65.623.2]300°C than that at 700°C. However, more detailed inves-tigation is needed.
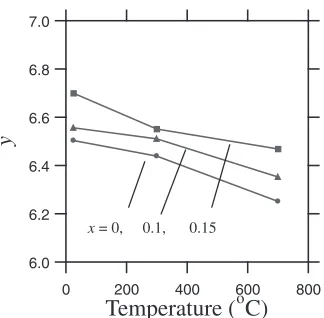
We changed the occupancies of oxygen to converge the results of Rietveld calculation. In addition, neutron diffrac-tion patterns instead of XRD patterns should be utilized for the Rietveld calculation to strictly determine the position and occupancy of oxygen. Such an investigation is currently being carried out. Instead, to determine the number of oxygen defects, the total oxygen content (y) in Sr3¹xSmxFe2Oy was
evaluated by an iodometric method. Figure 3 shows yas a function ofxand temperature for both SFO and SSFOs. As can be seen in Fig. 3, even atRT,ydecreased from 7, which is the stoichiometric composition, to 6.5 for SFO. Notably, yincreased with increasingx, indicating that the number of oxygen vacancies decreased with increasing Sm substitution, a phenomenon that will be discussed later. Moreover, y gradually decreased with increasing temperature, indicating that more oxygen vacancies were formed at a higher temperature.
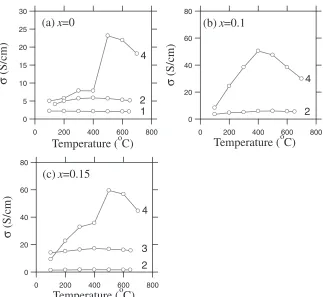
Figures 4(a)4(c) show the temperature dependence of·in SFO as a function of xand the number of sintering cycles. Once-sintered SFO exhibited a decrease in·with increasing
temperature over the entire measured range (100700°C; Fig. 4(a)). This result is consistent with the result of a previous study examining the effect of heat on · under oxidizing conditions.19)With repeated sintering, the temper-ature dependence of·appeared to change. After sintering the ceramic sample twice, the slope of the·versus temperature curve changed from positive to negative at ³400°C. This tendency was also reported by Prado and Manthiram.16)After sintering the ceramic sample four times, the slope of the curve did not markedly change; however, a sudden, steep increase in·was observed above³400°C. These phenomena may be explained as follows. First, as the number of oxygen vacancies in SFO should increase with repeated sintering, a corresponding increase in the number of Fe3+ ions should occur as a result of charge compensation. Subsequently, the contribution of hopping conduction from Fe4+to Fe3+ to· increases. Regarding the value of · for SFO after sintering four times, it is reasonable that the hopping conduction will increase with increasing temperature up to 400°C. According to Prado and Manthiram,16)the oxygen content in SFO, i.e., 7¹¤ (previously denoted as y) in Sr3Fe2O7¹¤, remains constant up to ³400°C, then suddenly begins to linearly decrease up to 1000°C, which is consistent with Figs. 2(g) and 2(j). This indicates that the number of oxygen vacancies in SFO increases above 400°C, which, in turn, increases the number of Fe3+ ions, leading to a rapid increase in ·. The observed decrease in · above ³500°C was due to the generation of excess oxygen vacancies, accompanied by the increased trapping of carriers and a reduction in carrier mobility.
[image:4.595.45.549.83.246.2]Regarding the value of · for twice-sintered SFO, we did not observe a steep increase in temperature versus electrical conductivity. It is considered that the degree of oxygen loss depends on the crystalline stability of SFO. Prado and Manthiram16)reported that the temperature dependence of the oxygen content of SFO is“nearly”reversible, meaning that it is not completely reversible, during heating to 1000°C and cooling toRT. However, as the oxygen content of SFO atRT is clearly lower after 1000°C heat treatment, the number of oxygen vacancies before measuring · in SFO sintered four
Table 2 Refined atomic parameters for Sr3¹xSmxFe2O7(x=0.10 and 0.15, space group:I4/mmm*1) atRT, 300°C, and 700°C.
Parameters x=0.10 x=0.15
RT 300°C 700°C RT 300°C 700°C
a/¡ 3.858(4) 3.86(9) 3.901(8) 3.840(6) 3.85(3) 3.891(3)
c/¡ 20.083(8) 20.17(8) 20.34 20.037(6) 20.0(7) 20.271(3)
z(Sr, Sm(2)) 0.305(9) 0.316(6) 0.313(6) 0.3174(3) 0.316(6) 0.280(5)
z(Fe) 0.097(2) 0.097(2) 0.097(2) 0.097(2) 0.097(2) 0.097(2)
z(O(2)) 0.095(4) 0.091(1) 0.091(1) 0.083(9) 0.091(1) 0.091(1)
z(O(3)) 0.245(2) 0.197(5) 0.195 0.192(8) 0.197(5) 0.195
Occu(O(1))*2 1 0.373 1 1 0.593 1
Occu(O(2)) 1 0.756 1 1 0.566 1
Occu(O(3)) 0.7 0.636 0.49 0.5 0.521 0.49
Rwp/Re 1.60 4.47 1.88 2.48 4.79 1.98
Rwp(%) 10.1 6.70 2.68 15.5 6.73 4.06
*1The atomic positions are Sr, Sm(1) (0, 0, 1/2), Sr, Sm(2) (0, 0, z), Fe (0, 0, z), O(1) (0, 0, 0), O(2) (0, 0, z) and O(3) (0, 1/2, z). The atomic sites are Sr, Sm(1) 2b, Sr, Sm(2) 4e, Fe 4e, O(1) 8g, O(2) 4eand O(3) 2a.
*2Occu stands for occupancy. The occupancy of other constituent atoms is 1. To converge the results of Rietveld calculation, we changed the occupancies of oxygen.
7.0
6.8
6.6
6.4
6.2
6.0
y
800 600 400 200 0
Temperature (
oC)
x = 0, 0.1, 0.15
[image:4.595.91.253.312.471.2]times is likely to be higher than that in twice-sintered SFO. Consistent with this speculation, the value of · for SFO sintered four times was higher than that of twice-sintered SFO at temperatures below 400°C, at which oxygen ions were retained. Thus, twice-sintered SFO is expected to be more stable than SFO sintered four times, which explains the reduced loss of oxygen above 400°C and the absence of the steep increase in ·.
On the basis of the above phenomenon, the lower number of oxygen vacancies in once-sintered SFO resulted in a lower ·than that for twice-sintered SFO. This suggests that intrinsic band conduction dominated in the once-sintered SFO, a property that is characteristic of metallic behavior. In support of this speculation, the S value of once-sintered SFO remained negative, while those of SFO sintered two and four times became positive, as described below.
We could not measure · for the once-sintered SSFO samples because the · values were below the limit of detection. Thus, thexdependence of·was investigated using the twice-sintered samples. For the Sr3¹xSmxFe2Oysamples,
· decreased with increasing x (Figs. 4(a)4(c)), indicating that Sm ions acted to decrease the number of oxygen vacancies, rather than served as an electron donor in SFO. Specifically, Sm3+ substitution at Sr2+ sites resulted in an increase in the number of oxygen ions (O2¹) because of charge compensation. This phenomenon coincided with the results shown in Fig. 3(a), indicating that the oxygen content (decrease in the number of oxygen vacancies) increased with increasing Sm substitution. This increase in oxygen content resulted in a decrease in the number of Fe3+ ions, which reduced the hopping conduction of holes from Fe4+to Fe3+.
In both SSFOs, we observed that·increased with repeated sintering, a finding that was also due to the increase in the number of oxygen vacancies. The highest · for SSFO (x=0.15) was 60 S/cm (log·=1.78 S/cm) after sintering four times, as shown in Fig. 4(c), although the lowest value was observed after sintering twice. When Sm was incorpo-rated into SSFO, the stability of the crystal degraded and an increased amount of oxygen was lost; thus, the · value of SSFO (x=0.15) was the highest among the test samples. Moreover, steep increases in the temperature versus electrical conductivity curve were not observed; rather, linear increases were observed for both SSFO samples sintered four times. It is plausible that the temperature at which oxygen loss began to occur was lower in the SSFOs owing to their lower crystallinity, which is consistent with Figs. 2(h)2(j).
Figures 5(a)5(c) show the temperature dependence ofS for SFO and SSFOs. As shown by the curve in Fig. 5(c), the value ofSfor SSFOs was initially negative, similar to that of SFO in Fig. 5(a), which could befitted asS1=¹2.00.04T. With repeated sintering, S became positive with increasing oxygen reduction. These results also indicate the generation of Fe ion hopping conduction accompanied by an increase in the number of oxygen vacancies. The Svalues of SSFOs increased to 50 µV/K (at 700°C) with increasing temper-ature. It is noteworthy that thisSvalue is higher than that of La-doped SrFeO3 (³20 µV/K at 700°C).27) In addition, the value of S for SSFO (x=0.15) increased to fivefold than that of SFO with increasing Sm addition. This is considered to be caused by the enhancement of Fe ion hopping in addition to the decrease in ¬(¬lat) by the phonon scattering effect owing to the introduced oxygen vacancies and Sm.
30
25
20
15
10
5
0
σ
(S/cm)
800 600 400 200 0
Temperature (
oC)
(a)
x
=0
1 2 4
80
60
40
20
0
σ
(S/cm)
800 600 400 200 0
Temperature (
oC)
(b)
x
=0.1
4
2
80
60
40
20
0
σ
(S/cm)
800 600 400 200 0
Temperature (
oC)
(c)
x
=0.15
4
3
2
Fig. 4 Temperature dependence of the electrical conductivity of Sr3¹xSmxFe2Oy((a)x=0, (b)x=0.1 and (c)x=0.15). The numbers
[image:5.595.139.462.66.363.2]60
40
20
0
-20
S (
μ
V/K)
800 600 400 200 0
Temperature (
oC)
(c)
x
=0.15
1
2 3
4
S1
S2 S
exp
60
40
20
0
-20
S (
μ
V/K)
800 600 400 200 0
Temperature (
oC)
(b)
x
=0.1
3
4
S
1S
2S
exp 60
40
20
0
-20
S (
μ
V/K)
800 600 400 200 0
Temperature (
oC)
(a)
x
=0
3 4
S1
S2 Sexp
Fig. 5 Temperature dependence of the Seebeck coefficient of Sr3¹xSmxFe2Oy((a)x=0, (b)x=0.1 and (c)x=0.15). The numbers next
to the curves indicate the number of sintering cycles. Open circles, experimental data; dashes,fitted lines.
10
8
6
4
2
0
PF (
μ
W/mK
2 )
800 600 400 200 0
Temperature (oC) (a) x=0
4 S2σ2
10
8
6
4
2
0
PF (
μ
W/mK
2
)
800 600 400 200 0
Temperature (oC)
(b) x=0.1 4
S2σ2
12
10
8
6
4
2
0
PF (
μ
W/mK
2
)
800 600 400 200 0
Temperature (oC) (c) x=0.15
4 S2σ2
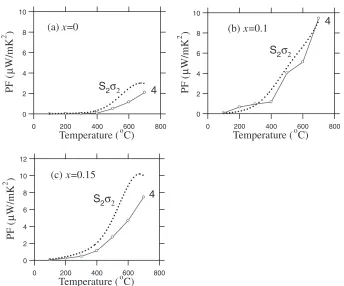
Fig. 6 Temperature dependence of the power factor of Sr3¹xSmxFe2Oy((a)x=0, (b)x=0.1 and (c) x=0.15) calculated from the
[image:6.595.132.472.65.381.2] [image:6.595.128.472.473.759.2]To extract the values ofSresulting from the band behavior and Fe ion hopping from the experimental data (Sexp), theSexp curves in Fig. 5 were fitted by a nonlinear least-squares method using Sexp=(·
1S1+·2S2)/(·1+·2), where S1, S2, ·1, and ·2 are the Seebeck coefficients for band (S1= S1(0)¹c1T) and Fe ion hopping (S2=constant or S2= S2(0)+c2(T¹c3)2), and the conductivities for band (·1: constant, independent of temperature) and Fe ion hopping, respectively.33)In the curvefitting analysis, the values of·2 utilized were from the experimental data in Figs. 4(a)4(c). As a result of the curve fitting analysis, the values of S1(0) and c1inS1were estimated to beS1(0)=4.48 (x=0, 0.15) µV/K and c1=0.048 (x=0, 0.15) µV/K2. The values of S2(0), c2, and c3 in S2 were estimated to be S2(0)=6.48 (x=0, 0.1) and 10.46 (x=0.15) µV/K; c2=7.33 (x=0), 8.81 (x=0.1) and 8.02 (x=0.15) µV/K3; and c
3=292.5 (x=0), 285.8 (x=0.1) and 277.7 (x=0.15) K. The ·1 values were estimated to be·1=4.13 (x=0), 3.97 (x=0.1) and 36.79 (x=0.15) S/cm. Note that we did not obtain the S1data forx=0.1, so those for x=0.15 were utilized.
The estimated S1 and S2 values were a result of n-type semiconduction and Fe ion hopping, respectively, the latter mechanism being associated with the Fe valence state. Poulsenet al.27)reported theoretical results for the enhance-ment ofSby Fe ion hopping in SrFeO3¹¤, which revealed that S can be both negative and positive in this oxide. A similar tendency for Swas observed in both SFO and SSFO in the present study.
Figure 6 shows the power factor (PF=S2·) of SFO and SSFO calculated from the experimental data ((Sexp)2·) and the result of fitting ((S2)2·) in Figs. 4 and 5. The estimated values for (Sexp)2·and (S
2)2·were reasonably consistent with each other. The highest PF value was nearly 10 µW/mK2at 700°C in SSFO (x=0.1). Notably, the PF of SSFO (x=0.1) increased to approximatelyfivefold that of SFO.
4. Conclusions
Samples of Sm-substituted RP-type Sr3Fe2O7 (SFO) and Sr3¹xSmxFe2O7 (SSFO,x=0.1 and 0.15), were prepared to
investigate their structural and thermoelectric properties. SFO exhibited a marked increase in the value of · at ³400°C, which was caused by oxygen reduction. S changed from negative to positive with increasing temperature and also increased with repeated sintering. This behavior is considered to occur as a result of enhanced Fe ion charge hopping due to an increase in the number of oxygen vacancies. In addition, the value of S of for SSFO increased to fivefold that of SFO with increasing Sm addition. This is attributable to the enhancement of Fe ion hopping as well as the decrease in¬ (¬lat) by the phonon scattering effect through the introduction of vacancies and Sm.
Acknowledgments
This work was partly supported by the Regional Innovation Strategy Support Program 2012 (MEXT). We thank Mr. Y. Nakamura for technical assistance and are grateful to Profs. Kumada and Takei (Univ. of Yamanashi)
for help with the temperature-dependent X-ray diffraction measurements of SFO ceramics. We express gratitude to Mr. G. Newton for the careful reading of the manuscript.
REFERENCES
1) G. Mahan, B. Sales and J. Sharp:Phys. Today50(1997) 4247. 2) I. Terasaki, Y. Sasago and K. Uchinokura: Phys. Rev. B56(1997)
R12685R12687.
3) M. Shikano and R. Funahashi:Appl. Phys. Lett.82(2003) 18511853. 4) Y. Miyazaki, K. Kudo, M. Akoshima, Y. Ono and T. Kajitani:Jpn. J.
Appl. Phys.39(2000) L531L533.
5) Y. Miyazaki, T. Miura, Y. Ono and T. Kajitani:Jpn. J. Appl. Phys.41 (2002) L849L851.
6) A. C. Masset, C. Michel, A. Maignan, M. Hervieu, O. Toulemonde, F. Studer, B. Raveau and J. Hejtmanek:Phys. Rev. B62(2000) 166175. 7) S. Hébert, S. Lambert, D. Pelloquin and A. Maignan:Phys. Rev. B64
(2001) 172101.
8) S. Ohta, T. Nomura, H. Ohta, M. Hirano, H. Hosono and K. Koumoto: Appl. Phys. Lett.87(2005) 092108.
9) T. Okuda, K. Nakanishi, S. Miyasaka and Y. Tokura:Phys. Rev. B63 (2001) 113104.
10) Y. Cui, J. He, G. Amow and H. Kleinke:Dalton Trans.39(2010) 1031 1035.
11) H. Ohta, S. Kim, Y. Mune, T. Mizoguchi, K. Nomura, S. Ohta, T. Nomura, Y. Nakanishi, Y. Ikuhara, M. Hirano, H. Hosono and K. Koumoto:Nat. Mater.6(2007) 129134.
12) K. H. Lee, S. W. Kim, H. Ohta and K. Koumoto:J. Appl. Phys.100 (2006) 063717.
13) K. H. Lee, S. W. Kim, H. Ohta and K. Koumoto:J. Appl. Phys.101 (2007) 083707.
14) Y. Wang, K. H. Lee, H. Hyuga, H. Kita, H. Ohta and K. Koumoto: J. Electroceram.24(2010) 7682.
15) Y. Wang, K. H. Lee, H. Hyuga, H. Kita, K. Inaba, H. Ohta and K. Koumoto:Appl. Phys. Lett.91(2007) 242102.
16) F. Prado and A. Manthiram:J. Solid State Chem.158(2001) 307314. 17) A. A. Markov, M. V. Patrakeev, V. V. Kharton, Y. V. Pivak, I. A. Leonidov and V. L. Kozhevnikov:Chem. Mater.19(2007) 39803987. 18) L. Mogni, F. Prado, H. Ascolani, M. Abbate, M. S. Moreno, A. Manthiram and A. Caneiro:J. Solid State Chem.178(2005) 1559 1568.
19) V. V. Kharton, M. V. Patrakeev, E. V. Tsipis, M. Avdeev, E. N. Naumovich, P. V. Anikina and J. C. Waerenborgh:Solid State Ionics 181(2010) 10521063.
20) S. E. Dann, M. T. Weller and D. B. Currie:J. Solid State Chem.97 (1992) 179185.
21) P. Adler:J. Solid State Chem.130(1997) 129139.
22) K. Mori, T. Kamiyama, H. Kobayashi, T. Arima, K. Ohoyama and S. Ikeda:Appl. Phys. A74(2002) s914s916.
23) M. Abbate, H. Ascolani, F. Prado and A. Caneiro: Solid State Commun.129(2004) 113116.
24) K. Mori, T. Kamiyama, H. Kobayashi, S. Torii, F. Izumi and H. Asano: J. Phys. Chem. Solids60(1999) 14431446.
25) Y. Bréard, C. Michel, M. Hervieu, F. Studer, A. Maignan and B. B. Raveau:Chem. Mater.14(2002) 31283135.
26) F. Prado, T. Armstrong, A. Canerio and A. Manthiram:J. Electrochem. Soc.148(2001) J7J14.
27) F. W. Poulsen, G. Lauvstad and R. Tunold:Solid State Ionics72(1994) 4753.
28) S. Nishiyama, J. Nagaoka and T. Hattori: Trans. Mater. Res. Soc. Jpn.
29(2004) 28252828.
29) L. Siwen, R. Funahashi, I. Matsubara, K. Ueno, S. Sodeoka and H. Yamada:Chem. Mater.12(2000) 24242427.
30) M. Ohtaki, H. Koga, T. Tokunaga, K. Eguchi and H. Arai:J. Solid State Chem.120(1995) 105111.
31) F. Izumi and M. Monmma:Solid State Phenom.130(2007) 1520. 32) J. T. S. Irvine and C. Namgung:J. Solid State Chem.87(1990) 2934. 33) K. Kawakami, Y. Sakai and N. Tsuda:J. Phys. Soc. Jpn.55(1986)