Microstructural Changes at the Ultra-Precision Raster Milled Surface
of Zn-Al Based Alloy
S. To, Y. H. Zhu and W. B. Lee
Advances Manufacturing Technology Research Centre, Department of Industrial and Systems Engineering, The Hong Kong Polytechnic University, Kowloon, Hong Kong, P. R. China
The microstructural changes and phase decomposition at the surface of a ultra-precision raster milled Zn-Al based alloy were studied using optical microscopy, back-scattered electron microscopy and X-ray diffraction techniques. The phase decomposition and the related crystal orientation were examined after ultra-precision raster milling with various processing parameters. UPRM induced phase decomposition and the structural recovery were discussed in relation to the structural evolution of the chips. The effect of UPRM on the hardness of the surface of the alloy specimen was studied. [doi:10.2320/matertrans.MRA2007626]
(Received November 1, 2007; Accepted February 8, 2008; Published March 25, 2008)
Keywords: ultra-precision raster milling, phase decomposition, surface microstructure, nano-hardness, Zn-Al alloys
1. Introduction
Ultra-precision raster milling (UPRM) is one of the advanced manufacturing processes, which provides very high solution for machining non-rotational symmetric free-form surface with nanometric surface finish and sub-micro-metric form accuracy without the need for any subsequent post polishing.1)This newly developed manufacturing tech-nique has shown its comprehensive applications in producing components of optical, photonics and telecommunication products.1–3)However, little attention has been drawn onto studies of the processing, such as cutting mechanics, kine-matics and dynamic characteristics of the cutting processes, and the factors affecting surface quality etc. A high precision surface finish still relies on the experiences and skill of the machine operators. Those materials factors, such as micro-structure and phase stability of the UPRM surface have been even less studied. A better understanding of effect of these factors and their interactions on the surface qualities is of practical application importance.
The present paper will deal with microstructural changes at the ultra-precision raster milled surface of a Zn-Al based alloy, in particular the effect of some processing factors on the microstructures, from point of view of phase decom-position.
2. Experimental Procedures
Eutectoid Zn-Al based alloy specimens were produced from high purity zinc (99.99%), aluminium (99.99%) and copper (99.99%) by melting in an induction furnace. The melt was degassed with a commercial degasser and poured at 700C into preheated steel mould. Cast ingots of the alloy
were extruded into rods of 12 mm in diameter after heating to 250C. Specimens were cut from the extruded alloy rods and
then solution-treated at 350C for 4 days, and furnace cooled
(FC) to room temperature in the furnace chamber. The actual composition of the alloy specimens was Zn75.3Al22.1Cu2.6 (in mass%).
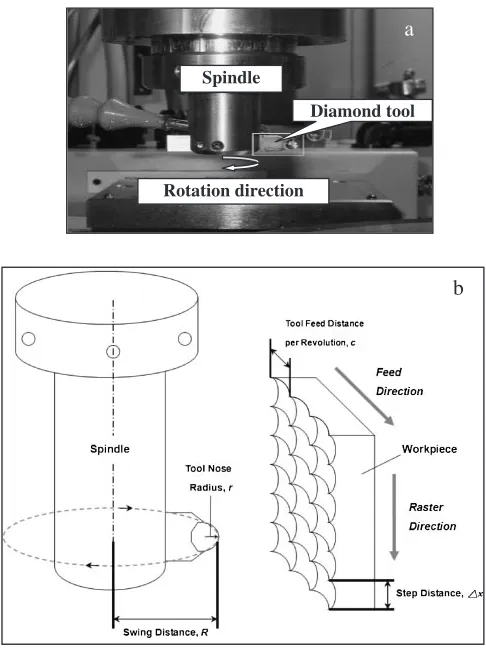
Ultra-precision raster milling was performed on a five-axis CNC ultra-precision freeform machining system (Freeform 705G from Precision Inc., USA) as shown in Fig. 1a. A vertical cutting mode of UPRM was used, the schematic geometry of which is illustrated in Fig. 1b. The operating parameters are listed in Table 1. At least five times of previously cutting were carried out with the same cutting conditions, before each UPRM cut.
Diamond tool
Rotation direction Spindle
a
b
Fig. 1 Ultra-precision raster milling machine (Freeform 705G) (a) and Schematic geometry of ultra-precision raster milling (b).
[image:1.595.305.548.324.648.2]Microstructural examinations were carried out on the specimens having been UPRM cut with various depths of cut (DoC), using back-scattered electron microscopy (BSEM), X-ray diffraction (XRD) and optical microscopy (OP) techniques. In order to detect atomic number contrast, BSEM was applied for microstructural examinations. None mechan-ical polishing was needed with the UPRM alloy specimens. The XRD examination was carried out on a Philips X-ray diffractometer with nickel-filtered Cu Kradiation. A range of diffraction was selected from 35C–47C (2). The
scanning speed was 0.1 degre/min1. A low-angle XRD was applied to detect the crystal structure of the UPRM alloy
surface. A Leica optical microscope (Leica-LM) was applied for structural examination of the chips from the UPRM. Hardness tests of the surface and the bulk part of the alloy specimen were carried out using a Nano-Indenter II in order to examine the effect of the UPRM on the surface properties of the alloy specimen. Ten hardness datum were collected for each load. The inter-distance between two test – points was 30mmat least.
3. Results and Discussion
3.1 UPRM induced decomposition of0
FCphase
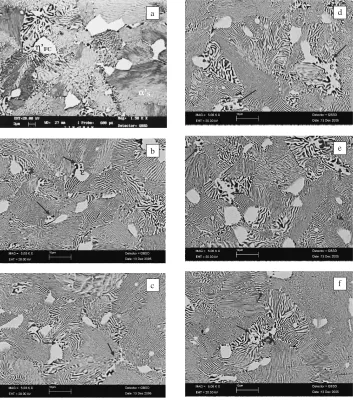
The microstructure of the as-FC alloy specimen consisted of the light imaged Zn-rich phases0FCand"(Zn4Cu), and two lamellar structure: coarse lamellar structure was from the decomposition of the Zn-rich phase and the fine lamellar structure from the decomposition of the Al-richphase, as shown in Fig. 2a.4) The 0
FC and "are of hexagonal close packed crystal structure, the and thephases are of face centered cubic crystal structure. During furnace cooling, the
0
[image:2.595.52.294.83.158.2]FC phase had started decomposed, and the dark imaged Table 1 Operating parameters of ultra-precision raster milling.
Spindle Speed (rpm) 4000
Feed Rate (mm/min) 20
Depth of Cut (mm) 1, 10, 20, 30, 40
Tool Nose Radius,r(mm) 2.543
Swing Distance,R(mm) 45.90
Step Distance,x(mm) 0.04
a
b
c β’
α’
S
S
η’FC
ε
e
f d
ε
[image:2.595.122.475.359.759.2]precipitates of Al-rich phase was observed inside the
0
FCphase.
During the ultra-precision raster milling (UPRM), the precipitation of thephase was detected being developed at the surface of the UPRM specimen. The 0FC phase trans-formed to another metastable phase, 0T phase. Shown in Fig. 2b-f are the BSEM images of the FC ZA22 alloy specimens after various UPRM cuttings with different operating parameters: S 4000 rpm, FR 20 mm/min and depths of cut 1, 10, 20, 30 and 40mm. The dark imaged precipitates of thephase inside the light imaged the 0
FC phase are indicated by arrows ‘‘!’’ in Fig. 2. It was observed that the dark imaged precipitates of the phase increased when the depth of cut increased from 1 to 30mm, as shown in Fig. 2a-d.
In previous studies, it had been reported that the precipi-tation of the dark imagedphase inside the light imaged the
0
FC phase was one of the characteristics of the decompo-sition of the 0FC phase under various thermal and thermo-mechanical circumstances.4–6)Figure 3 gives BSEM images of various parts of the 150C-tensile deformed ZA22 alloy: the bulk part (a) and the neck zone (b). It was observed that with increasing strain, the precipitates of the Al-richphase increased in the neck zone of the tensile deformed specimen. In comparison, it is clear that the UPRM cutting induced external stresses onto the surface of the specimen being UPRM cut, and resulted in decomposition of the0
FCphase. It was interested to note that when the DoC increased up to 40mm, the dark imaged precipitates of thephase decreased, as shown in Fig. 2f. The microstructure appeared approach-ing the original of the as FC state. A structural recovery occurred when the UPRM cutting was performed with the higher DoC.
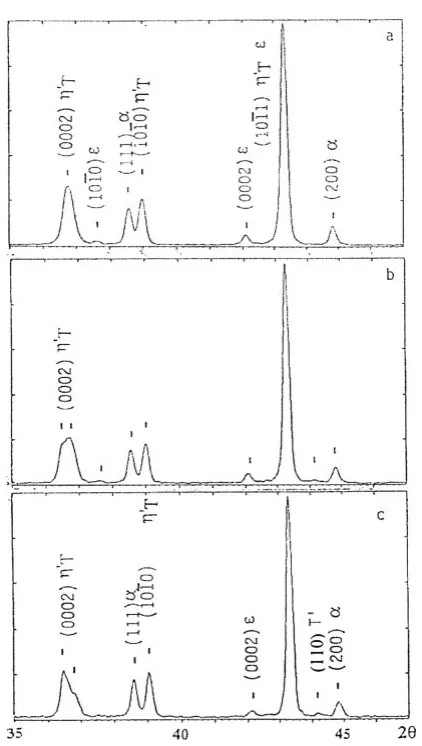
The above observed decomposition the 0FC phase was detected using XRD technique. Figure 4 gives X-ray dif-fractograms of the raster milled FC ZA 22 specimens after
various UPRM cuttings with different operating parameters: S 4000 rpm, FR 20 mm/min and DoCs 1, 10, 20, 30 and 40mm.
It was found that when the DoC of the UPRM cutting increased from 1mmto 30mm, the XRD peak of the (0002) planes of the0FCphase shifted to low2angles at the X-ray Fig. 3 BSEM images of various parts of the 150C-tensile deformed ZA22
alloy: the bulk part (a) and the neck zone (b).
a
b
c
d
e
f
η
’FC
(0002)
α
(111)
η
’FC
(1010)
η
’FC
,
ε
(1011)
α
(111)
η
’T
(0002)
Tη
(1010)
’η
’ T,
ε
(1011)
[image:3.595.334.517.66.649.2] [image:3.595.85.253.72.305.2]diffractograms and the d-spacing of the (0002) planes increased from 0.2443 to 0.2449 nm. That meant that the
0
FCphase had decomposed to another metastable phase0T phase. Both the 0
FC and 0T phases decomposed during further UPRM cutting. Listed in Table 2 are the d-spacing of the (0002) planes of the 0
FC and 0T phases at the UPRM surface of the FC ZA22 alloy specimens with UPRM operation conditions: S 4000 rpm, FR 60 mm/min and the various DoCs. The (0002) diffraction peak shifting appeared to be one of the characteristics of the decomposition of the metastable0
FCand0T phases.
The external stresses induced phase decomposition in the ZA based alloys was studied in various thermal and thermo-mechanical circumstances.6,7)Shown in Fig. 5 are the X-ray diffractograms of various parts of the 150C tensile-deformed eutectoid ZA based alloy.7)The decomposition of the 0
FC phase was detected in the alloy specimens. The
shifting of the (0002) XRD peak of the 0FC phase was observed in the neck zone and the rupture part of the tensile deformed specimen. Accordingly, the d-spacing of the (0002) planes of the phase increased from 0.2449 nm in the bulk part to 0.2458 nm in the neck zone, and 0.2462 nm in the rupture part of the specimen. Obviously tensile stress resulted in the decomposition of the0
FC phase.7)In comparison, it is clear that the UPRM cutting inserted external stresses onto the surface of the specimens, which resulted in plastic deforma-tion and acceleradeforma-tion of the decomposideforma-tion of the0
FCphase in the FC ZA 22 alloy.
It was also interested to note that the d-spacing decreased from 0.2449 nm approaching 0.2446 nm, the original value of the as FC state when the DoC increased from 30 to 40mm, as shown in Fig. 4. That implied that the phase decomposition retarded when UPRM cutting performed at a higher DoC,e.g. 40mm in the present test. This is agreed with the above mentioned microstructural recovery observed in the BSEM examinations.
3.2 UPRM induced preferred crystal orientation
changes
Accompanying the UPRM induced phase decomposition of the0
FCphase, preferred crystal orientation changes were observed at the surface of the raster milled alloy specimens. With increasing the DoC from 1 to 30mm, the XRD intensity of the (0002) planes of the0
FCphase decreased, in other word, the crystal orientation of the phase at (0002) planes reduced, as shown in Fig. 4. Further increasing DoC of cut to 40mm, the XRD intensity of the (0002) planes recovered approaching the original of the as furnace cooled state. That implied that the preferred crystal orientation of the phase changed after UPRM cutting, accompanying the above mentioned microstructural change and phase decom-position.
The recovery of the preferred crystal orientation was observed in the mechanical ball-milled filings of the FC ZA 22 alloy.8)It was clearly observed that the intensity of the XRD diffraction from the (0002) planes of the0
FC and0T phases decreased during the early stages of ball milling (till 10 h of ball milling). After 20 h of ball milling, the intensity of the XRD diffraction decreased back to the original i.e. that of the 0 h ball milling state. It was not difficult to understand this orientation recovery after having observed the plastic deformation resulted by the mechanical ball milling. During the early stage of ball milling the alloy filings were flattened due to a directional impact, grinding and compression. After 20 h ball milling, the filings had changed from the previous flattened forms to inter-granular fine particles, i.e. the direction external stress was elimi-nated, thus the preferred orientation returned to their original, 0 h ball milling state.8)
3.3 Structural evolution
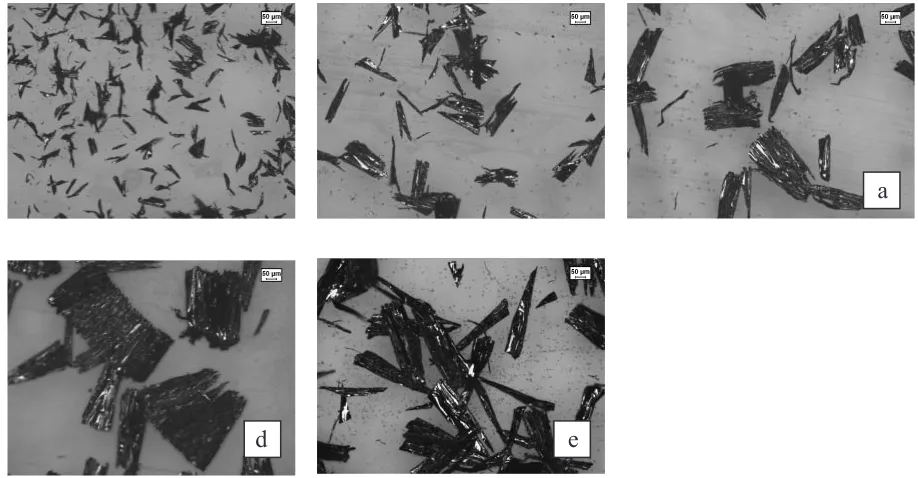
In order to study the structural evolution of the surface of the UPRM alloy specimen, optical microscopy images of the chips from the UPRM cutting with various depths of cut (1, 10, 20, 30 and 40mm) were taken, as shown in Fig. 6.
In the case of the UPRM cutting, various deformations occurred in the sub-surface and the chips of the specimens Table 2 d-spacing of the (0002) planes of the0
FCand0Tphases at the
UPRM surface of the FC ZA22 alloy specimen with UPRM operation conditions: S 4000 rpm, FR 60 mm/min and various depths of cut.
As-FC state DoC: 1 10 20 30 40mm d-spacing (nm) 0.2446 0.2443 0.2446 0.2448 0.2449 0.2444
Fig. 5 XRD patterns of various parts of the 150C-tensile deformed FC
[image:4.595.63.274.154.527.2]being UPRM cut, such as the plastic deformation (compress, extrusion etc.), and the shear deformation. When the DoC increased from 1–30mm, the stripe-chips gradually changed to sheet in form, i.e. the discontinuous chip formation became the continuous chip formation. This revealed that the plastic deformation developed, and accelerated the phase decomposition. Both BSEM and XRD results showed clearly that the decomposition of the 0
FC phase was accelerated when the Doc increased from 1 to 30mm, as shown in Figs. 2 and 4.
After the DoC increased from 30 up to 40mm, the continuous chip formation returned back to the discontinuous chip formation, i.e. the plastic deformation decreased. This implied that the deeper UPRM cutting (with DoC of 40m) induced stresses resulted in tremendous increases of fraction of the shear deformation, which played a dominate role in the cutting mechanism. And the plastic deformation fraction became a small part in the total deformation fractions, relatively. Therefore, the plastic deformation, such as compress and extrusion etc., induced decomposition of the
0
FC phase considerably retarded, and the microstructure recovered back approaching the original as FC state, as observed in both the BSEM and XRD examinations.
3.4 UPRM induced increase in surface hardness
Hardness of the surface of the UPRM alloy specimen (with DoC of 20mm) are shown in Fig. 7. The hardness of the surface deceased with increasing in depth from from the surface after UPRM with DoC of 20mm. The surface hardness of the UPRM specimen was 1.75 GPa, and the hardness of the bulk part of the specimen was 1.25 GPa. The depth of the hardness-affected depth was about 400 nm. It is clear that UPRM process affects the properties of the surface of the alloy specimen. The increase in hardness was attributed by the distorted microstructure of the
sur-face of the specimen, where dislocation and stacking fault increased considerably.
4. Conclusions
Both BSEM and XRD examinations revealed that the ultra-precision raster milling induced external stresses onto the alloy specimens being machined, which resulted in microstructural changes and the phase decomposition. With increasing DoC, the microstructural changes and the phase decomposition accelerated and further increasing DoC might cause structural recoveries.
Various deformations occurred in the sub-surface and the chips of the specimens being UPRM cut. Those plastic deformations accelerated phase decomposition. While the shear deformation became the main part in the total deformation fraction, the UPRM induced microstructural
0 1000 2000 3000 4000 0.8
1.2 1.6 2.0 2.4
Hardness (GPa)
DoC ( nm )
Fig. 7 Hardness changes with the distance from the surface of the raster milled specimen (with DoC of 20mm).
a
d
e
[image:5.595.67.526.72.311.2] [image:5.595.307.546.369.535.2]changes and the phase decomposition retarded, and the structural recovery occurred. Because of the microstructure distortion, the hardness increased at the surface of the UPRM specimen.
Acknowledgement
The authors would like to express their gratitude to The Research Grants Council of Hong Kong special Administrative Region of the People’s Republic of China for providing financial support (Project No. PolyU5283/06E) and Mr. T. W. Chung, Ms. M. Chun and Mr. J. M. N. Yueng for their assistance in the experimental and editing work.
REFERENCES
1) B. K. Ghoi and C. S. Jun: Computer-aid Design,21(1989) 371–378. 2) Y. H. Chen, Y. S. Lee and S. C. Fan: J. Manuf. Syst17, (1998) 371–
388.
3) W. B. Lee, D. Gao, C. F. Cheung and J. G. Li: J. Mater. Proc. Technol.
140(2003) 211–216.
4) Y. H. Zhu, H. C. Man, H. J. Dorantes-Rosales and W. B. Lee: J. Mater. Sci.38(2003) 2925–2934.
5) Y. H. Zhu and F. Goodwin: J. Mater. Res.10(1995) 1927–1932. 6) Y. H. Zhu: Mater. Trans. JIM,45(2004) 3083–3097.
7) Y. H. Zhu and W. B. Lee: Mater. Sci. Eng. A293(2000) 95–101. 8) Y. H. Zhu, V. M. Lopez-Hirata and M. Saocedo Munoz: Z,