IntroductIon and objectIve
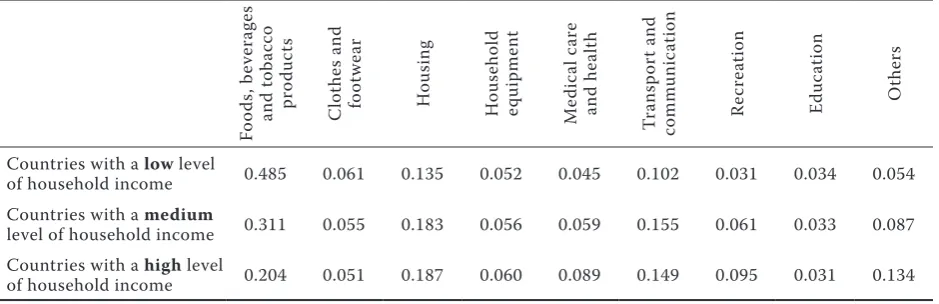
Foods have an outstanding position in the household consumption basket, which is confirmed by their significantly higher share in the total expenses when compared to other articles. The World Bank database
(2005) states that in countries with a high1 level of
the household income, the expenses spent for foods, beverages and tobacco products represent 20% of the
total expenses. in countries with a medium2 level of
the household income, the share of expenses for foods, beverages and tobacco products is more than 30%,
and in countries with a low3 level of the household
income, the share is almost 50%. Table 1 describes in detail the situation in the entire consumption basket of households in the above-mentioned categories.
The structure of the household consumption basket, i.e. the extent of purchasing or consumption of the respective articles thereof is the result of the func-tioning of the demand function system, see Deaton (1986). The consumer demand for food as well as the demand for other consumption basket articles is affected by many factors (Koutsoyiannis 1979). it applies in general that the consumer demand vol-ume and structure are formed most significantly by economic factors. in the second place, demographic factors influence the consumer demand volume and structure, and there are moreover social and other factors (nicholson 1992 or Tvrdoň 1999). Within the set of economic factors, the consumer demand for food is most significantly formed by their market price and the amount of income of the consumer
effects of changes in the tax environment
on the consumer demand for food
Pavel SYROVÁTKA
Department of Regional and Business Economics, Faculty of Regional
Development and International Studies, Mendel University in Brno, Brno,
Czech Republic
abstract: The article describes in detail and applies the methodological approach to the conditions of the czech markets;
such an approach may be used in quantifying changes in the volume of consumer demand for food if the VAT rate or the physical persons’ income tax rate are changed. To define the percentage change in the consumer demand for food caused by changes in the VAT rate or in the physical persons’ income tax rate, the differential-logarithmic model of the Marshal-lian demand function was applied: dQ/Q × 100 = ε × [ln(1 + ν1) – ln(1 + ν0)] × 100 + η × [ln(1 – μ1) – ln(1 – μ1)] × 100. The general form of the dynamic demand model was adjusted to the conditions of the czech final food market through the respective coefficients of the price elasticity (ε) and the income elasticity (η) as follows: dQ/Q × 100 = –0.514 × [ln(1 + ν1) – ln(1 + ν0)] × 100 + 0.583 × [ln(1 – μ1) – ln(1 – μ1)] × 100. on the basis of the derived differential model, it may be stated that an increase in the VAT rate by 1 percentage point from the original rate (10%) would cause a decrease in the demand for food of an average czech household by 0.4652%. in the case of an increase in the physical person‘s income tax by 1 per-centage point from the original rate (15%), the demand for food of an average czech household would decrease by 0.6899%. The achieved results show that the demand of czech households for food responds more sensitively to changes in the in-come tax. Quantification of the relative change in the consumer demand for food caused by the tax rate changes, especially the VAT tax rate change, is also useful for making estimates of the relative changes in demand functions within the respec-tive agriculture and food-processing industry verticals. The performed analysis shows that the changes in the volume of consumer demand for food will be transferred in the same percentage rate to the demand functions within the respective agriculture and food-processing industry verticals, provided the technical and technological conditions are stabile.
Key words: demand for food, VAT, income tax, consumer demand dynamics, evaluation of changes in demand
1income per person in a household represents more than 45% of the standard US household. 2income per person in a household fluctuates between 15% to 45% of the standard US household. 3income per person in a household is less than 15% of the standard US household.
entities. in addition to the said two most principal economic factors, demand relations in the sphere of foods are also very strongly influenced by prices of complementary and substitution goods; nicholson (1992), respectively cramer and Jensen (1994). With regard to the indicated determining core of such demand relations, there is a naturally offered option to continue analysing the consumer demand for food in various tax system setups. When analysing the influence of the tax environment on the level of the consumer demand for food, it is therefore necessary to pay attention especially to the taxes that increase the food selling price and to the taxes that reduce incomes of the consumer entities – households.
The importance of analyses of the economic struc-ture and dynamics of consumer demand for foods is also emphasised by the new economic model of operation of the agriculture and food-processing sector. in this concept, the behaviour of produc-ers of agricultural materials and their processors is governed in particular by the extent, the structure and development of demand in the individual mar-kets of the respective product verticals, taking into account that the demand of consumers of the final food products has the primary effect, see Mundlak et al. (1997), respectively Bečvářová (2008).
The aim of this article is to analyse in detail and to verify the methodological approach suitable for the quantification of the impact of various taxation levels on the level of consumer demand for foods. in this context, the article deals with the VAT rate and the physical persons’ income tax rate and quantifies their impact on the demand of czech households for food. For the purpose of the said demand analysis, a logarithmic-differential model is suggested allowing the estimation of the percentage change in the
con-sumer demand for food of czech households when the rate of both the monitored taxes is changed.
MetHodoLoGY
With regard to the defined objective, it is at first necessary to define a proper differential equation, with the help of which the impact of a change in the VAT and/or the physical persons’ income tax on the volume of consumer demand for food can be quantified. in the respective direction, we will base our calculations on the simplified form of the
Marshallian4 demand function so that the level of
consumer demand for food (Q) will just result from
the food market price (P) and the amount of income
of the consumer entity (M), this means:
) , (P M f
Q (1)
Furthermore, we will take as a given that the VAT
will increase the food price by its rate v to the PT
level in the following manner:
) 1 ( Q
u P
PT (2.1)
and the physical persons’ income tax at the rate of
μ will decrease the income of households to MT as
follows:
) ȝ 1 ( u M
MT (2.2)
in accordance with the tax system effects, see (2.1) and (2.2), we may redefine the Marshallian function of consumer demand for food (1) into the following form (3):
) , (PT MT f
[image:2.595.64.534.85.237.2]Q (3)
Table 1. Expense shares of households
Fo
od
s,
b
ev
er
ag
es
an
d
to
ba
cc
o
pr
od
uc
ts
c
lo
th
es
a
nd
fo
ot
w
ea
r
h
ou
si
ng
h
ou
se
ho
ld
eq
ui
pm
en
t
M
ed
ic
al
c
ar
e
an
d
he
al
th
Tr
an
sp
or
t a
nd
co
m
m
un
ic
at
io
n
re
cr
ea
tio
n
Ed
uc
at
io
n
o
th
er
s
countries with a low level
of household income 0.485 0.061 0.135 0.052 0.045 0.102 0.031 0.034 0.054 countries with a medium
level of household income 0.311 0.055 0.183 0.056 0.059 0.155 0.061 0.033 0.087 countries with a high level
of household income 0.204 0.051 0.187 0.060 0.089 0.149 0.095 0.031 0.134 Source: 2005 icP data, World Bank
it is advisable to implement the differential and logarithmic form of the Marshallian demand model to analyse the change in the level of consumer de-mand for food in relation to changes in taxation (2.1) and (2.2):
MT d PT d Q
dln İu ln Șu ln (4)
The differential equation of consumer demand (4) defines the relative change in the household
con-sumer demand for food (dQ/Q) invoked by a relative
change in market prices plus the VAT (dPT/PT) and
a relative change in the income after tax (dMT/MT).
The coefficient ε in the equation (4) represents the direct price elasticity of the household consumer demand for food and the coefficient η represents the income elasticity of the demand. referring to the above-mentioned facts, the differential equation (4) may also be written as (4*):
MT dMT PT
dPT Q
dQ İu Șu
(4*)
As the relations (2.1) and (2.2), showing the effects of both monitored taxes, can be also expressed in differential-logarithmic form: ) 1 ( ln ln
lnPT d Pd Q
d (5.1)
) ȝ 1 ln( ln
lnMT d M d
d (5.2)
we can rewrite the differential equation of consumer demand (4) into the following form (6):
) ȝ 1 ln( Ș ln Ș ) 1 ln( İ ln İ
lnQ ud P ud ud M ud
d Q
(6)
on the basis of the derived differential equation (6), it is possible to easily quantify the impacts of various adjustments to the VAT rate (ν) and/or the physical persons’ income tax rate (μ) on the level of the household consumer demand for food.
(A) Ceteris paribus we may above all estimate on the basis of the equation (6) the rate of the percentage change in the household consumer demand for food if the VAT rate is changed. Let us assume that the
VAT rate is changed from ν0 to ν1. As the coefficient
of the price elasticity of the consumer demand will almost certainly be negative for foods as a whole (ε < 0), we may expect a decrease in the respective
demand when the VAT rate is increased (ν0 < ν1) and
vice versa. Expressed in percents, the change in the household consumer demand for food caused by the VAT rate change will be equal to:
100 )] 1 ( ln ) 1 ( [ln İ
100 u 1 0 u
u Q Q
Q
dQ
(7.1)
(B) Ceteris paribus we may also quantify the impact of the change in the income tax paid by the consumer entities (μ) on the level of their demand for foods using the equation (8). Like in the previous case, we will consider the physical persons‘ income tax change
from μ0 to μ1 as given. As the coefficient of income
elasticity of demand for food as a whole will almost certainly show a positive value (η > 0), the increase
in the physical persons’ income tax (μ0 < μ1) will also
cause a decrease in consumer demand, or vice versa. The level of the percentage change in the household consumer demand for food will be determined from the following relation:
100 )] ȝ 1 ( ln ) ȝ 1 ( [ln Ș
100 u 1 0 u u
Q
dQ
(7.2)
(c) Using the differential equation (6), we can of course quantify the change in the level of consumer demand of czech households for food, which will be caused by changes in both the monitored taxes
concurrently, i.e. a change in the VAT (from ν0 to
ν1) and concurrently a change in the the physical
persons’ income tax (from μ0 to μ1). in such a case,
the resulting percentage change in the consumer demand for food will be equal to the aggregate of equations (7.1) and (7.2):
100 )] ȝ 1 ( ln ) ȝ 1 ( [ln Ș 100 )] 1 ( ln ) 1 ( [ln İ
100 u 1 0 u u 1 0 u
u Q Q
Q
dQ
)] 100 Ș [ln(1 ȝ) ln(1 ȝ )] 100
1 ( ln ) 1 ( [ln İ
100 u 1 0 u u 1 0 u
u Q Q
Q
dQ (7.3)
reSuLtS, dIScuSSIon and concLuSIonS To quantify the demand response of czech house-holds in the sphere of food in the case of a VAT rate increase or in the case of the physical persons’ in-come tax rate, the increase made by the differential equations (7.1), (7.2) or respectively (7.3), the cor-responding coefficients of income (η) and the price elasticity of the demand (ε) are necessary. in the respective regard, the article is based on the values of coefficients of the demand elasticity, which result from the long-term researches of consumer markets performed by the USDA. The latest estimates of co-efficients ε and η are available in the USDA for the year 2005, when the demand relation researches were performed in as many as 144 countries of the world. The czech republic has also been included among the monitored countries since 1996. The USDA makes estimates of the coefficients of income and price elasticity of the consumer demand using the “Florida” model developed by Seale et al. (1991) in 1991. The USDA methodology for the determination of demand ) ȝ 1 ln( Ș ln Ș ) 1 ln( İ ln İ
lnQ ud P ud ud M ud
elasticity is completely described in the technical bul-letin of the ErS USDA, TB 1904 (Seale et al. 2003). Table 2 shows the values of income elasticity and the price elasticity of demand of czech households for foods, beverages and tobacco products taken from the USDA researches. At the level of the price elas-ticity, the demand functions were taken over, with regard to the considered Marshallian concept of the demand function, from the coefficient of the non-compensated (cournot) price elasticity of demand. For illustration, Table 2 shows the estimates of both demand elasticity coefficients in the year 1996, this means the year when these characteristics of the czech republic’s consumer markets were published for the first time.
in accordance with the obtained coefficients of income elasticity and price elasticity of demand, see Table 2, we can modify the differential equations of consumer demand for foods (7.1), (7.2) and (7.3) into the form (8.1), (8.2) and (8.3):
100 )] 1 ( ln ) 1 ( [ln 514 . 0
100 u Q1 Q0 u
u
Q
dQ (8.1)
100 )] ȝ 1 ( ln ) ȝ 1 ( [ln 583 . 0
100 u 1 0 u
u
Q
dQ
(8.2)
u u
u100 0.514 [ln(1 Q1) ln(1 Q0)] 100 Q
dQ
0.583u[ln(1ȝ1)ln(1ȝ0)]u100
u u
u100 0.514 [ln(1 Q1) ln(1 Q0)] 100 Q
dQ
0.583u[ln(1ȝ1)ln(1ȝ0)]u100 (8.3)
on the basis of differential equations (8.1), (8.2) and (8.3), adjusted to the czech environment, we can start studying the impact of changes in the VAT rate and/or in the physical persons’ income tax rate on the level of demand of czech households for food. For the VAT rate, we will consider the following methods of increase in this article:
1a) from 10% to 14% 1b) from 10% to 17.5% 1c) from 10% to 20%,
which is based on the discussions concerning the amendment to the VAT Act applicable to foods. For the physical persons‘ income tax rate, we will work with the following in this article:
2a) with a theoretical increase from 15% to 20% 2b) with a theoretical decrease from 15% to 10%.
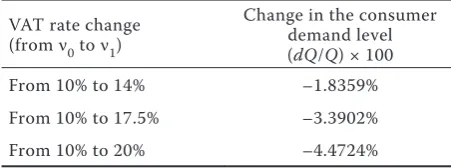
First, we will focus on the changes in the demand of czech households for food caused by the change in the VAT rate only; see the Methodology – Section (A). in this analysis, we will therefore assume that the physical persons‘ income tax rate has not been changed. The percentage changes in the monitored consumer demand estimated on the basis of the loga-rithmic-differential equation (8.1) in the case of the VAT rate increase by the methods 1a), 1b) and 1c) are summarised in Table 3.
Table 3 shows that the VAT rate increase by 4 per-centage points would cause a decrease in the demand of the average czech household for foods, beverages and tobacco by 1.84%. increasing the VAT rate by 7.5% would cause a decrease in the respective con-sumer demand by 3.39%; this means more than one and a half percentage point when compared with the previous value. in the case of doubling the VAT, i.e. from 10% to 20%, the demand of the average czech household for foods, beverages and tobacco products would even decrease, by 4.47%.
The second part of this analysis deals with the quantitative evaluation of the impact of changes in the physical persons’ income tax rate on the level of demand of czech households for foods, bever-ages and tobacco. in making such analysis, we will presume that the VAT rate does not change, see the Methodology, Section (B). Table 4 summarises the estimates of the relative changes in the monitored consumer demand obtained from the equation (8.2), if the physical persons‘ income tax is increased from 15% to 20%; 2a), or respectively decreased from 15% to 10%; 2b).
[image:4.595.63.290.97.176.2]it is obvious from Table 4 that the physical persons‘ income tax rate increase by 5 percentage points would cause a decrease in the demand of the average czech household for foods, beverages and tobacco by 3.53%. on the contrary, a decrease in the physical persons’ Table 2. Elasticity of demand of czech households for food,
beverages and tobacco
Year coefficient of income elasticity of demand (η)
coefficient of non-compensated direct price elasticity
of demand (ε)
1996 +0.477 –0.462
2005 +0.583 –0.514
[image:4.595.63.289.666.750.2]Source: USDA
Table 3. changes in the demand of czech households for foods, beverages and tobacco in relation to the VAT rate changes
VAT rate change (from ν0 to ν1)
change in the consumer demand level (dQ/Q) × 100
From 10% to 14% –1.8359%
From 10% to 17.5% –3.3902%
From 10% to 20% –4.4724%
income tax rate by 5 percentage points would cause an increase of such consumer demand by 3.33%.
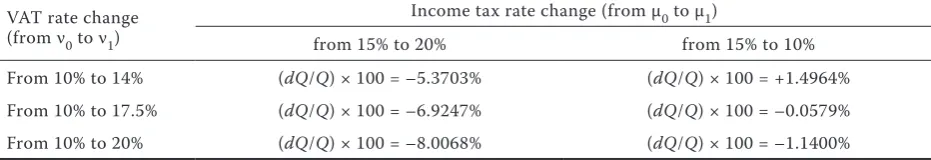
in the third part of the consumer behaviour analy-sis, we will see how the level of demand of czech households for foods, beverages and tobacco would change if the rates of both the monitored taxes were changed at the same time. To quantify the overall effect in the monitored consumer demand, we will use the differential equation (8.3), which represents the combination of equations (8.1) and (8.2). When applying (8.3), we will work with the same scenario as in the previous cases, see 1a), 1b), 1c) and 2a), 2b). The achieved results are summarised in the combina-tion table (Table 5).
The first column of results in the combination table (Table 5) demonstrates that the VAT rate in-crease by 10 percentage points with the concurrent increase in the physical persons’ income tax rate by 5 percentage points would cause a decrease in the volume of demand of czech households for foods, beverages and tobacco by up to 8%. if the increase in the physical persons’ income tax rate from 15% to 20% is accompanied by the VAT rate increase by 7.5 percentage points, then the level of the monitored consumer demand would decrease by about 7%. in the case of the VAT rate increase by 4 percentage points with the concurrent increase in the physical persons’ income tax rate by 5 percentage points, the level of demand of czech households for foods, bev-erages and tobacco would drop by 5.37%. We can see in Tab. 5 that the decrease in the physical persons’ income tax rate from 15% to 10% (second column
of results) would outweigh the increase in the VAT rate from 10% to 14%, so that the level of demand of czech households for foods, beverages and tobacco would finally increase by almost 1.5%. on the other hand, the decrease in the physical persons’ income tax rate from 15% to 10% would be insufficient to cover the VAT rate increase from 10% to 20%. in such a tax system setup, the level of demand of czech households for foods, beverages and tobacco would decrease by 1.14%. The provided combination table also includes a very interesting piece of information when the change in the level of consumer demand for foods, beverages and tobacco is more or less equal to zero (–0.0579%): the decrease in the income tax rate by 5 percentage points is almost exactly compensated for by the VAT rate increase from 10% to 17.5%.
Quantification of the relative change in the con-sumer demand for food caused by the tax rate changes, especially the VAT tax rate change, is also useful for making estimates of the relative changes in demand relations within the respective agriculture and food-processing industry verticals, i.e. in the demand of food dealers, food producers and last but not least, by producers of the original raw agricultural materials; helmberger and chavas (1996). in this context, we can consider that the level of demand in the market
of food final products (Q) determines the volume of
demand for the factor necessary for production of
the respective foods (X) in the method Q = 1/k × X,
respectively: Q k
X u (9)
where k represents the input-output coefficient, the
value of which is more or less fixed for a certain period within a certain production technology. The sensitivity of the analysed production relation (9) is then equal to one:
1 Q dQ
X
dX (10)
which impies the following:: Q
dQ X
[image:5.595.65.289.109.177.2]dX (11)
Table 4. changes in the demand of czech households for foods, beverages and tobacco in relation to the physical persons’ income tax rate changes
income tax change (from μ0 to μ1)
change in the consumer demand level (dQ/Q) × 100
From 15% to 20% –3.5344%
From 15% to 10% +3.3323%
[image:5.595.64.530.669.749.2]Source: calculations of the authors
Table 5. changes in the demand of czech households for foods, beverages and tobacco in relation to changes in the VAT rate and in the income tax rate
VAT rate change (from ν0 to ν1)
income tax rate change (from μ0 to μ1)
from 15% to 20% from 15% to 10%
From 10% to 14% (dQ/Q) × 100 = –5.3703% (dQ/Q) × 100 = +1.4964%
From 10% to 17.5% (dQ/Q) × 100 = –6.9247% (dQ/Q) × 100 = –0.0579%
From 10% to 20% (dQ/Q) × 100 = –8.0068% (dQ/Q) × 100 = –1.1400%
The derived relation (11) shows that the percentage change in the level of consumer demand for foods will be transferred, provided the technical and tech-nological conditions of production are not changed, in the same percentage volume to the secondary demand function; this means to the demand created by dealers, processors and farmers.
The paper was prepared within the research Plan of the Faculty of Business and Economics, Mendel Uni-versity of Agriculture and Forestry, czech Economy in integration and globalisation Processes and Development of the Agricultural Sector and Services Sector under the new conditions of the integrated Agrarian Market as a Part of Solving the Thematic Specialisation 4 “Development Trends in Agribusiness, Formation of Segmented Markets within commodity chains and Food networks in the Process of integration and globalisation and change of Agrarian Policy”.
referenceS
Bečvářová V. (2008): issues of competitiveness of today’s agriculture. Agricultural Economics – czech, 54: 399– 405.
cramer g.L., Jensen c.W. (1994): Agricultural Economics and Agribusiness. 6th ed. John Wiley & Sons, new York; iSBn 0-471-59552-7.
Deaton A. (1986): Demand Analysis. in: griliches z., intrili-gator M.D. (eds.): handbook of Econometrics, 3, chapter 30: 1767–1839. Elsevier Science Publishers BV, new York; iSSn 1573-4412, iSBn 978-0-44-486187-0.
helmberger P.g., chavas J.P. (1996): The Economics of Agricultural Prices. Prentice hall, new Jersey; iSBn 0-13-372640-1.
Koutsoyiannis A. (1979): Modern Microeconomics. 2nd ed. Macmillan, London; iSBn 0-333-25349-3.
Mundlak Y., Larson D.F., Butzer r. (1997): The Determi-nants of Agricultural Production: A cross-country Analysis. Policy research Working Paper, Series 1827, The World Bank.
nicholson W. (1992): Microeconomic Theory, Basic Prin-ciples and Extensions. 5th ed. Dryden Press, Fort Worth; iSBn 0-03055043-2.
Seale J.L. Jr., Walker, W.E., Kim, i.-M. (1991): The demand for energy: cross-country evidence using the Florida model. Energy Economics, 13: 33–40.
Seale J.L., Jr., regmi A., Bernstein J. (2003): international Evidence on Food consumption Patterns. Technical Bulletin/TB 1904, Economic research Service, U.S. Department of Agriculture, Washington, Dc.
Tvrdoň J. (1999): Econometrics. ČzU, Prague; iSBn 80-213-04282-0.
Arrived on 30th May 2011
Contact address: