A New Simple Route to ZnS Quantized Particles with
Tunable Size and Shape, and Size/Shape-Dependent
Optical Properties
Pengfei Hu1*, Yali Cao2, Yanyan Lou1, Bo Lu1, Min Shao1, Jiansen Ni1, Meng Cao3 1Laboratory for Microstructures, Shanghai University, Shanghai, China
2Institute of Applied Chemistry, Xinjiang University, Urumqi, China 3School of Materials Science and Engineering, Shanghai University, Shanghai, China
Email: *[email protected]
Received December 13,2012; revised January 20, 2013; accepted January 27, 2013
ABSTRACT
With the features of convenience and eco-friendly, the low-temperature solid-state reaction synthesis was successfully developed as a new approach to prepare quantum-sized ZnS nanocrystals. One major achievement is that the size and shape of ZnS nanocrystals can be tuned by adjusting the surfactant and its feed. The UV-Vis absorption spectra of quasi-spherical and one-dimensional quantum-sized ZnS nanocrystals all showed a blue-shift from the bulk counterpart, indicating large quantum confinement effects of ZnS nanocrystals. These ZnS nanocrystals all showed well-defined excitonic emission features. Contrastive studies on photoluminescence performances indicated that the band-edge emis-sion experienced only the size-dependent quantum confinement effect, while the trap-state emisemis-sion experienced the size- and shape-dependences. So we can design a purposeful synthesis route to ZnS nanocrystals with target lumines-cence emission performances.
Keywords: Solid-State Nanosynthesis; Tunable; Size- and Shape-Dependence; Optical Properties
1. Introduction
Owing to fascinating size-, and shape-dependent elec- tronic and optical properties, quantized semiconductor structures have attracted increasing attention [1-3]. It is well known, for instance, that the band gap of semicon- ductor nanostructure increases as the particle size de- creases when the dimension of nanocrystals approach to exciton Bohr radius, due to quantum-size confinement effect [4]. As one member of the important II-VI group semiconductors, zinc sulfide (ZnS, direct band gap of 3.7 eV) motivated worldwide enthusiasms of scientists. Quantized ZnS (Q-ZnS) particles and Q-ZnS-based het- erostructures have become essential light-harvesting and light-emitting components in modern technology such as imaging, diagnostics, biosensing, and display technolo- gies [5-7]. Up to now, some methodologies for synthe- sizing Q-ZnS have been demonstrated [8-10].Among most nanosynthsis techniques, surface-passivated tech- nology in solution-process received relatively more in- terest [3,4,8-11].It used surface-bonding ligands to re- press the agglomeration of primary colloidal nanocrystals and obtain free-standing nanoparticles. However, this
methodology generally requires complicated manipula- tions including delicate control of solution composition, reaction atmosphere, pH value, reaction temperature and time, even of temperature ramp. Therefore, it is neces- sary to explore simple and convenient strategies to pro- duce quantized structures with tunable size/shape and performance.
The low-temperature solid-state reaction synthetic ap- proach provided a relatively simple and powerful method for controlling the size and shape of nanoparticles [12, 13]. In view of the advantages of low cost, convenience, and lack of pollution, we introduced it to synthesize the Q-ZnS firstly. We fulfilled the size-, and shape-control of Q-ZnS through surfactant-assistanted technique, and the tunable optical behavior.
2. Experimental
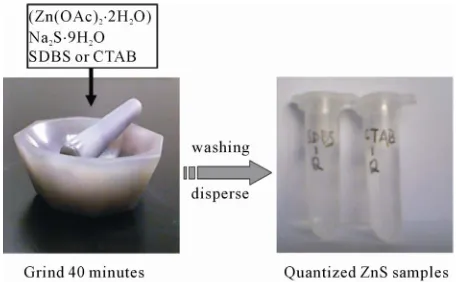
The manipulation for the synthesis of Q-ZnS through one-step solid-state reaction at room temperature was recorded and illustrated in Figure 1. The surfactants so- dium dodecyl benzene sulfonate (SDBS) and cetyl- trimethyl ammonium bromide (CTAB) were introduced to assist the synthesis, respectively. Zinc acetate dihy- drate (Zn(OAc)2·2H2O) powders were firstly blended
Figure 1. A convenient and effective recipe for quantized structures.
with an appreciable proportion of SDBS (Q-ZnS-i) or CTAB (Q-ZnS-ii) (MRSDBS orMRCTAB = 1:5, here, the
molar ratio of additive/Zn(OAc)2·2H2O was designated
as MR) and ground together for 10 min at room tem- perature, then sodium sulfide hydrate (Na2S·9H2O) was
added with 1:1 molar ratio between Zn(OAc)2·2H2O and
Na2S·9H2O. The mixtures were ground for about 30 min,
and centrifugation washed, respectively. Finally, the Q- ZnS samples were dispersed in deionized water, respec- tively, and clear solutions were obtained for following characterization.
3. Results and Discussion
3.1. Crystal Structures of ZnS Nanocrystals
The X-ray diffraction (XRD) patterns for as-prepared Q-ZnS-i and -ii clearly indicates that they have cubic phase with lattice constant as cross-referenced to JCPDS 65 - 9585 card (Figure 2(a)). Three characteristic dif- fraction peaks at 2θ values of 28.7/28.9, 47.4/47.4, and
56.5/56.6 to Q-ZnS-i and -ii can be indexed to the crystal planes of (1 1 1), (2 2 0) and (3 1 1). The cell constants were calculated to be a = b = c = 0.5382/0.5375 nm from (111) peaks of Q-ZnS-i and -ii after refinement. They revealed that the lattice contractions of Δa = 0.50% and 0.63% occurred against to the reported data (a = b = c = 0.5409 nm), which implied the smaller sizes of ZnS par- ticles and the high surface to volume ratio of nanocrys- tals. X-ray energy-dispersive spectroscopy (EDS) shown that the atom ratios of Zn to S are about 1:1.03 to Q-ZnS-i and 1:1.05 to Q-ZnS-ii, respectively (Figure 2(b)).
Additionally, the behaviors of SDBS and CTAB cap- ping on the ZnS nanoparticles were identified by FT-IR spectra. The FTIR spectra of Q-ZnS-i and SDBS are compared in Figure 3(a). It is obvious that the Q-ZnS-i hold the characteristic peaks of sulfonate around 1210 - 1025 cm–1 (denoted by the olive dotted ellipse in Figure
3(a)). In the FT-IR comparison of CTAB and Q-ZnS-ii, the transmission bands at 2920 and 2850 cm–1 in both are
similar and respectively assigned to the asymmetric and symmetric stretching vibrations of methylene (CH2) in
the long alkyl chain, as well as that the transmission bands of Q-ZnS-ii in the ranges of 965 - 720 cm–1 and
1390 - 1490 cm–1 are close to that of CTAB (the olive
dotted ellipses in Figure 3(b)).
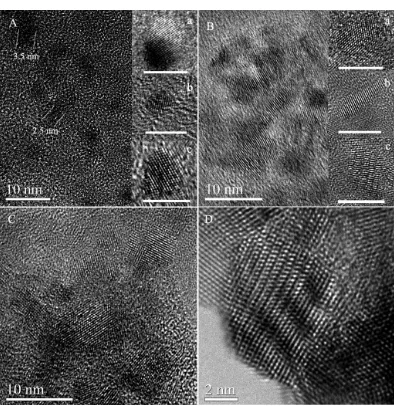
As shown in Figure 4A and insets a-c, the Q-ZnS-i nanocrystals are the quasi-spherical nanoparticles. The average size of these nanoparticles is 2.5 - 3.5 nm. The inset c of Figure 4A shows clear twin and stacking fault (SF) structures in a big nanoparticle. When CTAB was used as additive, the ZnS nanocrystals put up asymmet- rical growth. As shown in Figures 4B, insets, and S1, near one-dimensional nanocrystals were recognized clearly, such as acicula-shaped nanocrystal (inset b in
[image:2.595.72.525.522.720.2]Figure 3. FT-IR spectra of SDBS and Q-ZnS-i (a), and CTAB and Q-ZnS-ii (b).
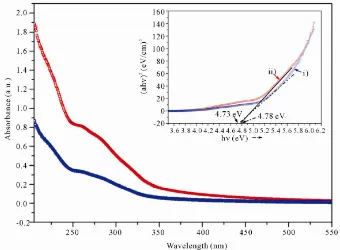
[image:3.595.101.498.274.680.2]ergy axis, as shown in inset of Figure 5. The band gap values were estimated to be 4.73 eV for Q-ZnS-i, whereas it is 4.78 eV for Q-ZnS-ii. The blue shift of the absorp- tion band compared to bulk counterpart causes the band gap widening which indicates that the as-prepared Q- ZnS-i and -ii offer strong quantum confinement effect.
Figure 4B). It is worthwhile to note that some nanocrys- tals show the wave-like structure containing a large number of SF and dislocation at troughs (inset c in Fig- ures 4B, D and S1). We shall see in a forthcoming sec- tion that these novel structures can affect the photolumi- nescence properties of nanocrystals. In addition, to in- vestigate the size control of particles in the solid-state reaction synthesis, MRSDBS was change to 1:10 to syn-
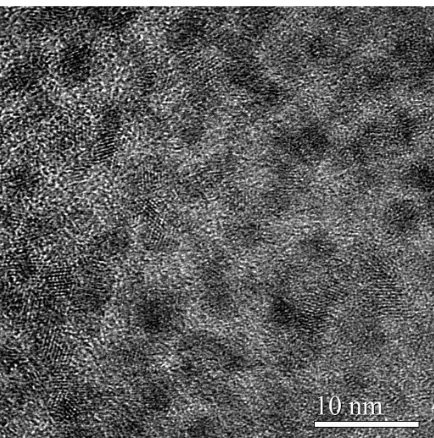
thesize the Q-ZnS-iii. The Q-ZnS-iii nanocrystals are do- minant with about 7 nm-sized quasi-spherical nanoparti- cles (Figure 4C).
3.2.2. Photoluminescence Studies
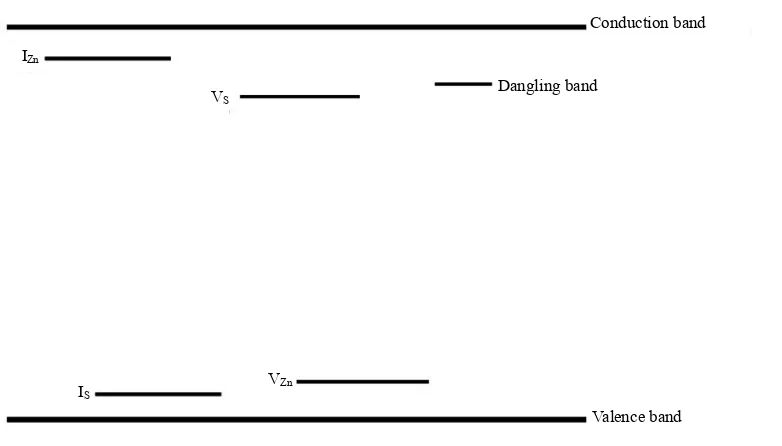
Photoluminescence is a luminescence phenomena that occurs in luminescent materials which can be excited to a higher energy state termed “excited state” after absorbing light at a specific wavelength, and then re-emit light with a lower energy through recombination of electron and hole [14,15]. Due to high sensitivity and non-destructive character, the photoluminescence (PL) technique has been widely used to investigate electronic structure of the surface of semiconductor nanoparticles. Many reports illustrated the luminescence mechanism of ZnS nanopar- ticles using the well-known energy-level diagram (Fig- ure S2). The valence band is considered as made up of hybridized s-p orbitals from sulfur and zinc atoms, while the conduction band is mainly consisted of the s-p anti- bond states of ZnS. Theoretically, luminescence emission includes band-edge emission and trap-state emission which is divided into shallow-trap and deep-trap emis- sion according to the difference of electron levels [16]. Trap-stated PL signals mainly originate in defects con- taining vacancies and interstitials of semiconductors. The defects can be categorized either shallow or deep level
3.2. Optical Properties of ZnS Nanocrystals
[image:4.595.128.468.448.698.2]3.2.1. UV-Vis Spectral Characteristics
Figure 5 shows the UV-Vis absorption spectera of the Q-ZnS-i and -ii. They almost remain the same shape which ends near 350 nm for about 3 nm-sized nanocrys- tals. Each of spectra is the superimposition of a relatively well-defined band with peaks around 264 (Q-ZnS-i) or 259 nm (Q-ZnS-ii), an ill-defined broad absorption be- tween 340 and 268 nm approximately, and a high energy intense absorption below 250 nm only displaying a tail of absorption pattern. These resolved superimpositions of experimentally obtained absorption curves imply the relatively wide size distribution of products. The band gap values were obtained from the optical absorption spectra by plotting (αhν)2 versus (hν), and then extrapo-
lating the linear region of (αhν)2 versus (hν) on the en-
Figure 5. Comparison of UV-Vis spectra of 3 nm quasi-spherical Q-ZnS-i (blue symbol scatter-i) with one-dimensional Q-ZnS-ii (red symbol scatter-ii). The inset is the plots of (αhν)2 vs. (hν) for Q-ZnS-i (blue symbol scatter-i) and Q-ZnS-ii (red
defect states. Shallow level traps, which are more spa- tially delocalized and lie near the conduction band or valance band edge, are more likely to participate in the radiative recombination. The emission occurs when a trapped electron recombines with a hole in the valence band or in some acceptor level such as zinc vacancies [17]. On the other hand, deep level traps tend to have a tendency to undergo non-radiative recombination by emitting phonons [16].
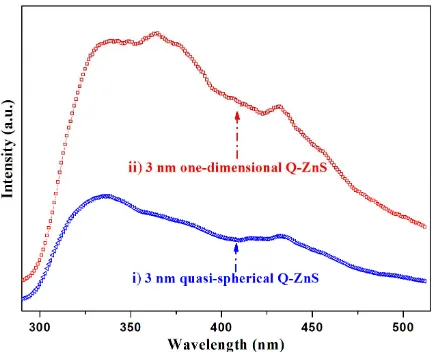
As far as we known, although many groups have put large efforts in studying the optical properties of ZnS nanocrystals, there have been few reports on the exci- tonic emission feature of ZnS nanocrystals, as well as the size- and shape-dependent emission characteristics. In most cases, only trap-state emission at around 450 nm was observed and discussed which is termed “tunneling luminescence” and controlled by defect and impurity, the size- and shape-dependent quantum confinement effects were neglected. Figure 6 shows the emission lumines- cence spectra of quasi-spherical (Q-ZnS-i) and one-di- mensional (Q-ZnS-ii) ZnS nanocrystals, respectively, they were measured at 250 nm of excitation wavelength. The spectra all reveal the well-defined excitonic and trap-stated emission features. Many shallow trapped emissions indicated that the present nanocrystals occu- pied a great deal of effects.
[image:5.595.64.282.520.696.2]Photoluminescence spectra of the quasi-spherical nanocrystals (Q-ZnS-i) showed broad violet emission peak centered at 342 nm accompanied by the broad asymmetry shoulder at 378 nm, and smaller hump-like blue emission peaks at 422 nm and 439 nm, and two weak shoulders at 456 and 500 nm, respectively. We attribute the 342 nm peak to a band-edge emission. The shoulder centered at 378 nm is assigned to the overlap-ping peaks involving electronic transitions from conduction band to
Figure 6. Comparison of photoluminescence spectra of the 3 nm quasi-spherical Q-ZnS-i (blue symbol scatter-i) with near one-dimensional Q-ZnS-ii (red symbol scatter-ii).
interstitial sulfur and interstitial zinc to valance band. In addition, blue emission peaks at 422 nm and 439 nm are assigned to the energy level of sulfur vacancies with the holes from the valance band, and interstitial zinc from interstitial sulfur, respectively, while the last peak at 500 nm which can be attributed to recombination of electrons at sulfur vacancies to the holes at zinc vacancies. It is particularly worth noting that the emission band at 456 nm was attributed to dangling sulfur bonds at the inter- face of ZnS in this paper. Although the deep-trap emis- sion at around 450 nm is ascribed to surface sulfur vacant sites in some literatures [18], we can exclude the peak at 456 nm from the trap-state emission because there is ex- cess sulfur in this report as demonstrated by the EDS data.
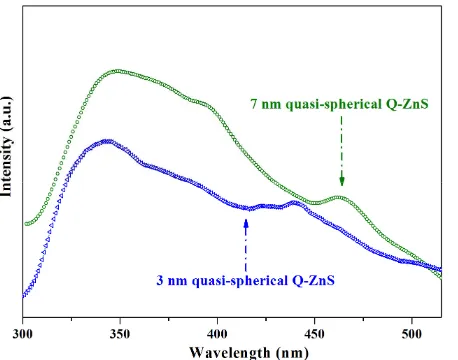
The emission spectra of near one-dimensional ZnS (Q-ZnS-ii) showed a band-edge emission feature at 340 nm, and high-intensity trap-state emissions about in range of 345 - 475 nm with well-defined peaks at 349, 365, and 432 nm, and broad shoulder at 455 nm. Com- pared to PL emission of quasi-spherical nanocrystals, the increase of intensity and shift of shallow-trapped emis- sion implied that the near one-dimensional ZnS possess more defects, and the trap-state PL experimenced shape- dependent quantum confinements. And the intensity of emission band at 455 nm, which is ascribed to arise from the dangling sulfur bonds at the interface of ZnS, slightly increased. On the other hand, the band-edge emission of 341 nm showed almost the same wavelength as that of quasi-spherical nanocrystals (342 nm). It is concluded in this work that the band-edge emission may be mostly dependent on size rather than shape. To further demon- strate the size-dependence of quantum confinement ef- fect to band-edge and trap-state emission, PL spectrum of 7 nm-sized quasi-spherical nanocrystals were got (Fig- ure 7). The PL spectrum showed band-edge emission at 349 nm, which was red-shifted 7 nm as that of 3 nm- sized quasi-spherical nanocrystals. And the trap-state emissions all show varying degrees of red-shifts.
To estimate the applicability of approach adopted in this work, we introduce it to synthesize the CdS nano- crystals with SDBS. The 3 nm-sized quasi-spherical CdS nanocrystals were successfully obtained (Figure S3).
4. Conclusion
Figure 7. Comparison of photoluminescence spectra of the 3 nm quasi-spherical Q-ZnS-i (blue symbol scatter-i), and 7 nm quasi-spherical Q-ZnS-iii nanocrystals (olive symbol scatter-ii).
sized ZnS nanocrystals exhibited the quantum confine- ment effect and unique well-defined excitonic emission features. The band-edge PL emission showed the mostly size-dependent quantum confinement effect, but the trap- state PL experienced the size- and shape-dependences.
5. Acknowledgements
This work was funded by Shanghai University Innova- tion Foundation, National Nature Science Foundation of China (Grant No. 21101132), and National Nature Sci- ence Foundation of China (Grant No. 61006089).
6. Supporting Information Available
The characterization, the images of Q-ZnS-ii nanoparti- cles with one-dimensional and wave-like structures and CdS QDs, and Schematic energy level diagram.
REFERENCES
[1] L. E. Brus, “A Simple Model for the Ionization Potential, Electron Affinity, and Aqueous Redox Potentials of Small Semiconductor Crystallites,” Journal of Chemical Phys- ics, Vol. 79, No. 11, 1983, pp. 5566-5571.
doi:10.1063/1.445676
[2] M. Nirmal and L. E. Brus, “Luminescence Photophysics in Semiconductor Nanocrystals,” Accounts of Chemical Research, Vol. 32, No. 5, 1999, pp. 407-414.
doi:10.1021/ar9700320
[3] X. G. Peng, L. Manna, W. D. Yang, J. Wickham, E. Scher, A. Kadavanich and A. P. Alivisatos, “Shape Control of CdSe Nanocrystals,” Nature, Vol. 404, No. 6773, 2000, pp. 59-61. doi:10.1038/35003535
[4] V. I. Klimov, A. A. Mikhailovsky, S. Xu, A. Malko, J. A. Hollingsworth, C. A. Leatherdale, H.-J. Eisler and M. G.
Bawendi, “Optical Gain and Stimulated Emission in Nanocrystal Quantum Dots,” Science,Vol. 290, No. 5490, 2000, pp. 314-317. doi:10.1126/science.290.5490.314 [5] X. Michalet, F. F. Pinaud, L. A. Bentolila, J. M. Tsay, S.
Doose, J. J. Li, G. Sundaresan, A. M. Wu, S. S. Gambhir and S. Weiss, “Quantum Dots for Live Cells, in Vivo Im- aging, and Diagnostics,” Science, Vol. 307, No. 5709, 2005, pp. 538-544. doi:10.1126/science.1104274
[6] T. H. Kim, K. S. Cho, E. K. Lee, S. J. Lee, J. Chae, J. W. Kim, D. H. Kim, J. Y. Kwon, G. Amaratunga, S. Y. Lee, B. L. Choi, Y. Kuk, J. M. Kim and K. Kim, “Full-Colour Quantum Dot Displays Fabricated by Transfer Printing,”
Nature Photonics, Vol. 5, No. 3, 2011, pp. 176-182. doi:10.1038/nphoton.2011.12
[7] C. L. Cowles and X. S. Zhu, “Sensitive Detection of Car- diac Biomarker Using ZnS Nanoparticles as Novel Signal Transducers,” Biosensors and Bioelectronics, Vol. 30, No. 1, 2011, pp. 342-346. doi:10.1016/j.bios.2011.09.034 [8] K. E. Sapsford, I. L. Medintz, J. P. Golden, J. R. Des-
champs, H. T. Uyeda and H. Mattoussi, “Surface-Immo- bilized Self-Assembled Protein-Based Quantum Dot Na- noassemblies,” Langmuir, Vol. 20,No. 18, 2004, pp. 7720- 7728. doi:10.1021/la049263n
[9] Y. W. Zhao, Y. Zhang, H. Zhu, G. C. Hadjipanayis and J. Q. Xiao, “Low-Temperature Synthesis of Hexagonal (Wurt- zite) ZnS Nanocrystals,” Journal of the American Che- mical Society, Vol. 126, No. 22, 2004, pp. 6874-6875. doi:10.1021/ja048650g
[10] Y. J. Zhang, H. R. Xu and Q. B. Wang, “Ultrathin Single Crystal ZnS Nanowires,” Chemical Communications,Vol. 46, No. 47, 2010, pp. 8941-8943. doi:10.1039/c0cc02549f [11] C. B. Murray, C. R. Kagan and M. G. Bawendi, “Synthesis and Characterization of Monodisperse Nanocrystals and Close-Packed Nanocrystal Assemblies,” Annual Review of Materials Science, Vol. 30, No. 1, 2000, pp. 545-610. doi:10.1146/annurev.matsci.30.1.545
[12] R. F. Service, “Don’t Sweat the Small Stuff,” Science, Vol. 320, 2008, pp. 1584-1585.
doi:10.1126/science.320.5883.1584b
[13] P. F. Hu and Y. L. Cao, “A New Chemical Route to a Hybrid Nanostructure: Room-Temperature Solid-State Re- action Synthesis of Ag@AgCl with Efficient Photocata- lysis,” Dalton Transactions, Vol. 41, No. 29, 2012, pp. 8908-8912. doi:10.1039/c2dt30779k
[14] S. Kulmala and J. Suomi, “Current Status of Modern Ana- lytical Luminescence Methods,” Analytica Chimica Acta, Vol. 500, No. 1-2, 2003, pp. 21-69.
doi:10.1016/j.aca.2003.09.004
[15] W. G. Becker and A. J. Bard, “Photoluminescence and Photoinduced Oxygen Adsorption of Colloidal Zinc Sul- fide Dispersions,” The Journal of Physical Chemistry, Vol. 87, No. 24, 1983, pp. 4888-4893.
doi:10.1021/j150642a026
[17] S. Wageh, Z. S. Ling and X. X. Rong, “Growth and Op- tical Properties of Colloidal ZnS Nanoparticles,” Journal of Crystal Growth, Vol. 255, No. 3-4, 2003, pp. 332-337. doi:10.1016/S0022-0248(03)01258-2
[18] J. H. Yu, J. Joo, H. M. Park, S. Baik, Y. W. Kim, S. C.
Kim and T. Hyeon, “Synthesis of Quantum-Sized Cubic ZnS Nanorods by the Oriented Attachment Mechanism,”
Characterization
The crystalline structures of the products were analyzed by a powder X-ray diffractometer (XRD, MXP18AHF, MAC) with Cu-Kα radiation (λ = 0.154056 nm). The morphologies, microstructures, and crystal lattice of the obtained samples were characterized by transmission
[image:8.595.137.459.170.477.2]electron microscopy (TEM, JEM-2010F at 200 KV). The UV spectra were recorded on a spectrophotometer (HI- TACHI U-3310) at room temperature. The photolumi- nescence spectra were obtained by using a HITACHI F-4500 fluorescence spectrophotometer at room tem- perature.
Figure S1. HRTEM images of Q-ZnS-ii nanoparticles with one-dimensional and wave-like structures.
Valence Conduction band
IZn
Dangling band VS
band VZn
IS
[image:8.595.109.500.502.725.2]