METHOD DEVELOPMENT AND VALIDATION OF
SPECTROPHOTOMETRIC DETERMINATION OF AZATHIOPRINE
IN BULK AND TABLET FORM
Dr. Smruti Tekale*, Dr. Prafullachandra Tekale** and A. P. Rajale***
*Assistant Professor, Department of Applied Sciences, Vidyalankar Institute of Technology, Mumbai.
**Assistant Professor, Department of Chemistry, G. N. Khalsa College, Matunga, Mumbai-400019.
***Associate Professor, Department of Chemistry, R.K.T. College, Ulhasnagar.
ABSTRACT
A simple, accurate, and precise spectrophotometric determination of Azathioprene was carried out at 285 nm. It was validated in terms of linearity, accuracy, precision, limits of detection and limits of quantification. This method proposed rapid spectrophotometric determination at room temperature. The method is simple, inexpensive and efficient for use in the analysis of bulk and pharmaceutical tablet dosage form.
KEYWORDS: Azathioprene, spectrophotometric, validation.
INTRODUCTION
[image:1.595.241.352.641.744.2]Azathioprine is Immunosuppressive agent utilized to stop rejection in organ transplantation It is a prodrug of 6-Mercaptourine.[1] Chemically it is 6-[(1-Methyl-4-Nitro-1H imidAzathioprinel-5yl) sulfanyl]-7H-purine.[2]
Figure 1: Chemical structure of Azathioprine.
Volume 6, Issue 4, 1643-1649. Research Article ISSN 2277–7105
Article Received on 18 Feb. 2017,
Revised on 10 March 2017, Accepted on 31 March 2017
DOI: 10.20959/wjpr20174-8296
*Corresponding Author Dr. Smruti Tekale Assistant Professor,
Department of Applied
Sciences, Vidyalankar
Institute of Technology,
It is a pale-yellow powder, practically insoluble in water and in alcohol.[3] It is soluble in dilute solutions of alkali hydroxides and sparingly soluble in dilute mineral acids. The oral route of the drug is considered to be most convenient for administration of drugs to patients. Oral administration of conventional dosage forms normally dissolves in the stomach fluid or intestinal fluid and gets absorbed from these regions of the gastrointestinal tract (GIT) depending upon the physicochemical properties of the drug. Azathioprine colon targeted tablets were prepared by using compression coating technology. Initially internal core tablet containing drug and super disintegrate was formulated.[4]
Spectrophotometric method is simple and rapid analytical methods.[5-9] Few spectrophotometric methods of Azathioprene and its derivatives are reported.[4,10-11] A simple, rapid, accurate and economical UV-spectrophotometric method has been developed for estimation of Azathioprine from bulk and pharmaceutical formulation.
MATERIALS AND METHODS
Instrumentation: All absorption measurements were made using UV 2100 spectrophotometer (Shimadzu) with glass cells of path length 1 cm was used.
Materials: Pharmaceutical grade Azathioprine (99.5%) pure was used. It was used without further purification. Tablets containing Azathioprene were purchased from local market. Distilled water was used wherever required. All other chemicals used were of analytical reagent grade.
Preparation of standard stock solution
Accurately weighed 10 mg of Azathioprine was transferred to 100 ml volumetric flask, dissolved in 20 ml methanol by shaking manually for 10 min. The volume was adjusted with the same up to the mark to give final strength i.e. 100 μg/ml. Filter the resultant stock solution using Whatmann filter paper (no. 41) to get the clear solution.
Preparation of solution of Commercial Dosage Forms
RESULT AND DISCUSSION Determination of max
[image:3.595.143.454.189.383.2]Solution of Azathioprine (1.0 μg/mL) was scanned between 200 - 400 nm wave length to find λmax of the drug using methanol as blank. Azathioprine showed absorption maxima at 285 nm
[image:3.595.144.454.561.742.2](Figure 2).
Figure 2: Determination of max.
Linearity determination
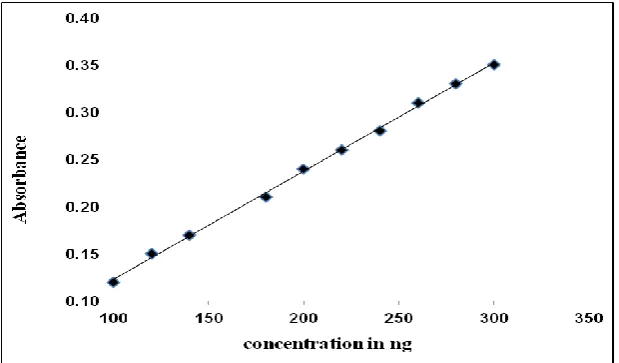
Linearity range of Azathioprine was determined from calibration curve. From the stock solution of Azathioprine (10 μg/mL) various concentrations of drug from 0.1- 3.0 μg/mL were prepared by transferring aliquots of stock solution to volumetric flasks of 10 mL and made upto the mark according to the concentration required. Their absorbance values were recorded at 285 nm, calibration curve were plotted as absorbance vs concentration (Figure 3)
Method Validation
The current method was validated according to the International Council of Harmonization (ICH) guidance in terms of linearity, accuracy, precision, limits of detection, limits of quantification and selectivity.
Linearity
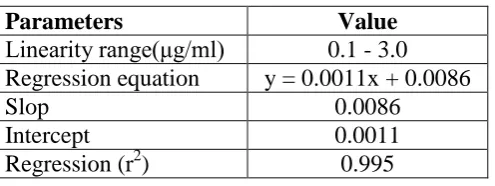
[image:4.595.177.425.283.376.2]linearity of the proposed method was determined by analyzing the solutions of Azathioprine in the range of 0.1 - 3.0 μg/mL at 285nm. The Regression Coefficient (r2) was found to be 0.995.
Table 1: Linearity Parameters.
Parameters Value
Linearity range(μg/ml) 0.1 - 3.0 Regression equation y = 0.0011x + 0.0086
Slop 0.0086
Intercept 0.0011 Regression (r2) 0.995
LOD and LOQ
The limit of detection (LOD) and limit of quantification (LOQ) was established by evaluating the minimum level at which drug solution can be readily quantified with accuracy. LOD and LOQ were calculated according to the 3.3 and 10 δ/s criteria, respectively, where δ is the standard deviation of the response and s is the slope of the corresponding calibration curve.
Table 2 LOD and LOQ.
LOD (μg/mL) LOQ (μg/mL)
0.09 0.32
Accuracy and Recovery study
To further assess the accuracy of the proposed methods, recovery experiment was performed by applying the standard-addition technique. Samples were taken and standard drug was spiked at three different levels i.e. 80, 100, and 120%. The % recovery and % RSD were calculated (Table 3).
Table 3: Accuracy and Recovery study.
Level Amount taken (μg/mL)
Amount added (μg/mL)
% Recovery (Mean ± % S.D)
% R.S.D
Precision
Precision of method was estimated from repeatability and reproducibility. The intraday and interday precision of the method were confirmed by measuring absorbance of six replicate samples of Azathioprine three times in a day and also on two different days. Percentage relative standard deviation (% RSD) values were found to be 0.39 % and 0.44 respectively. Since the values are less than 2% hence the method is precise.
Robustness and ruggedness
Robustness and ruggedness of the method was tested by making small changes in the experimental procedure. The analysis was carried out by four analysts and also by a single analyst performing analysis on four different instruments in the same laboratory. Intermediate precision values (% RSD) in both instances were in the range 0.2 – 3.1% indicating acceptable ruggedness.
CONCLUSION
Beer’s law was obeyed in the range of 0.1 - 3.0 μg/mL for Azathioprine having correlation coefficient of 0.995. The method has been successfully applied for the analysis of drugs in tablet formulation. The percent recovery was found from 99.84 to 100.01%. Hence the proposed method is precise and reproducible. Limit of detection (LOD) and Limit of quantification (LOQ) of drug were 0.09 and 0.32 μg/mL, respectively. Interday and intraday studies showed good repeatability of the applied method. Percentage relative standard deviation values were found to be less than 2% for proposed methods which illustrate the good precision. It was concluded that proposed method was versatile, cheaper, accurate, selective, precise and rapid for the analysis of Azathioprine in bulk powder and tablets. The methods have many advantages over the separation techniques such as HPLC and include reduced cost and speed with high accuracy.
REFERENCES
1. P. B.Mohite, Ramdas B.Pandhare, Shantaram G.Khanage, Vinayak K.Deshmukh, Sandip H.Bodkhe. Derivative spectrophotometric estimation of Azathioprine in bulk drug and pharmaceutical dosage forms. ACAIJ, 2009; 8(1): 54 -55.
2. Indian Pharmacopoeia, Govt of India Ministry of Health and FamilyWelfare, Published By The Indian Pharmacopoeia Commission, Ghaziabad. 2007;2: 144, 756, 757.
4. Smita S, Mukesh S, Spectrophotometric and atomic absorption spectrometric Determination and validation of azathioprine in API and pharmaceutical dosage form. J. of Optoele. Biomed. Mate., 2010; 2(4): 213 – 216.
5. A. P. Rajale, Prafullachandra Tekale and Smruti Tekale. Development and Validation of Spectrophotometric Determination of Mycophenolate mofetil in Bulk and tablet form. Der Chemica Sinica. 2016; 7(4): 20-23.
6. P. P. Tekale, Smruti P. Tekale, Sudheer K. Lingayat, Chandra B. Maurya and A. P. Rajale. Development of Selective Extractive Spectro-photometric Method for determination of Aluminum (III) from Synthetic Mixtures, Water and Alloy Samples by using 1-phenyl-1- hydrazonyl-2-oximino propane –1,2–dione Reagent. International Journal of Inorganic and Bioinorganic Chemistry, 2012; 2: 23-25.
7. P. P.Tekale, R. S Lokhande, S. K Lingayat, R. R. Shelar, A. C. Suthar, S. P.Tekale. Extractive Spectrophotometric Determination of Cobalt (II) and Iron (II) From Pharmaceutical Samples. International Journal of Pharma World Research. 2010; 1: 1- 4. 8. Prafullachandra Tekale, Smruti Tekale, Sudheer Lingayat and P N Pabrekar. Extractive
Spectrophotometric Determination of Copper (II) using 1-phenyl-1-hydrazonyl-2- oximino propane –1, 2 –dione. Science Research Reporter, 2011; 1: 83.
9. Tekale P P, S P Tekale and S K Lingayat. Extractive spectrophotometric estimation of manganese (II) from water, food and pharmaceutical samples using 1-Phenyl-1-Hydrazonyl-2-Oximino Propane –1, 2 –Dione Reagent. Bioscience Discovery, 2011, 2: 155.
10.Bhaskar M, Manohara Y N, Gayasuddin M, Balaraju M and Bharath Kumar T. Spectrophotometric determination of azathioprine in bulk and pharmaceutical dosage forms. Int. J. of Chem Tech Research., 2010; 2(1): 376-378.
11.P. S. Jain and S. J. Surana. INTERNATIONAL JOURNAL OF UNIVERSAL PHARMACY AND BIO SCIENCES DEVELOPMENT AND VALIDATION OF UV-SPECTROPHOTOMETRIC METHOD FOR DETERMINATION OF AZATHIOPRINE IN BULK AND IN FORMULATION, 2012; 1(2): 49-58.
12.Janine. E.P. and Friedman, J.M. Tetral, 2002; 65(2): 240.
13.Smita, S. and Mukesh, S. J Optoele Biomed Mate, 2010; 2: 213.
14.Fazio, T.T., Singh, A.K., Maria E.R., Kedor-Hackmann, Rocha, S. J Pharm Biomed Anal 2007; 43: 1495.
15.Boulieu, R. and Lenoir, A. J Chromatogr, 1993; 615: 352.
17.El-Yazigi, A. and Wahab, F.A. Ther Drug Mon, 1992; 14(4): 312.
18.Peter, J. S, Ahmed, A. and Yan, W. J Pharm Biomed Anal, 2006; 41: 883.
19.Gorog, S. Identification and Determination of Impurities in Drugs. Elsevier Science Publishing Company, Amsterdam, 2000; 154.