IJPAR |Vol.6 | Issue 2 | April - June -2017
Journal Home page: www.ijpar.com
Research article Open Access
Analytical method development and validation of gabapentin in bulk and
tablet dosage form by using UV spectroscopic method
V.Sowmya*, V. Shirisha, B.Sairaju, M.Sushma, Ch.Nagamani, A.Thanga Thirupathi,
M.Alagar Raja & K.Rajeswar Dutt
Department of Pharmacology, Nalanda College of Pharmacy, Nalgonda, Telengana, India
*Corresponding Author: V.SowmyaABSTRACT
A simple, accurate, precise and economic spectrophotometric method has been developed for the determination of Gabapentin in their bulk powder and pharmaceutical dosage form. Gabapentin showed maximum absorbance at 216 nm with Methanol as solvent. Beer’s law was obeyed in the concentration range 10-60 μg/ml with regression coefficient of 0.999. The concentration of active component were then determined from the calibration curve obtained by measuring the amplitude at 216 nm for gabapentin. Accuracy and precision of the developed methods have been tested in addition recovery studies have been carried out in order to confirm their accuracy. The method was validated in terms of linearity, precision, accuracy (99.2-101.5%w/w) and specificity. This method is simple, precise, accurate, sensitive and reproducible and can be used for the routine quality control testing of the marketed formulations.
Keywords:
Gabapentin, Methanol, UV spectrophotometric estimation, Method development, Validation
INTRODUCTION
Gabapentin is an Antiepileptic, molecular
formula C19H17NO2, IUPAC name
2-[1-(aminomethyl) cyclohexyl] acetic acid. Mechanism action of drug involves interacts with cortical neurons at auxiliary subunits of voltage sensitive calcium channels. Gabapentin increases the synaptic concentration of GABA responses at non
synaptic sites in neuronal tissue and reduces the release of mono-amine neurotransmitters [1-6].
According to literature review [3-6] there are very few method reported for the determination of Gabapentin in different Instrumental techniques, out of these methods only 1 method were reported in Single Drug by using UV spectroscopic method.
Figure: 1. Shows structure of Gabapentin
EXPERIMENTAL SECTION
Standard drugs
Gabapentin was procured from the HETERO Pharma.
Chemicals and reagents
Methanol (FINER chemical LTD), Purified water (Rankem chemicals).
Instruments
UV (SHIMADZU), UV (Elico SL-196), Sonicator (Analytical technologies).
Determination of absorption maxima by
UV/Visible Spectrophotometry
Accurately weigh 100 mg of drug in to 100 ml volumetric flask. To this add 75 ml of diluent Methanol and sonicate it and further make up the volume with diluent. From this take 3 ml and make up to10ml. The solutions were scanned in the range of 200-400 nm in 1cm cell against blank
Figure: 2. Shows UV spectrum of Gabapentin
Preparation of mobile phase
Accurately measured 100 ml of Methanol, were degassed in an ultrasonic water bath for 10minutes and then filtered through 0.45 μ nylon filter under vacuum filtration.
Diluent
10ml of solvent mixture sonicate to dissolve. Cool the solution to room temperature and dilute to volume with solvent mixture. Transfer 3ml of above solution in to a 10ml volumetric flask and make up the volume with diluent.
Solvent - methanol
Method validation
The following parameters were considered for the analytical method validation of Gabapentin in bulk form & tablet dosage form.
System Suitability
Chromatograph the standard preparations (6 replicate concentrations) and measure the absorbance evaluate the system suitability parameters as directed.
Accuracy
For accuracy determination, three different concentrations were prepared separately 50%, 100% and 150% for the concentration of absorbance values is recorded.
Precision
The standard solution was placed into cuvettes for six times and measured for all six concentrations absorbance values by using max in UV. The %RSD for the area of six replicate
in method parameters and provides an indication of its reliability during normal usage. Wavelength was varied between plus or minus to. The solutions were made in triplicates and were analysed the %RSD is determined.
Linearity and range
Linearity of the analytical method for assay by placing the linearity solutions prepared in the range of 10μg to 60μg of test concentration, into the cuvettes, covering minimum 6 different concentrations.
RESULTS AND DISCUSSION
Standard preparation
Accurately weigh 25 mg of Gabapentin and transfer in to 25ml volumetric flask. Add about 10ml of solvent mixture sonicate to dissolve. Cool the solution to room temperature and dilute to volume with solvent mixture. Transfer 3ml of above solution in to a 10ml volumetric flask and make up the volume with diluent.
Figure: 4. Shows UV absorption spectrum of Gabapentin sample Validation
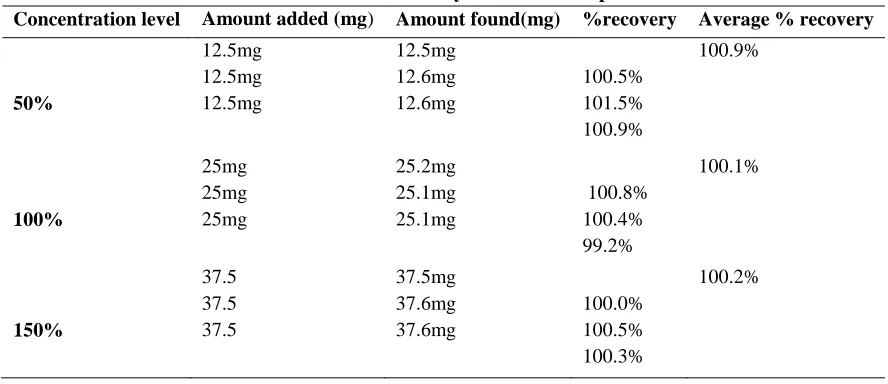
Accuracy
Average recoveries of Gabapentin are 100.9%, 100.1%, 100.2%, at 50%, 100% & 150% concentrations level respectively. The percentage
recoveries of the drug is within the limits 98-100%. So the method is accurate, accuracy data for gabapentin are presented in;
Table: 01 .Shows Accuracy results of Gabapentin
Concentration level Amount added (mg) Amount found(mg) %recovery Average % recovery
50%
12.5mg 12.5mg 12.5mg
12.5mg 12.6mg 12.6mg
100.5% 101.5% 100.9%
100.9%
100%
25mg 25mg 25mg
25.2mg 25.1mg 25.1mg
100.8% 100.4% 99.2%
100.1%
150%
37.5 37.5 37.5
37.5mg 37.6mg 37.6mg
100.0% 100.5% 100.3%
100.2%
Result
The accuracy for the average of triplicate in each concentration samples are within the limit.
Table: 2. Shows % Recovery of gabapentin
Amount added (mg) Amount found(mg) Average % recovery
30 0.527
30 0.527
30 0.526
30 0.526
30 0.527
Mean 0.526666
SD 0.00051
%RSD 0.0980504
Linearity
The response was found linear over a concentration range of 10-60 μg/mL of Gabapentin.
The correlation co-efficient were found to be 0.999 for Gabapentin. So the method is linear, data is presented in Table: 4.
Linearity curve of Gabapentin is given in figure: 3.
Table: 4 Shows linearity results of gabapentin S.no Linerty level Concentration Area
1 I 10µg 0.14
2 II 20 µg 0.261
3 III 30 µg 0.4
y = 0.1334x + 0.0019 R² = 0.9996
0 0.1 0.2 0.3 0.4 0.5 0.6 0.7 0.8 0.9
10 20 30 40 50 60
Series1
Linear (Series1)
LINEARITY OF GABAPENTIN
4 IV 40 µg 0.54
5 V 50 µg 0.672
6 VI 60 µg 0.799
Correlation Coefficient
0.999
Intercept Y=0.133x+0.001
Slope 0.001
Robustness
The Robustness of the method was determined by making slight changes in the experimental conditions such as change in the wavelength.
Table: 05. Shows Results of Robustness S.No Parameter Name Average Results Obtained in 6 units
Mean Gabapetin drug in mg Gabapentin drug in %
1 Robust wavelength 215 nm 1.43 98.72 99.2
2 Robust wavelength 216 nm 1.38 99.24 100
3 Robust wavelength 217nm 1.49 100 100.5
4 Robust wavelength 218 nm 1.30 99.61 100.3
5 Robust wavelength 219nm 1.22 98.13 100.1
Mean 100.2
Standard deviation 0.49
%RSD 0.4
Limit of Detection (LOD) & LOQ
The detection limit is determined by the analysis of samples with known concentration of analyse and by establishing that minimum level at which the analyse can reliably detected , The LOD are calculated from the calibration curve by formula LOD = 3.3 x SD/ b The quantification
limit is generally determined by the analysis of sample with known concentrations of analyse and by establishing the minimum level at which the analyse can be quantified with acceptable accuracy and precision, The LOQ are calculated from the calibration curve by formula LOQ = 10 x SD/ b
Table: 06. Shows LOD & LOQ results of Gabapentin Parameters Gabapentin
LOD 2.97µg/ml
7 LOD - 2.97(µg/ml)
8 LOQ - 9(µg/ml)
CONCLUSION
Method development & validation of Gabapentin was done by Uv-Visible spectroscopic method. The estimation was done by using mobile phase as methanol. The linearity range of gabapentin was found to be 10-60 µg/ml. Correlation coefficient value was 0.999, values of % RSD was 0.09 which is within the limit. These
results show the method is accurate, precise& sensitive. The spectroscopic method is more rapid. The proposed method is successfully applied to the bulk and tablet dosage form. The method was found to be having suitable application in routine laboratory analysis with high degree of accuracy and precision.
REFERENCES
[1]. http://www.drugbank.ca/drugs/DB00996 [2]. https://pubchem.ncbi.nlm.nih.gov>gabapentin
[3]. B.Lakshmi, RP-HPLC method development for the analytical quantification of Gabapentin from formulation, international journal of science and technology, 2(1), 2012, 84-92.
[4]. R.Vani,sumaiya hyder stability indicating method development and validation of rp-hplc method for simultaneous estimation of gabapentin and mecobalamine in bulk dosage form, world journal of pharmacy and pharmaceutical sciences, 3(12), 2014, 1095-1106.
[5]. T.Deepam, V.Alekhya, Ch.Swapnika and M.D Dhanaraju Method development and validation of Gbapentin and estimation Gabapentin tablets by uv spectroscopy, Global Journal of Pharmacology, 9(3), 2015, 251-255. [6].Patel satish ambalal, patel natavarlal.j visible spectrophotometric methods for determination of Gabapentin in