3
Management summary
Health care costs are rising, the Dutch population is aging, and the government and health care insurers are cutting costs. These are only a few of the current developments in the Dutch health care sector, which obliges every hospital to take a closer look at their current processes. Medisch Spectrum Twente (MST) is one of the Dutch hospitals that needs to rearrange their processes in order to keep delivering the quality of care they do. The MST hospital found out their processes are too much organized around the specialties and departments instead of around the patient, which results in a lack of alignment between the several steps a patient follows through the hospital. Therefore, the hospital started an efficiency program where every step of the total chain of care, from the first patients visit up to their discharge, needs to be reviewed and improved.
This research takes a closer look at the alignment between the most expensive department of the hospital, the operating room (OR) department, and several nursing wards. Personnel members of both departments encounter problems as an effect of a deficiency between the two departments. The OR planning department aims to maximize the OR utilization since these expensive resources need to be used as much as possible. However, they barely have any insight in the consequence of their schedule for the nursing wards. The personnel members at the nursing wards encounter a strongly fluctuating bed utilization at the wards, since the OR scheduling department does not consider the length of stay of the patients they schedule, and to which ward these patients will flow. Therefore, the main research question is:
“How can the MST hospital reduce the variability in bed utilization at the nursing wards, while the OR capacity will be used in an efficient way?”
The objective is to propose a new way of scheduling where the OR scheduling department can take into account the patient characteristics in order to minimize the variability at the nursing wards. Moreover, when a forecast can be made for the nursing departments of how many and what type of patients will enter their ward, a more accurate personnel planning can be made.
During a literature study, we found a mathematical programming model (Glerum, 2014) which is designed to address a similar problem. After determining several patient types, this quadratic assignment problem (QAP) model can be used to schedule these patients while minimizing the variability in the number of patients at the nursing wards. After some adaptations, the model was suitable to use in the context of the MST hospital. Using historical data and in consultation with the 17 surgical specialties, we designed 118 patient groups and calculated their stochastic length of stay and average surgery duration. Using the mathematical model and current master surgical schedule (MSS), which is the OR division amongst the specialties, we were able to design a schedule which states how many and what kind of patients should preferably be treated per day, in order to create a more constant and predictable flow to the wards. Multiple plan-do-check-act (PDCA) cycles with a multidisciplinary team are performed in order to improve the accuracy of the patients group characteristics and the generated schedule.
4
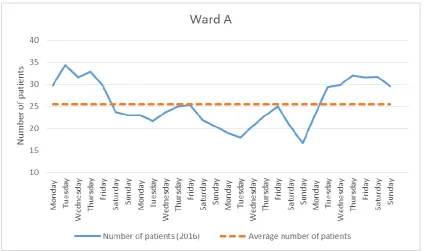
Figure 1. Results of reducing variability at Ward A. (n=56, T=28 days, source: MST data)
Moreover, a second experiment is performed in order to find out if additional OR time will improve the results even more. Table 1 shows the results of the first experiment (with current OR capacity) and the second experiment (with additional OR capacity) compared to the realized situation of 2016. The value of the objective function is the quadratic deviation of the average bed utilization divided by the number of bed types per day.
Table 1. Results of the 2 experiments compared to the current situation.
Realized situation 2016 Experiment 1 Experiment 2
Objective function value 13.1 9.49 9.28
Average OR utilization 80% 80% 72%
Experiment running time N/A 373 sec 738 sec
Based on the results of these experiments, we recommend to use the model to schedule patient types in the current MSS, in order to decrease the variability at the nursing wards. However, we do not recommend to increase the current OR capacity, since the benefits of adding one additional OR does not outweigh the costs of realizing increased capacity.
Using the model, we have to deal with some restrictions. First of all, it might be possible that one patients visits multiple wards after surgery, this cannot be taken into account in the model. Also visiting the recovery, PACU, or IC department after surgery is not taken into account since this is patient related and not necessarily surgery related. Moreover, we have to deal with limited resources and equipment. If multiple surgeries who need the same equipment, can be scheduled on the same day depends on the sequence of the surgeries. This sequence cannot be determined by the model since this is, again, influenced by patient related factors. Next, the model uses a cycle horizon of 28 days. The model calculates the number of patients in the system at the start of the cycle based on the end of the current cycle. However, in practice this is based on the previous cycle, that might look somewhat different. Also, due to this cycle of 28 days, the model can only calculate the number of patients at the wards on a daily level, and not on an hourly or minutes level.
5
7
Preface
This master thesis is the final result of my study Industrial Engineering & Management. After my bachelor I chose the Production and Logistic Management track since I never had the intention to work or perform research in the health care sector. However, the enthusiasm and passion of Erwin Hans about health care convinced me to follow some of the health care track courses, and also perform a capita selecta assignment in a hospital. This triggered my interest towards the health care sector even more and it showed the various opportunities for optimization in this sector which I never thought of. This ultimately resulted in this master thesis, performed at the Medisch Spectrum Twente hospital in Enschede.
Although this is the final part of my study, I hope this report can be the starting point for Medisch Spectrum Twente to improve the alignment between the operating room department and their various nursing wards, and eventually optimize their total chain of care step by step.
Performing my research at Medisch Spectrum Twente was a great learning experience. Designing a new scheduling method turned out to be even more complex than I thought, fortunately many people at the hospital were willing to help me during this project. Therefore, I would like to thank some people for their contribution. First, I would like to thank Thijs Schopman for being my supervisor at Medisch Spectrum Twente despite his own busy schedule. I learned a lot of our weekly meetings and thanks to his experience at the hospital I gained a lot more insights in the complex hospital environment and all its connected processes and (in)possibilities. Next, I would like to thank Paul and Rein for accompanying me every day, and their support and help.
Next, I would like to thank Erwin Hans and Nardo Borgman for their guidance and feedback, which definitely improved my report and gained new insights. Furthermore, I also received a lot of support at home from my family, friends and housemates, for which I would like to thank them.
I am proud to show the results of my research in this report and I hope you will enjoy reading it.
9
Table of contents
Management summary ... 4
Preface ... 7
List of abbreviations ... 11
Chapter 1. Introduction ... 13
1.1 Context description ... 13
1.2 Problem description ... 15
1.3 Research objective ... 15
1.4 Research questions ... 16
1.5 Research methodology: FOCUS-PDCA... 17
Chapter 2. Literature review ... 19
2.1 Definition(s) of a master surgical schedule (MSS) ... 19
2.2 Types of MSS scheduling ... 19
2.3 Types of variability ... 20
2.4 Operating room planning models ... 21
Chapter 3. Problem analysis ... 23
3.1 Problem cluster ... 23
Chapter 4. Current situation at MST ... 25
4.1 Patient flow process ... 25
4.2 Available OR time per specialty ... 25
4.3 Scheduling elective patients ... 26
4.4 Handling emergency patients ... 27
4.5 Variability at nursing wards ... 29
4.6 Utilization of the operating rooms ... 31
4.7 Conclusion ... 31
Chapter 5. Intervention model ... 33
5.1 Quadratic assignment problem model (QAP) ... 33
5.2 Constructing patient groups for the QAP model ... 35
5.3 Limitations of the QAP model ... 38
5.4 Experiment design ... 40
Chapter 6. Results: new situation ... 41
6.1 Result of Experiment 1: rescheduling... 41
6.2 Result of Experiment 2: rescheduling with additional OR time ... 43
6.3 Sensitivity analysis ... 45
6.4 What-if analysis ... 46
10
7.1 Conclusions ... 49
7.2 Recommendations ... 50
Chapter 8. Implementation ... 53
Bibliography ... 57
Appendix I Search strategy ... 59
Appendix II Example OR division ... 60
Appendix III OR usage per specialty ... 61
Appendix IV Group allocation and average surgery duration ... 62
Appendix V Number of surgeries per patient group per MSS block ... 63
Appendix VI Length of stay probabilities (days) ... 66
Appendix VII Length of stay before surgery ... 70
11
List of abbreviations
Abbreviation Definition Explanation
ENT-surgery Ear, nose, throat surgery. Specialty that takes care of the treatment of diseases of the throat, nose and ears.
FOCUS-PDCA Find, organise, clarify, understand and select – Plan, do, check, act.
Continuous improvement model used as research methodology during this research.
IC Intensive care. Ward for patients that need extra
monitoring and care.
LoS Length of stay. Number of days a patient stays at the
hospital after surgery.
MSS Master surgical schedule. A cyclic timetable where every OR session is assigned to one of the specialties.
MST Medisch spectrum Twente. Top-clinical hospital in Twente where this research is performed.
OR Operating room. A room in a hospital that is equipped to
perform surgery.
PACU Post Anesthesia care unit. Special ward for patients who need extra
monitoring after anesthesia.
POS Post-operative screening. Screening to do a final check on the patient before surgery.
QAP Quadratic assignment problem. Model designed by Glerum (2014) to
minimize the variability of the bed utilization at the nursing wards.
RvE Resultaat verantwoordelijke eenheid.
13
Chapter 1. Introduction
This chapter gives a brief context description (1.1), which includes the research motivation. Furthermore, the problem description (1.2) and research objective (1.3) will be introduced. Next, the research questions (1.4) and research methodology (1.5) will be discussed.
1.1 Context description
Medisch Spectrum Twente (MST) is a top-clinical hospital in the city centre of Enschede. The core task of the MST is to advance the health and well-being of the inhabitants of Twente. They do not focus on certain specialties or diseases but aim to deliver a wide spectrum of quality care, to make sure the inhabitants of Twente do not have to leave the region to receive the care they need. However, the catchment area of the hospital rises far beyond Twente, even up to Germany. The MST also collaborates with German hospitals, for example in transporting and treating emergency patients in the border area.
The hospital originated from a merger between two hospitals in 1990. The final step of the merger comprised the construction of a new building, where both hospitals could join together to improve the efficiency and reduce the number of duplicate facilities and logistic services (Breedijk, Buitelaar, Abels, & Prechtl, 2016). On June 11 2016, the new building of the MST hospital was officially opened. It is designed to improve quality of care and service to the patients. The MST aims to deliver good quality of care using the best and newest medical equipment. Additionally, the MST wants to make care more personal. This is done by designing building full of privacy and comfort for the patient, where he can rehabilitate in a relaxing and pleasant environment. During hospitalization, patients stay in one of the 670 single rooms with their own bathroom facilities to offer the best recovery possibilities. Single rooms offer the patients more privacy and make visiting hours superfluous, which also improves the recovery of the patient (MST, 2017).
While the new building created a lot more possibilities, it also caused financial difficulties for the hospital in an environment where healthcare costs are constantly rising. Therefore, the MST started an efficiency program. The goal of this program is to keep delivering the quality of care they already give (or even better), while reducing costs. This is done by increasing the efficiency of the primary process and making more efficient use of the current MST capacity. The program is based on four main points: patient oriented & patient satisfaction, costs, quality, and durability. The patient comes first and needs to be satisfied in his need of care, while keeping in mind the balance between quality, costs and durability. Moreover, the hospital aims to treat the patient ‘first time right’. During the efficiency program every step of the entire chain of care, from admission to discharge, should be analysed and improved. When every step is analysed and aligned to the previous and next steps in the chain, this will have a positive effect on the comfort and satisfaction of the patient and personnel, while reducing costs at the same time.
In the new building 15 operating rooms (ORs) are built, where annually more than 16.000 patients undergo surgery. One OR is still under construction, so not in use at the moment. 10 ORs are general ORs used by several specialties, and one OR is a hybrid operating room with more advance equipment. Finally, three ORs are thorax ORs, which are not in the scope of this research. Moreover, on a regular basis, one or two ORs in the old building are still in use, mainly to treat day care patients. However, in the future these patients will be treated in the new building as well.
14
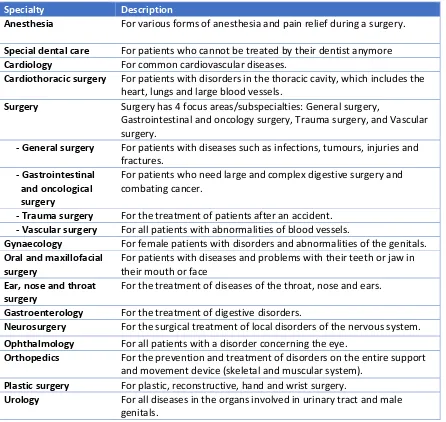
[image:14.595.73.519.127.549.2]a specialty itself, but it is divided into 4 subspecialties: general surgery, gastrointestinal and oncological surgery, trauma surgery, and vascular surgery (MST, 2017).
Table 2. Surgical (sub)specialties of the MST.
Specialty Description
Anesthesia For various forms of anesthesia and pain relief during a surgery.
Special dental care For patients who cannot be treated by their dentist anymore
Cardiology For common cardiovascular diseases.
Cardiothoracic surgery For patients with disorders in the thoracic cavity, which includes the heart, lungs and large blood vessels.
Surgery Surgery has 4 focus areas/subspecialties: General surgery,
Gastrointestinal and oncology surgery, Trauma surgery, and Vascular surgery.
- General surgery For patients with diseases such as infections, tumours, injuries and fractures.
- Gastrointestinal and oncological surgery
For patients who need large and complex digestive surgery and combating cancer.
- Trauma surgery For the treatment of patients after an accident.
- Vascular surgery For all patients with abnormalities of blood vessels.
Gynaecology For female patients with disorders and abnormalities of the genitals.
Oral and maxillofacial surgery
For patients with diseases and problems with their teeth or jaw in their mouth or face
Ear, nose and throat surgery
For the treatment of diseases of the throat, nose and ears.
Gastroenterology For the treatment of digestive disorders.
Neurosurgery For the surgical treatment of local disorders of the nervous system.
Ophthalmology For all patients with a disorder concerning the eye.
Orthopedics For the prevention and treatment of disorders on the entire support and movement device (skeletal and muscular system).
Plastic surgery For plastic, reconstructive, hand and wrist surgery.
Urology For all diseases in the organs involved in urinary tract and male genitals.
15
1.2 Problem description
[image:15.595.78.516.239.461.2]The current structure of the hospital enables every department or specialty (which is called an RvE = resultaat verantwoordelijke eenheid) to set and reach their own goals. The hierarchical framework in Figure 2 shows the different levels of planning and control for the RvEs. On every level of this hierarchical framework (strategic, tactical, offline operational, and online operational) every RvE can make his own decisions and align them in their own (vertical) process. (Hans, Van Houdenhoven, & Hulshof, 2012). However, the patient does not follow this vertical process, but flows through the horizontal path on the online operational level of different departments (Figure 2). Since MST claims to be a patient centered hospital, the process should also be organised around the patients flow and not around the RvEs. Figure 2 shows the vertical processes of the RvEs and the horizontal process of the patients flow.
Figure 2. A framework for healthcare planning and control Hans, E. W., Van Houdenhoven, M., & Hulshof, P. J. (2012).
Since the OR department is the core of the surgical path (Agnetis, Coppi, M, & Sbrilli, 2013), we will focus on the alignment between the OR department and the nursing wards on the tacital level of the framework in Figure 2. Improving this alignment will also affect the flow on the online operation level that is followed by the patients. After improving the alignment between the OR department and the nursing wards, subsequently the alignment between the OR department and the consults on the outpatient clinics can be improved.
1.3 Research objective
16
1.4 Research questions
In order to create a less variable and more predictable patient flow from the OR department to the several nursing wards, we defined one main research question with accompanying sub questions which are stated below.
The main question of this research is:
“How can the MST hospital reduce the variability in bed utilization at the nursing wards, while the OR capacity will be used in an efficient way?”
In order to give structure to the report and finally answer the main question, the following sub questions are formulated.
1. Which model is suitable to apply to the MST context in order to schedule patient types resulting a minimized bed utilization variability?
2. How to cluster patients for the model?
2a. What is the surgery duration for every patient group?
2b. What is the length of stay (and corresponding probabilities) for every patient group? 2c. What is the probability of every patient(group) to go to a certain ward after surgery? As said, the MST hospital has one OR that is under construction. The hospital wants to know if creating additional OR time would improve the results. Therefore, we add an additional research question: 3. What will be the effect of additional available OR time?
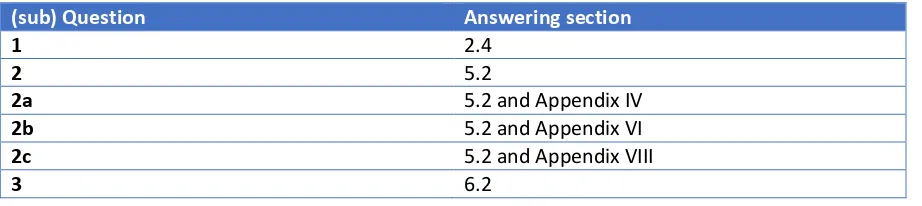
Table 3 shows for every sub question the section where the question will be answered. The main question will be answered in chapters 6 and 7.
Table 3. (sub) Questions with corresponding answering sections.
(sub) Question Answering section
1 2.4
2 5.2
2a 5.2 and Appendix IV
2b 5.2 and Appendix VI
2c 5.2 and Appendix VIII
[image:16.595.71.532.479.582.2]17
1.5 Research methodology: FOCUS-PDCA
During (and after) this project we will make use of the FOCUS-PDCA model. This is a well-known continuous improvement model.
FOCUS is an acronym for find, organise, clarify, understand and select. The first step is to find an opportunity to improve. Next you organise an effort (including assigning a team) to improve the process and clarify the issue with the understanding of how the process works. Finally, you have to
understand the sources of variability and select the process and strategy to improve.
When the team identifies the right process to improve, the first PDCA cycle can start to improve the process. PDCA stands for plan, do, check, act. During the PDCA cycle you start to plan what you (as a team) want to achieve and how you are going to do this. Subsequently, you do what you actually planned and check if it is executed according to the plan you have made. The last stage of the first cycle is to act on the results, and how these results can be improved the next time. The plan for the new improvement will be made in the next PDCA cycle. PDCA is a continuous improvement model, which means you do not stop improving after one cycle, but you start a new cycle and keep improving (Ransom, Maulik, & Nash, 2005) (Bader, Palmer, Stalcup, & Shaver, 2017).
19
Chapter 2. Literature review
The following chapter discusses the relevant literature per research topic. Every subject of interest will be discussed briefly based on found literature using Google Scholar and Scopus. The search strategy can be found in Appendix I. The subjects of interest are: definition(s) of a master surgical schedule (2.1), types of MSS scheduling (2.2), types of variability (2.3), and operating room planning models (2.4).
2.1 Definition(s) of a master surgical schedule (MSS)
Several definitions of the master surgical schedule can be found in scientific literature. Three of them will be discussed below to show the difference in usage and detail.
“MSS executes a master schedule of surgery types, which contains slots for surgery types that recur at least once every cycle (of, say, 4 weeks).” (Oostrum, Bredenhoff, & Hans, 2009)
“Master surgical schedule is a cyclic timetable that determines the ward associated with each OR session and must be updated whenever the total amount of OR time changes.” (Tànfani & Testi, 2009) “The master surgical schedule defines the number and types of procedures that will be performed by a hospital over the medium term, the MSS defines aggregate resource requirements, such as the demand for nurses, drugs, diagnostic procedures, laboratory tests, and perioperative nurses.” (Blake & Donald, 2002)
The three definitions stated above show that not all papers refer to the same definition when they talk about a master surgical schedule. In this paper we will define an MSS as ‘A cyclic timetable where every OR session is assigned to one of the specialties.’ An OR session is the available time in one OR on one day. Filling in this MSS on a more detailed level can be done by assigning these OR session to patient types of the allocated specialty. Multiple patient types can be assigned to one OR session, as long as these patient types belong to the same specialty.
Preferably, every cycle of a timetable looks like the previous cycle in order to improve the alignment and repeatability between other activities in the chain of care. However, it does not necessarily have to be an exact copy of the previous cycle.
2.2 Types of MSS scheduling
In scientific literature, two master surgery planning methods are known: block scheduling and open scheduling. With a block schedule, every OR session will be dedicated to one specialty. This specialty needs to perform its surgeries in the given OR time. Open scheduling means there is one central planning that accounts for the total planning of all specialties (Carter & Ketabi, 2012). The MST makes use of block scheduling. This is preferable since every specialty has to deal with many restrictions, needs and preferences. It would be a lot more complex to take this all in account when using an open scheduling method.
20
cancellations and emergency patients during an operation day (Vanberkel P. T., et al., 2009) (Beliën & Demeulemeester, 2007) (Hans, Van Houdenhoven, & Hulshof, 2012).
Based on historical data and availability of personnel, the various OR sessions are dedicated to the various specialties. During one OR session, one specialty is assigned to perform surgery. It is not desirable to assign more specialties (or surgeons) to one OR session. Since the surgery duration might take longer than expected, and delays will occur. When an OR session is delayed, this might affect the schedules in other ORs as well as the other activities the surgeon has to perform before or after his surgeries. By assigning one team of surgeons one OR per day, this domino effect can be lessened. Any delays can only affect the continuation of their own schedule.
Even though a clear multiple stage process in described in scientific literature, we want to add one more stage between the current second and third phase. This step is needed to align the OR schedule with the next step in the total chain of care, the nursing wards. When every OR session is dedicated to a certain specialty, we aim to make a schedule in this OR session of patient types. These are not the actual patients that will undergo surgery (with a name and number), however in every OR session we will determine how many and what kind of patients should preferably be treated in order to create a constant predictable flow to the nursing wards. Naturally, it might not always be possible to follow this blueprint completely. For example, more emergency patients might arrive than expected, surgeries might take longer than expected, or more/other patients might arrive than expected. Therefore, this blueprint should be used as a guideline when patients are scheduled but it is not fixed.
2.3 Types of variability
In scientific literature, two types of variability can be distinguished, namely natural and artificial variability. Natural variability (in this context) can be divided into three different types: clinical presentation, patient flow and professional expertise. These types of variability occur due to the typical uncertainties a hospital has to deal with. Clinical representation of natural variability is the uncertainty of the condition of the patient. The disease and severity of the patient are not known when a patient enters the hospital, this applies in particular for emergency patients. Also, the arrival interval of the patients is unknown, which is defined as the uncertainty of patient flow. In general, the approximate amount and types of patients are known but the exact arrival of these patients is hard to predict. Moreover, the professional expertise is an uncertain factor, since not every staff member is capable and/or educated to provide quality care to all types of patients (Litvak, 2005).
Artificial variability is a non-random and non-predictable kind of variability. This is driven by individual priorities. An example is the number of patients scheduled for admission, which varies every day. In most cases this results in a peak of bed occupancy before the weekend (Mac Knight & Gorke, 2014) (Litvak, 2005).
21
2.4 Operating room planning models
In the literature, various models are known and can be used to construct an OR planning. However, not all models fit the MST context. Some of them will be discussed below.
Several models describe how an MSS can be constructed during the second phase of the multiple stage process mentioned in section 2.2. One of those models is the model of Carter (2012) who uses a mathematical program to generate an OR schedule in a way that the limited operating room capacity can be distributed based on smoothing expected demand for in-patient beds. For every surgeon, the model calculates the number of OR sessions he needs to perform and randomly generates the number of patients. Subsequently, the surgeons are allocated to as many OR sessions as calculated while the weighted sum of maximum bed requirements is minimized during the week.
Another model found in the literature is the model of Beliën (2007), that can be used to construct a new MSS. The model identifies seven factors that might have an impact on the complexity of the problem: the number of time blocks per day, the number of surgeons, the division of requested blocks per surgeon, the number of operated patients per surgeon, the probability of a no show, the length of stay distribution, and the bed capacity. Using these factors, the model designs an MSS taking into account the minimization of variability in bed utilization.
Both models might be converted to the MST context in order to reduce the variability in bed utilization. However, it is not preferable to reassign the OR sessions, since this requires many adjustments in the total chain of care. When a certain specialty or surgeon has to perform surgery on a different day than usual, this will also affect other steps of the horizontal process such as the outpatient clinic and their planning. Moreover, when calculating patient characteristics per surgeon, the whole model needs to be recalculated when a surgeon leaves the hospital or when a new surgeon enters, while no data of the new surgeon is available yet. Also, the different patients of one surgeon are grouped and scheduled as one type of patients, while the characteristics of the patients within this group may vary substantially.
The next model found in the literature is the model described by Agnetis (2013). This can be used to fill in the weekly MSS, based on a certain waiting list with patients per specialty. Moreover, it takes into account the ‘intensity of care’. Every intensity of care corresponds to a different bedroom type and OR sessions. It uses different priority classes and OR session types to schedule patients into the current MSS while the objective is to minimize the standard deviation of the average bed utilization. This objective function is also relevant for the MST context. However, it is quite hard to retrieve the required data. Mainly the intensity of care of a patient type is hard to measure, since it depends not only on the type of surgery, but also on the condition of the patient and skills of the nursing staff. Moreover, the model uses a very detailed bed allocation where patients from the same gender cannot stay in the same room. The model schedules according to a first come first serve principle that might not be optimal to reduce the variability in bed utilization. This model differs too much from the MST context and is therefore not appropriate to use in this research.
22
Also Vanberkel (2009) designed a model that can be used. This model gives the distribution for the number of patients on each day of the MSS, while taking into account the ward occupancies, admissions and discharges and the number of patients in a specific day of recovery to determine the workload on a hospital department. The model is tested at the Netherlands Cancer Institute-Antoni van Leeuwenhoek Hospital. They used the model to reduce the fluctuations at the nursing wards. The models of Glerum (2014) and Vanberkel (2009) are in line with the aims of this research within the MST hospital. However, we will use the model of Glerum (2014), since this model can be applied more quickly in the MST context. We can use the model in the current block scheduling method of the MST to reduce the artificial variability at the nursing wards.
23
Chapter 3. Problem analysis
This chapter defines the core problem of this research by demonstrating the relations between different problems in a problem cluster (3.1).
3.1 Problem cluster
The OR schedule is filled according to a ‘first come first serve’ principle. The first patient on the waiting list (longest waiting patient) will be scheduled first, as soon as the corresponding specialty has OR time available. The goal here is to use as much available OR time as possible. Since the OR department is the most expensive resource, it is important to maximize the OR utilization. However, the number of daily and weekly OR sessions per specialty do not change a lot, because the way the specialties fill in these sessions changes continuously and the OR schedule does not take into account the lengths of stay of the patient types, the variability in bed utilization is high. This is encountered by the nurses by a strongly fluctuating bed utilization on their wards.
By conducting interviews with personnel members of the MST hospital, it has been found that the planning department and the nursing wards encounter most of the problems as a result of the current scheduling method. The planning department has to find a suitable bed for every patient after their surgery. On a regular basis, the preferred department does not have a free bed for the patient, so the planning department needs to find an available bed at another unintended ward. This can happen due to various reasons: emergency patients might occupy a bed that was intended for another patient, the length of stay of an (elective) patient might be longer than expected, patients from other wards occupy a bed since their ward was already full, etcetera. When a patient is placed on a ward that is not necessarily specialized in the required type of care, it is possible the patient receives a lower quality of care. In the worst-case scenario, the hospital even has to cancel a surgery since they do not have any beds available at a nursing ward that suffices.
This erroneous placement of patients also has a direct effect on the nursing departments. Partly because of these incorrect placed patients, but mainly because of the changing unpredictable inflow of patients to the departments the workload is fluctuating every day. When the timetable for staff members is made, it is not known how many and what type of patients will (probably) enter the wards. Consequently, it is not possible to adjust the personnel planning to the number of patients. However, the workload at a nursing department is not only defined by the number of patients present at the ward. The intensity of needed care is also an important factor of the workload. However, the intensity of care can hardly be measured and is therefore out of the scope of this research.
Since staff members have to deal with an unexpected amount of patients arriving at the wards, they might not always be able to deliver the quality of care they would and should deliver. When a patient is placed at an undesired ward he or she will be transferred to the desired ward as soon as possible. This creates an unnecessary displacement of the patient, with associated additional administrative burden. All these changes and uncertainties lead to unsatisfied personnel and patients, as the personnel members mentioned during the interviews.
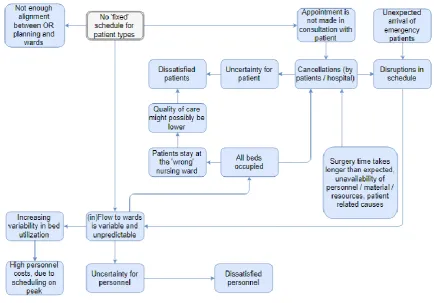
24 Figure 3. Problem cluster.
Figure 3 shows that the core problem of this research is defined as the absence of a ‘fixed’ schedule for patient types. The variability of the number of patients at the nursing wards should be as low as possible, but perhaps just as important is to know what type and number of patients will enter the ward for the coming days. If the predictability is higher and a forecast of the number of patients present at the ward can be made, the scheduling of personnel members can be done more adequately. This will increase the satisfaction of the personnel members as they will encounter less fluctuations in their workload. Moreover, the patient satisfaction will increase since better quality of care can be delivered as there are sufficient personnel members and the probability to stay at an undesired nursing ward will decrease.
25
Chapter 4. Current situation at MST
This chapter will discuss the current situation at the MST. First, the process of patient flow will be shown (4.1). Next, the current way of scheduling elective patients will be discussed (4.2 and 4.3), and how the MST deals with emergency patients (4.4). Finally, the effect of the current scheduling method on the variability at the nursing wards (4.5) and the OR utilization (4.6) will be demonstrated.
4.1 Patient flow process
When an elective patient enters the hospital he visits the outpatient clinic where he has an appointment with a certain physician. This physician decides whether the patient needs surgery or not. When the patient needs surgery, he has to visit the pre-operative screening (POS). The POS usually consist of multiple appointments with for example the anesthetist, nurse, and dietician to gather and give all information needed for surgery and explain the surgery procedure to the patient. Moreover, the anesthetist will discuss and explain the anesthesia used during the surgery and will perform a final check on the health conditions of the patient. When all conditions are met, the patient can be scheduled for surgery. After surgery the patient will (shortly) go to the recovery, or when additional care and monitoring is needed, to the PACU (Post Anesthesia Care Unit) or intensive care (IC) unit. When the patient’s condition has stabilized, the patient will rehabilitate at the nursing ward of the corresponding specialty. In most cases, an emergency patient enters the operating room, intensive care or nursing ward immediately, for acute treatment.
This research will consider both patient flows (emergency and elective). However, we will only consider patients treated during office hours, since these patients are scheduled or added to the schedule in the MSS. The remainder of the emergency patients is treated by the night and weekend shifts. The scope of this research is indicated with a grey rectangle in Figure 4.
4.2 Available OR time per specialty
Based on historical data and agreements with the health care insurers, the expected number of patients is determined. The arrangements of 2017 are loosely based on the type and number of patients treated in 2016. Combining these numbers and their (historical) surgery duration, the current MSS schedule is constructed. Most of the time, every OR session is dedicated to one specialty. It is not preferable to assign one session to multiple specialties, since this may cause delays (at multiple ORs) when one surgery takes longer than expected. An example of the OR division can be found in Appendix I, which shows that not all OR sessions are dedicated to a specialty, due to personnel restrictions, not every OR session can be used every day.
26
[image:26.595.72.313.203.523.2]Additionally, not every OR is equipped with the same facilities. Therefore, it is important for every specialty to know, in which OR(s) their surgeries can be performed. Due to movable equipment, the flexibility of specialties to perform surgery in several ORs is relatively high. As a result, every specialty can perform at least some of their surgeries in any available OR. However some surgery types require more advanced equipment, which is not available in every OR. Therefore, Table 4 shows an overview of these preferable ORs that are suitable for more specialized care. This should be taken into account when patient types are being scheduled.
Table 4. Preferable ORs per specialty.
Specialty Preferable OR(s)
Anesthesia All
Special dental care 1,4
Cardiology 12
Cardiothoracic surgery 13, 14, 15
Surgery
- General surgery All
- Gastrointestinal and oncological surgery
5
- Trauma surgery 7
- Vascular surgery 12
Gynaecology 10
Oral and maxillofacial surgery
4
Ear, nose and throat surgery
1
Gastroenterology 1, 9
Neurosurgery 2, 4
Ophthalmology 5
Orthopedics 9, 11
Plastic surgery 11
Urology 6
4.3 Scheduling elective patients
27
Figure 5. A framework for healthcare planning and control Hans, E. W., Van Houdenhoven, M., & Hulshof, P. J. (2012).
Every specialty or group of specialties has its own planner, who schedules according to a ‘first come first serve’ principle. The longest waiting patient will be scheduled first, as soon as there is available OR capacity for the corresponding specialty. The aim of the planners is to use the available 480 minutes per OR session as efficiently as possible. If the OR planner is not able to fill in the program efficiently enough (>75%), the hospital has the right to cancel this entire OR session (Schopman, van Houte, & Kampshoff, 2015). Moreover, the OR planner has to deal with a significant number of restrictions and rules. Resources are limited, so it is not possible to schedule more surgeries of one type at the same time (in different ORs) when resources are not available. Limited resources are for example surgery tools (X-ray equipment, supplies) and staff members. Furthermore, not every OR is suitable for every type of surgery, so this is taken in to account when designing the offline operational schedule. Since the OR department is the most expensive resource, it is quite logical to aim for a high utilization. However, while aiming for a high OR utilization, there is limited connection between the OR schedule and the nursing wards. As an effect, patients might end up staying at an undesired nursing ward, since there is no available bed at the preferable nursing ward. This is the case since the planners do not have insight into, or make use of the length of stay of the patients, and therefore do not know beforehand how many beds are still free to schedule for other patients. Moreover, they have little insight in the scheduling of the other specialty (groups), even though they have to share the same resources.
4.4 Handling emergency patients
[image:27.595.75.526.71.303.2]Aside from the elective patients, MST categorizes three types of emergency patients. Table 5 gives an overview of the three groups. It also shows the time this patients should be treated in after arrival at the hospital.
Table 5. Emergency patient groups.
Group Should be treated within
1 30 minutes
2 Five hours
28
[image:28.595.70.510.307.522.2]Every day, one OR is dedicated as emergency OR. This OR is used to schedule the <24 hours emergency patients. Moreover, this OR is used for emergency patients arriving during the day. When an emergency patient arrives and is categorized as <30 minutes, this patient will be treated in the first available OR, which might be the emergency OR but also one of the dedicated ORs, and other patients are cancelled and/or delayed as and when required. The time of treatment for emergency patients that need surgery < 5 hours after arrival depends on the urgency and type of surgery they require. When an OR session is finished in time, this OR can be used to perform surgery. However, it might also be possible that elective patients need to be cancelled or delayed in order to perform surgery on time. For every type of (emergency) patient the right surgical team should be present.
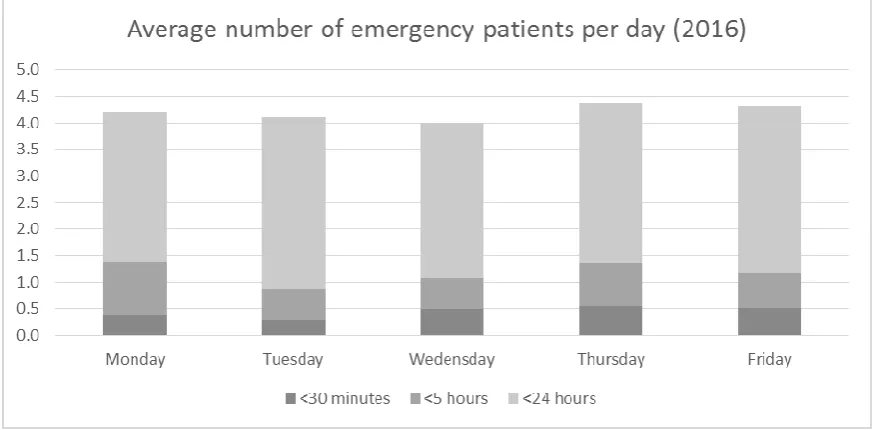
Figure 6 shows the number of emergency patients treated per day. Note: this is the average number of emergency patients treated during office hours. This is relevant to note since these are the patients that were not taken into account when the original schedule was made, but are still treated during office hours. However, it is not known if these patients really disrupted the schedule, or if they were treated since there was free time available during or after an OR session. It can be seen that the number of emergency patients is very similar throughout all days of the week.
Figure 6. Average number of emergency patients per day (2016). (n=739, T=365 days, source: MST data 2016)
When constructing a schedule with patient groups, these three types of emergency patients as well as their characteristics should also be taken into account. In the current situation, one OR is used to treat emergency patients. Table 6 shows the characteristics of emergency patients. Based on the average surgery duration, it seems reasonable to use the capacity of one OR as emergency OR.
Table 6. Emergency patients characteristics.
Average surgery duration (minutes) Average cases during office hours
<30 minutes 86 0,5
<5 hours 93 0,7
<24 hours 77 3,1
29
specialties rarely have to perform surgery on emergency patients. So, when OR time is reserved for emergency patients, this should mainly be done in the OR sessions of general surgery and gynaecology. Table 7. Emergency patients per specialty.
Specialty % of the emergency patients during office hours
General surgery 66%
Gynaecology 13%
Neurosurgery 4,7%
Orthopedics 4,7%
Cardiothoracic surgery 4,1%
Plastic surgery 2,6%
Urology 1,9%
Remaining specialties <1% each
Since emergency patient flow to various wards, we cannot take them into account using the model. But, we do know the reserved OR time for emergency patients seems quite reasonable, based on their average surgery duration. The way the MST hospital reserves OR time for emergency patients is out of the scope of this research, however we recommend this as a subject for further research.
4.5 Variability at nursing wards
The current way of scheduling creates too much variability in bed utilization at the nursing wards according to the staff members at the nursing wards. This is the consequence of the limited connection between the OR planning and the nursing ward. When patients are scheduled for surgery, the planner does not know how long the patient will stay at which nursing ward and which patients are already at that particular nursing ward. Therefore, the number of patients present at the wards on a given day cannot be foreseen until that day. This results in high peaks and lows in the number of patients at the wards, which is not desirable for the patients nor the nursing staff.
To show the effect of the current way of scheduling, the number of patients at one of the nursing wards during a random period of four weeks is shown in Figure 7. The figure shows the highs and lows at the nursing ward. The average number of patients present at this ward fluctuates between 14 and 33. Since this effect is not known beforehand, it cannot be taken into account when
30
Figure 7. Example of number of patients at nursing ward in one period of four weeks. (n=28, T=28 days, source: MST data)
For the same nursing ward, Figure 8 shows a boxplot for every day of the week. Clearly, the number of patients at Ward A is significantly lower than on the other days. Mainly on Tuesday and during the weekend, the spread is relatively high.
[image:30.595.79.489.439.680.2]31
4.6 Utilization of the operating rooms
MST uses ‘Business Objects’ to display data from the database in several reports. For every specialty, it can show the number of OR sessions every specialty used and the utilization of these sessions. 2 types of utilization can be distinguished: OR usage without setup time and OR usage with setup time. Setup time is defined as the time required between two surgeries to clean up and prepare the OR for the next surgery with all material and equipment needed. The average OR utilization without setup times equals 73% in 2016. The OR utilization including setup times equals 87%, where one OR session equals 480 minutes. However, for a restricted number of OR sessions it is allowed to exceed the 480 minutes limit since an additional team is present at the end of the day. Because of this, it is possible to realise an OR utilization of more than 100%.
Appendix II shows the OR usage per specialty with and without setup times. These numbers are used to determine the average setup time of an OR session of a certain specialty. This should be taken into account when designing a schedule. We have to use averages to calculate the setup time per specialty. It would be ideal to calculate the setup time more precisely (for example, per surgery type) but this is not possible since the setup time depends on many different factors, such as the type of surgery, or the next type of surgery, amongst other factors. If two similar surgeries are scheduled in a row, the setup time will be lower since equipment is already at the OR and only limited changes are needed. Moreover, the location of the OR can influence the setup time. A surgery can only start when all staff members are present at the OR. When an OR is located ‘far’ from the recovery, it takes a while before the anesthesia worker is back at the OR after he transported the previous patient, so setup time increases.
4.7 Conclusion
In the current situation elective patients are scheduled according to a ‘first come first serve’ principle. The longest waiting patient is scheduled as soon as possible when there is available OR time of the corresponding specialty. Three types of emergency patients can be distinguished. These patients enter the system unexpectedly and are scheduled in the first available OR, when the right surgeon team is present. To make sure the waiting time of emergency patients is not too long, one OR is kept free to treat (at least) the first arriving emergency patient.
33
Chapter 5. Intervention model
This chapter will discuss the model that will be used to minimize the variability in bed utilization (5.1). Next, we shows how patient groups are constructed and their characteristics are calculated (5.2). These patient groups are used as input for the optimization model. We will also show the limitation of the model (5.3), and describe the experiments we will perform (5.4).
5.1 Quadratic assignment problem model (QAP)
This section will answer research question 1: ‘Which model is suitable to apply to the MST context in order to schedule patient types resulting a minimized bed utilization variability?’.
As discussed in Chapter 2, several models are known to construct the MSS, with or without a connection between the workload at the nursing ward(s). The QAP model of Glerum (2014) seems to be the most suitable model. This model is most appropriate to take into account the relation between the MSS and the bed utilization at nursing wards in the MST context.
The quadratic assignment problem (QAP) model is designed to construct a patient mix, using a given MSS, aiming to minimize the variability of the bed utilization at the wards. For every OR and every day, a patient mix will be constructed. This patient mix shows how many patients of which type should be scheduled per day per OR (Glerum, 2014). The original model was not ready to use for the MST context, therefore we made some adjustments. We do not consider a priority factor for a certain bed type, and we do not have multiple objectives with corresponding weights. Also, we do not use a fixed setup time per surgery, but decrease the OR session time with the average setup time per OR session of a certain specialty. Moreover, we added an extra entity G which is used in an additional constraint to take into account the length of stay before the date of surgery (some patients are hospitalized one day before their date of surgery and thus already occupy a bed).
The input of the model consists of entities and parameters. Table 8 shows an overview of the entities, the parameters can be found in Table 9 (Glerum, 2014).
Table 8. Input entities.
Entities Set Index MST
Cycle horizon T t 28 days
Operating rooms J j 13 ORs
Bed types B b 10 nursing wards
Patient types I i 118
Set of ORs j and days t where specialty i can perform surgery Ai j,t
Patient types that are hospitalized one day before their date of surgery G g 5, 30, 32, 33, 37…
34
Table 9. Input parameters.
Parameters Parameters Notation
Expected surgery duration in minutes needed by patient type i ei∈ℤ+
Capacity of OR j on day t in minutes oj,t ∈ℤ+
Number of patients type i si∈ℤ+
Probability of patient type i being in bed type b after t days pb,I,t ∈ℝ, 0 ≤ 𝑝𝑏,𝑖,𝑡≤ 1 Maximum number of nights required in bed b by case type i lb,I ∈ℤ+
Using historical data, the expected surgery duration in minutes (e) is given for every patient group. The daily capacity of an OR session equals 480 minutes (o) minus the average setup time of that specialty as discussed in section 4.6. For every cycle, we know how many patients of every group (i) should be treated. For every patient type, we know the probabilities of staying at a certain ward after surgery (p), which also denotes the maximum number of nights per patient type (l). Moreover we also take into account the length of stay before date of surgery (g). The objective function of the model depends on the decision variable stated below in Table 10 and auxiliary variables in Table 11. Table 10. Decision variable V.
Decision variable Notation
Number of patients of type i scheduled in OR j on day t Vi,j,t
Table 11. Auxiliary variables.
Auxiliary variables Notation
Maximum demand for bed type b Zb
Average utilization of bed type b on day t ZZb,t
Utilization of OR j on day t UUj,t
Average bed utilization of bed type b over the cycle horizon AVb
Decision variable V will show how many and what type of patients should be scheduled in which OR on which day. This results in a maximum demand for a certain bed type (Z). Moreover, the utilization of a bed type (ZZ) and the utilization of an OR (UU) are calculated. Finally, the average bed utilization per bed type is shown (AV).
The objective function of the QAP model is to minimize the deviation of the average bed utilization:
min∑ ∑ (𝑍𝑍𝑏,𝑡− 𝐴𝑉𝑏)
2 𝑡∈𝑇
𝑏∈B
𝑇 ∗ 𝐵
With this objective Glerum (2014) made some constraints of which a modified version is stated below. Constraint (1) makes sure every patient will be scheduled in an OR when the right specialty is dedicated to that OR. Constraint (2) makes sure ZZb,t reflects the bed utilization of bed type b on day t. Note: the
length of stay of patients before and after their date of surgery is also incorporated. Constraint (3) sets Zb as the peak of bed demand for bed type b over the planning horizon. Constraint (4) determines the
OR capacity needed by all patient types scheduled on that day and OR. Constraint (5) makes sure the scheduled capacity does not exceed the available capacity of an OR. Constraint (6) sets AVb to the
35
∑𝑡∈𝑇∑𝑗∈𝐽𝐴𝑡,𝑗,𝑖∗ 𝑉𝑖,𝑗,𝑡= 𝑠𝑖 ∀𝑖 ∈ 𝐼 (1)
∑ ∑ ∑ 𝑝𝑏,𝑖,(𝑓−1)∗ 𝑉𝑖,𝑗,(𝑡−𝑓+1)°+ ∑𝑗∈𝐽∑𝑔∈𝐺𝑝𝑏,𝑔,1∗ 𝑉𝑔,𝑗,(𝑡+1)°= 𝑍𝑍𝑏,𝑡 𝑖𝑏,𝑖
𝑓=1 𝑗∈𝐽
𝑖∈𝐼
∀𝑏 ∈ 𝐵, 𝑡 ∈ 𝑇 (2)
𝑍𝑍𝑏,𝑡 ≤ 𝑍𝑏 ∀𝑏 ∈ 𝐵, 𝑡 ∈ 𝑇 (3)
∑𝑖∈𝐼 𝑒𝑖∗ 𝑉𝑖,𝑗,𝑡 = 𝑈𝑈𝑗,𝑡 ∀𝑗 ∈ 𝐽, 𝑡 ∈ 𝑇 (4)
𝑈𝑈𝑗,𝑡≤ 𝑜𝑗,𝑡 ∀𝑗 ∈ 𝐽, 𝑡 ∈ 𝑇 (5) 1
𝑇∑𝑡∈𝑇𝑍𝑍𝑏,𝑡= 𝐴𝑉𝑏 ∀𝑏 ∈ 𝐵 (6)
° = should be read as the modulo to incorporate patients still in a bed from the previous cycle. The model is built in, and solved by IBM ILOG CPLEX Optimization Studio Version: 12.6.3.0.
5.2 Constructing patient groups for the QAP model
Before we can apply the QAP model as discussed in the previous section, we need to construct patient groups, to answer research question 2: ‘How to cluster patients for the model’. Moreover, the characteristics of these patient groups will be calculated in this section and shown in several appendices, to answer the following three sub questions (2a, 2b, and 2c): ‘What is the surgery duration for every patient group?’, ‘What is the length of stay (and corresponding probabilities) for every patient group?’, and ’What is the probability of every patient (group) to go to a certain ward after surgery?’. The construction of the patient groups is done according to the PDCA model. The PDCA cycle starts with a meeting with the involved team members of a certain specialty (medical specialists, planners etcetera). We aim to make a schedule that includes the number and types of patients that need to be scheduled in that particular MSS period, while the variability at the nursing wards is reduced. Therefore, we need to design several patient groups and calculate their characteristics. The medical staff is asked to make a first group classification. They decide for every type of surgery they perform, to which of the groups it belongs, according to their insight on medical and logistic characteristics. Next, we will check if the data also confirms this group classification. We check the surgery duration for all patient types within a group, as well as the length of stay. A patient does not fit in a certain group when the surgery duration and/or length of stay is not comparable with the other patient types of the group. This will probably lead to some suggestions of changing groups. This will be discussed with the medical staff of that specific specialty in the next PDCA cycle. We perform as many PDCA cycles as needed to finalize the group classification.
Based on medical and logistical characteristics, every surgery type the specialty performed in 2015 and/or 2016 is assigned to one of the patient groups. Next, we use data of 2016 to determine the following characteristics needed as input for the QAP model:
- Average surgery duration (Appendix IV)
- Number of surgeries per patient group per period (Appendix V) - Length of stay probabilities (Appendix VI) - Probabilities of staying at a certain ward (Appendix VIII) - Length of stay before date of surgery (Appendix VII)
36
Using the same data we calculate the length of stay with their probabilities. So, for every patient group we calculate the chance of being in a bed after one day after surgery, two days after surgery, etcetera. These probabilities are multiplied by the chance of this patient type going to a certain ward.
Outliers of both surgery duration and length of stay are removed from the data since the characteristics of these outliers are most likely patient related instead of surgery related. This could be the case with patients that deal with comorbidity, obesity or diabetes.
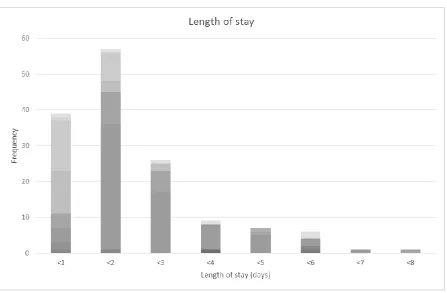
[image:36.595.69.524.205.494.2]An example of surgery duration and length of stay for one patient group is shown in Figure 9 and Figure 10.
37
Figure 10. Length of stay of a gynaecology patient group. (n=146, T=365 days, source: MST data)
The two figures (Figure 9 and Figure 10) show the characteristics of a patient group from gynaecology. Every colour represents a type of surgery allocated to this group. Outliers are removed and it can be seen that these surgery types fit into the same group, based on their surgery duration and length of stay. When a surgery type does not seem to fit in the allocated group, we try to allocate this surgery to another group (with similar logistic and medical characteristics) where the length of stay and surgery duration fits to the group better. Similarly, this is done for all 118 patient groups.
However, not only the length of stay is relevant information for the new scheduling model. We should also take into account, for every patient group, where this length of stay is spent. Again we use data of 2016 to determine to which wards the patients went after a certain surgery. For example, we have to deal with a limited number of Intensive Care (IC) and Post Anesthesia Care Unit (PACU) beds. But also, for every type of regular bed we want to minimize the variability at that ward. Therefore, for every patient group we determined the probabilities of going to a certain ward after surgery. An example is shown in Table 12. For every ear, nose and throat (ENT) surgery group, this table shows the probability of going to a certain ward after surgery. Note: the total of each row might add up to more than 100% since a patient may visit multiple wards after surgery.
Table 12. Probabilities per ward per patient group of ENT surgery.
ENT surgery Ward A Ward B Ward C Ward D Ward E Ward F Ward G Ward H
Group 1 47% 24% 20% 4% 4% 5% 4% 0%
Group 2 19% 74% 4% 4% 0% 0% 4% 0%
Group 3 65% 5% 20% 20% 0% 5% 0% 0%
[image:37.595.71.519.634.711.2]38
After performing one PDCA cycle, one of the team members mentioned that not all patients may arrive at the hospital on their day of surgery. Therefore, for every patient group we used data to determine if the majority of the group arrives on the day of surgery or not. Clearly we only use data of the elective patients, since emergency patients (almost) always enter the hospital on their day of surgery.
Table 13 shows the length of stay before surgery date for every patient group undergoing ENT surgery. It shows that for Group 2, most of the patients arrived zero days before surgery, so their admission happened on the same day as their surgery did. However, most of the patients in Group 1 (39) arrived one day before their date of surgery. Additional scans or treatment may cause these early admissions. For every patient group we calculate the length of stay before surgery and use this as input for the model since this will affect the bed utilization.
Table 13. Length of stay (days) before the date of surgery.
5.3 Limitations of the QAP model
The QAP model can be used to design an OR schedule while the variability on the nursing wards is minimized. Although the model is able to simulate the MST situation in a realistic way, we have to deal with some limitations of the model.
After surgery, a patient might flow to several nursing wards. It might be the case that a patient needs treatment of multiple specialties and therefore stayed at multiple wards after surgery. However, the model cannot place a patient at different wards one after the other. This is a limitation since this is not always the case in practice. When a patient stays at multiple wards, it is most of the time the case when a patient is (temporary) placed at an alternative ward since there is no available bed at the preferred ward, or due to complications the patient has to be transferred to another ward. So, in most cases, visiting more than one ward after surgery is not intended. However, when a certain ward is aware of the fact a patient will enter their ward within a short period of time, the bed will be reserved before the patient arrives. Therefore, it is possible that multiple beds are administratively occupied by one patient. These probabilities of administratively going to multiple wards at the same are included in the model, so the effect of this limitation will be small.
Before a patient enters the nursing ward (after surgery), he will first stay at the recovery, PACU or IC for a short period of time. However, this is not taken into account in the model since this is, most of the cases, a patient related factor and not necessarily surgery related. Before a patient is being scheduled, the surgeon completes a pre-operative screening (POS) form where he indicates if a patient needs a PACU or IC bed after surgery, so this can be taken into account during the offline scheduling phase. Furthermore, the bed at the nursing ward will be reserved and therefore cannot used by another patient when the ward is notified of the (future) arrival of a patient. Hence, this will barely influence the bed utilization at the nursing wards of the model.
Not every restriction from the MST context can be added to the model. We have to deal with limited resources and equipment. For example: there is a limited number of surgery tools to perform a certain surgery. So we cannot schedule multiple surgeries of one type while only one set of surgery tools is available. However, when there is enough time between two of those surgeries, the surgery tools can
ENT surgery 0 1 3 5 7 8 41 Total
Group 1 10 39 49
Group 2 18 8 26
Group 3 1 16 1 1 19
39
be sterilized in between, so an additional surgery can be performed on the same day. We do not only have to take into account the surgeries in one OR session, but also other OR sessions may affect the schedule. Multiple specialties might use the same surgery tools. Oral and maxillofacial surgery use the same tools as special dental care sometimes, but also shares recourses with gynaecology. Moreover, not every surgeon uses the same tools, so this should be manually checked in the offline operational schedule, when a surgeon is dedicated to the OR session. It is not possible to model this in the QAP model, since these restrictions depend on the combination of patients and their sequence, as well as the surgeons preferences. In addition, not every restriction is hard, and must strictly be complied. Besides that, the sequence of the OR schedule is not determined by the model. Again, many patient related factors can influence this sequence during the day. For example, children and patients with diabetes should be scheduled first. When the sequence during the OR sessions is determined, the material and equipment restrictions can be taken into account as stated above.
The model uses a cycle horizon of 28 days. To make sure we do not start with empty wards at the start of a new cycle, a restriction is made to calculate the number of patients who are still at the wards based on the end of the current cycle. However, the previous cycle might have a different OR division and a different number of patients than the current cycle, but the model uses the current cycle pattern to determine the number of patients at the start of the cycle. So, the number of patients present at the wards at the beginning of a new cycle might be somewhat different than in practice. However, the cycles do not differ to a great extend form each other. A second effect of this fixed cycle horizon is the limitation in length of stay. The 28 days cycle horizon is also the maximum number of days a patient can stay ‘in the model’. However, the number of patients with a length of stay of more than 28 days (and not being an outlier) is very small.
The patient’s length of stay is limited to a number of days. The model cannot calculate the length of stay on an hour or minutes level. As an effect, the number of beds used per day is the average number of beds used throughout that day. Moreover, mainly for the day care nursing ward the average number of patients being at the ward is significantly higher than in practice. In practice, these patients only stay at the ward for a couple of hours, while the model is only able to use a length of stay in days and discharges all patients at the end of the day.
40
5.4 Experiment design
The QAP model and patient group characteristics are now ready to use. We will run two experiments that will be discussed below.
Experiment 1
The first experiment is a rescheduling experiment of the realized situation of 2016. We schedule the same 1117 patients that had surgery in a certain period of four weeks. Moreover, we use the same OR division for the specialties as in that period of 2016 in order to reproduce this cycle as accurate as possible. MSS-10 (which is the tenth period of four weeks in 2016) is used to reschedule, since this period is not affected by holidays or OR capacity reduction. This period starts on the fifth of September and ends on the second of October. The OR capacity is calculated as the ‘normal’ session time of 480 minutes (= 8 hours) minus the average setup time we calculated per specialty in section 4.6 plus an additional 30 minutes. When an OR session delays for less than 30 minutes, this has to be performed by the regular team of surgeons, which is already at the OR, if a delay of more than 30 minutes occurs, the surgery will be continued by the night shift.
OR capacity = 480 minutes – average setup time + 30 minutes
The results of this experiment will give us insight in the degree of improvement that can be established by scheduling according to the model, instead of randomly assigning patients to an OR session of the corresponding specialty.
Experiment 2
The second experiment is again a rescheduling experiment of the realized situation of 2016. However, we will add additional time to the OR capacity. The MST would like to know what the effect is of additional OR time how this should be used. This additional OR time can be generated in different ways. One OR is under construction so not in use at the moment, but it can be made operational which will increase the available OR time. Also, the current sessions can be expended by adding an extra shift. During this experiment we will add additional OR time to one OR session, but this additional time can thus be created through different ways. Since General surgery treats the biggest amount of patients, we add the additional OR time to their current capacity.