1 UNIVERSITY OF TWENTE / STUDYPORTALS
The Potential of Deep Learning
in Marketing:
Insights from Predicting Conversion with Deep Learning
Name: Rutger Ruizendaal
Student Number: s1225898
Date: 08-09-2017
Supervisors UT: Dr. S.A. de Vries & Dr. E. Constantinides
Supervisors StudyPortals: T. van Vugt & T. Farzami
Study: Communication Studies
I
Acknowledgements
The delivery of this master thesis marks the end of my academic studies at the University of Twente. After a bachelor and two master studies my time as a student has come to an end. This master thesis was written in conjunction with an internship at StudyPortals, the global study choice platform. Over the course of the past six months I finished my internship and worked on this master thesis with a lot of passion.
First, I would like to thank StudyPortals for providing me with the opportunity to do this internship. Throughout the internship I was given the freedom and trust to start new data projects that were originally not in the scope of the internship. Additionally, I was given the freedom and materials to implement deep learning algorithms. My focus has been on increasing data quality and automation for which I also built a data analysis application for the Analytics & Consulting Team at StudyPortals. Specifically I would like to thank Thijs van Vugt for his guidance and Tara Farzami for her technical expertise. Next, I would like to thank my supervisors at the University of Twente. I am aware that this is not a typical research for Marketing Communication and I am thankful that my supervisors gave me the freedom to implement this research. They took a chance by supervising me in this research and I believe it paid off. I also want to thank them for providing useful comments and feedback throughout the writing of this master thesis. Additionally, I would like to thank Robert Muster for taking the time to provide feedback as well. His feedback especially helped in restructuring and clarifying the methodology chapter.
Both this master thesis and internship have played a crucial role in my development towards becoming a data scientist. Where my first master thesis acted as an introduction into the field, this master thesis allowed me to dive a lot deeper and apply the machine learning algorithms I had learned about. Additionally, it gave me the opportunity to apply deep learning and learn about the practical
implications of running these computationally heavy models. I am very excited to be starting my next challenge as Technical Data Scientist at MIcompany in October. Finally, I would like to thank my family and friends for always supporting me during these busy and sometimes difficult times.
I hope you enjoy reading this master thesis.
Rutger Ruizendaal
II
Abstract
Jordan and Mitchell (2015) and Najafabadi et al. (2015) have discussed the high potential of deep learning in marketing. At the same time, the hype surrounding deep learning has been exponentially growing and is at an all-time high. However, there are few empirical studies researching applications of deep learning in marketing. This study tries to gain an understanding of the value of deep learning in predicting conversion. In order to fully understand the strengths and weaknesses of deep learning models they are also compared with traditional machine learning models. Specifically, this study attempts to capture the value of deep learning models for predicting conversion.
The dataset for this research has been collected at StudyPortals, the global study choice platform. The dataset consists of click-stream data containing over 56 million events. The dataset has been balanced to contain behaviour from over 36.000 converting users and over 36.000 non-converting users in the period 25-04-2017 till 25-05-2017. When comparing the traditional machine learning models the dataset has been pre-processed (normalization, one-hot encoding) in the way that each specific model requires. For the deep learning models the data has been organized as a sequence. All models have been
compared on various metrics including accuracy, precision, recall, f1-score, Logloss, prediction time, training time and the transparency of the model. Hereby the predictive quality and the practical usability of the models gets tested. All Models have been trained on a training set of the data and validated against a test set.
Results show that there are various advantages and disadvantages to using deep learning models when predicting conversion. The main disadvantages are: deep learning models are essentially black-box models, deep learning models require a lot of data to find complex patterns and deep learning models are computationally expensive and time-consuming to train and tune. The main advantages are: deep learning can capture sequential relationships in data, because of the hidden layers deep learning models can learn complex and non-linear functions and the deep learning models showed much better
predictive accuracy than the traditional machine learning models. The results indicate that when dealing with tabular data it is advisable to use ensemble models like Random Forest and Gradient Boosted Trees. When the data has a sequential aspect a deep learning model like a Recurrent Neural Network with Lost-Short Term Memory can provide good predictions. The value of deep learning is mainly found in its ability to capture complex patterns in the data which then allows it to make better predictions than traditional machine learning models. The findings of this study are not limited to predicting conversion, but can be generalized towards other marketing cases like churn prediction.
III
Table of Contents
Acknowledgements ... I
Abstract ... II
1. Introduction ... 1
1.1 StudyPortals ... 2
1.2 Research Questions ... 3
2. Literature Review ... 6
2.1 Literature Search ... 6
2.2 Modeling User Behavior for Conversion Prediction ... 7
2.3 Comparing Machine Learning Models ... 8
2.4 Comparing Deep Learning Models ... 10
2.5 Model Validation and Metrics ... 11
2.6 Research Model ... 12
3. Methodology ... 14
3.1 Modeling Approach... 14
3.1.1 Traditional Machine Models ... 14
3.2.1 Deep Learning Models ... 15
3.2 Data Collection ... 16
3.3 Feature Extraction ... 17
3.3.1 Traditional Machine Learning Models ... 17
3.3.2 Deep Learning Models ... 20
3.4 Data Pre-processing ... 21
3.4.1 Traditional Machine Learning Models ... 21
3.4.2 Deep Learning Models ... 23
3.5 Model Validation ... 25
4. Results ... 27
4.1 Descriptive Statistics ... 27
4.1.1 Traditional Machine Learning Models ... 27
4.1.2 Deep Learning Models ... 29
4.1.3 Correlations ... 30
4.2 Traditional Machine Learning Models ... 32
4.3 Deep Learning models ... 33
IV
4.4.1 Random Forest ... 34
4.4.2 Gradient Boosted Trees ... 36
4.4.3 Recurrent Neural Network with LSTM and GRU ... 38
5. Conclusion ... 39
5.1 Limitations ... 42
5.2 Future Research ... 43
6. References ... 44
7. Appendices ... 47
Appendix A ... 47
Appendix B ... 48
1
1. Introduction
Self-driving cars, Google Translate and smart speakers are all powered by deep learning. In recent years deep learning has been at the forefront of many breakthroughs in image recognition, speech recognition and natural language processing. Deep learning focuses on the use of artificial neural networks with multiple hidden layers that are inspired by the human brain. Literature on deep learning often discusses its potential in various areas like finance, education and marketing (Jordan & Mitchell, 2015; Najafabadi et al., 2015). However, in marketing research there are few empirical studies researching the value of deep learning in marketing contexts. Consequently, there is little known about practical applications of deep learning in marketing. This research assists in filling that gap by focusing on a specific marketing problem and exploring the value of deep learning models in marketing. Early research in this field has explored deep learning in predicting the next viewed product category on an e-commerce website (Tamhane, Arora & Warrier, 2017) and in predicting students’ next action in a MOOC (Tang, Peterson & Pardos, 2016). Therefore, this study focuses on a different marketing case: predicting conversion. In e-marketing, conversion occurs when a visitor of a website becomes a paying customer. In order to assess the performance of deep learning models it is important to compare their performance with other prediction models as well. Deep learning is a subset of machine learning, which is a broader field focused on the ability of algorithms to learn from big amounts of data. These other machine learning models who are not part of deep learning are in this research referred to as ‘traditional machine learning models’. By comparing both types of models on various metrics a more complete overview of the value of deep learning for marketing can be presented. At the end of this research we argue that these findings on predicting conversion can be generalized to other prediction problems in marketing such as prediction churn, purchases and click-through rates.
The predictors of conversion have been studied before any deep learning hype existed. Previous research has found positive relationships between the number of page views by a user and the likelihood to purchase (Bellman, Lohse & Johnson, 1999), as well as a positive relationship between session duration and user conversion (Lin, Hu, Sheng & Lee, 2010). However, Goldstein, Oestreicher-Singer and Barzilay (2017) show that more complex concepts like search diversity also affect the probability of conversion per user. Therefore, it is crucial to include other measures than merely the number of page views and average time a user has spent on a page when predicting conversion. It is also important to include the different page types visited by users (Goldstein et al., 2017). Additionally, the sequential relationship in user behaviour is often not considered in traditional machine learning models. Finding relevant features that represent this sequential relationship is a difficult and time-consuming task. However, deep learning models are designed to handle this sequential dimension that traditional machine learning models have much difficulty with. This has been shown by how deep learning models can handle language, where context is very important in determining meaning or sentiment (LeCun, Bengio & Hinton, 2015).
2 Processing Units (GPU) the training of deep learning models has become practical (Coates et al., 2013). Services like Amazon Web Services (AWS), Microsoft Azure and Google Cloud Platform have made it easier to work with deep learning without big upfront investments. To further understand the dataset that this research will use, the company where the dataset has been collected will now be presented.
1.1 StudyPortals
This master thesis has been written in conjunction with an internship at StudyPortals in Eindhoven, the Netherlands. The internship had a duration of five months and took place from the 5th of March 2017 till
the 5th of August 2017. StudyPortals is a global study choice platform that aims at making study choice
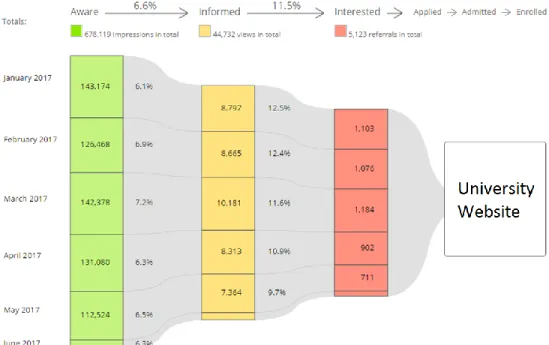
transparent on a global level. The company was founded because of student problems. For example, the difficulty in finding the right international experiences. Unclear and different websites per university often make this process much longer and tougher than it should be. StudyPortals provides students with one platform where they can compare and save studies they find interesting. Therefore, StudyPortals employs different portals such as MastersPortal, BachelorsPortal and PhDportal. Because of this, StudyPortals has a big amount of user data. There is click data from everyone who has visited the website. On its portals, StudyPortals list a combined 140.000 courses from 2450 universities located in 68 countries. The number of registered users is around 2 million and since 2013 around 53 million page views on studies are listed in the database. As StudyPortals is a study choice platform it does not sell anything to its main visitors, which are students. However, the site does offer students the opportunity to click through from a study page to the website of the university. Students who take this action are ‘converted’ and represent students who go from the aware/informed stage in the conversion funnel to the interested stage. Figure 1 presents an example of a conversion funnel for a university listed on StudyPortals. In this case we are interested in predicting the ‘red’ students from our overall visitors. These users are the converted users. The conversion path can be different for each user, but often starts with them landing on the homepage of one of StudyPortals’ portals. From there they can search for studies, or show studies them by discipline or country. Students then select a study and visit the page for that study. From that study page they can click-through to the university website and thus convert.
3 StudyPortals operates in the higher education market, which is currently going through a crucial period and is one of the main drivers behind the quick growth of StudyPortals. In 2013 a critical report was published on the state of higher education. According to the authors of this report “deep, radical and urgent transformation is required” (Barber, Donelly, Rizvi & Summers, 2013). Current models of education are said to be broken and universities are innovating too slowly to keep up with the rapid changes in the higher education market. These upcoming changes in higher education get compared to an avalanche. This comparison refers to how everything looks perfectly fine on the outside. However, on the inside all these changes are happening. Huge changes are coming although no one can say when they will come.
One of the main drivers behind these changes is globalization. Students are increasingly looking for education outside of their home country to find the best education. This development is caused by education-related factors like the increasing cost of higher education and how the economic value of a degree is dropping (Barber et al., 2013). Additionally push-factors like limited places for higher
education in certain countries play a role as well. External factors like Brexit, the Turkish coup d'état and the Greek government-debt crisis also play an important role in students seeking for education across borders. StudyPortals has seen the effects of these events in their daily page visits. In general,
international student mobility has been experiencing a continuing growth and has tripled between 1990 and 2014. An especially steep increase can be seen between 2000 and 2014, where international student mobility grew from 2.1 to 5 million (ICEF, 2015). Therefore, it becomes increasingly important for universities to reach international students and to track where each student is in the conversion funnel. This includes the ability to predict what users are most likely to convert and which users might not be likely to convert. Specific groups of users can then be reached through various interventions. Deep learning models seem to be a promising tool for predicting this user conversion.
1.2 Research Questions
4 data since both work with a dataset that consists of student data. The insights on machine learning algorithms in the EDM field will be used to select relevant machine learning models that will be used for comparison in this study.
This research will explore the value of deep learning when predicting conversion. In order to get a complete understanding of their strengths and weaknesses, multiple deep learning models will be compared with traditional machine learning models. The dataset these models will be tested on consists of clickstream data of students looking for an education abroad. First, the performance of traditional machine learning models will be compared on this dataset by using multiple metrics. Second, deep learning models will also be compared on this dataset. Third, the best performing models will be tuned through a process called hyperparameter optimization to decide which type of models perform best on this prediction task. Performance here does not merely reflect on the predictive quality of the model but also on its practical usability.
Therefore, the research goal has been defined as: To capture the value of deep learning models for predicting customer conversion.
Based on the introduction and the research goal, the following research problem has been formulated:
What is the value of deep learning models for predicting customer conversion?
The following sub-questions have been formulated based on the research problem:
- What variables has previous literature identified as being significantly related to conversion?
In order to enter a dataset into a machine learning model, feature extraction has to take place first. Feature extraction turns the raw clickstream data into features that can be entered into the model. Variables that have already been identified as being related to conversion will play an important role in deciding what features to use. This question will be answered trough the literature review.
- What are relevant metrics in the comparison of traditional machine learning and deep learning models?
An important part in the comparison of the various models is deciding what metrics they are compared on. Instead of comparing them on a single metric, like accuracy, this research provides a more holistic comparison by including different metrics. The literature review will provide an overview of metrics used by previous research on which the metrics used in this study will be based.
- What pre-processing steps should be taken in order to compare traditional machine learning and deep learning models?
5
- Do deep learning models perform better in predicting customer conversion than traditional machine learning models?
To answer the research problem it is crucial to know if deep learning models perform better than the traditional machine learning models. This question will combine results of the comparison on all included metrics and will be answered through the empirical study.
6
2. Literature Review
This chapter will present the literature review. First, the literature search will be described in detail, followed by the literature review itself. The literature review starts with previous research in the area of predicting conversion. Next, studies where machine learning models and deep learning models are compared are discussed. Following, validation and performance metrics are described. Finally, the research model is presented.
2.1 Literature Search
A systematic literature review has been performed according to the methods of Wolfswinkel, Furtmueller and Wilderom (2013) and Webster and Watson (2002). These methods focus on transparency of the literature review and allow for reproducibility. A computer search has been conducted during May and June of 2017 on the international research databases Scopus and Web of Science. Only journal articles and conference papers were considered for inclusion in the literature review. The final selection of papers has been composed through comparing abstracts, removing duplicates, number of citations, forward and backward citations and finally reading the full texts. This process is described in more detail below.
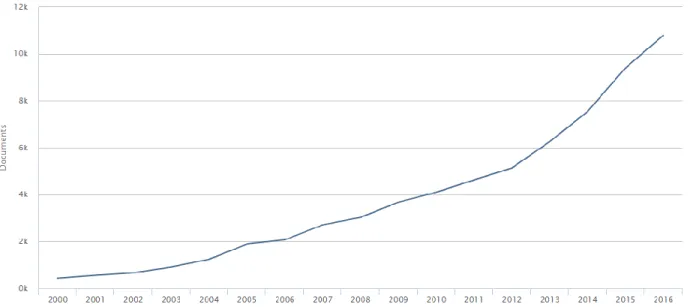
Figure 2 represents the amount of conference papers and journal articles on ‘machine learning’ per year since 2000. Figure 3 represents the same for papers on ‘deep learning’. Publications on machine learning seem to follow a more organic growth although a steeper increase since 2012 can be seen. On the other hand, the number of publications on deep learning experiences a very steep growth since 2012-2013. This shows the popularity that deep learning has been experiencing recently. Not just in practice but also in academics.
7
Figure 3.Number of journal articles and conference papers on ‘deep learning’ on Scopus per year. Detailed explanations of why each search term has been used can be found in Appendix A. Articles for the literature review were selected as follows. First, a ‘first’ selection was made based on the title and abstract of the paper. During the search, there has already been controlled for duplicate papers
between Scopus and Web of Science and between different search terms. Therefore, duplicates did not have to be removed afterwards. Next, inclusion was based on reading the full articles. After reading each paper a concept matrix has been updated, which can be found in Appendix B (Webster & Watson, 2002). Papers have been analyzed using the grounded theory approach, which has resulted in the current structure of the review (Wolfswinkel et al., 2013).
2.2 Modeling User Behavior for Conversion Prediction
Previous research has focused on the relationships between features like the number page views and session length on target variables like user conversion and likelihood to purchase (Bellman et al., 1999; Lin et al., 2010). However, recent research has shown that using more complex measures provides more accurate results when modeling user behavior (Goldstein et al., 2017).
8 importance of including different types of visited pages when modeling user behavior (Goldstein et al., 2017).
Lo, Frankowski and Leskovec (2016) researched user behaviors that led to purchasing on Pinterest in both the long and short-term. There are four type of actions a user can perform on Pinterest: search, zoom-in on a post, click through on a link and save a post. Results show that users with long-term purchasing intent tent to click through to more external content and save more posts. However, the closer a user gets to the purchase, the more their behavior switches from saves to searches. This indicates that the sequence of user behavior is indeed important when researching user behavior. On the other hand, Guo and Agichtein (2016) focus on the effects of mouse movement and scrolling in predicting whether the user has a research or purchase intent. As indicated by the results, scrolling interaction does matter when studying user behavior. Users that were predicted to have purchase intent had shown substantially higher amounts of scrolling than users with research intent.
These studies have shown that when modeling online user behavior, it is important to consider the number of page views (Bellman et al., 1999), session length (Lin et al., 2010), sequential aspect of user behavior (Gündüz & Özsu, 2003; Lo et al., 2016), different page types on the website (Goldstein et al., 2017; Chan et al., 2014) and scrolling behavior of users (Guo & Agichtein, 2016). Depending on the type of website studied these factors can all influence conversion.
2.3 Comparing Machine Learning Models
This part of the literature review will focus on the methodology behind machine learning algorithms and the comparison of them. The application of machine learning in Educational Data Mining research is studied because there are few examples of machine learning comparisons in a marketing context.
Universities and other educational institutions often have big collections of data on their students. To explore patterns and relationships in this data the research field of educational data mining started. Educational data mining (EDM) is a field of research that “is concerned with developing methods to explore the unique types of data in educational settings and, using these methods, to better understand students and the settings in which they learn” (Romero & Ventura, 2010, p. 601). Next to typical data mining techniques like clustering and classification, Romero and Ventura (2010) also include techniques like regression and visualization in their review on EDM. From a practical perspective EDM focuses on the discovery of knowledge through students’ usage data. The discovery of most of these patterns has become impossible to do by humans due to the large amounts of data. EDM borrows from fields like statistics and machine learning. Research in EDM is often performed for specific educational institutions and therefore uses datasets that are often smaller than the typical datasets in machine learning.
(Scheuer & McLaren, 2012).
9 Dekker, Pechenizkiy and Vleeshouwers (2009) researched whether machine learning methods could be used to predict student dropout. The study was conducted for Electrical Engineering students at the University of Eindhoven and consists of 648 students. Various algorithms are compared including Decision Tree, Bayesian Networks, Logistic Regression and Random Forest. The one rule algorithm is used as a baseline to compare the other models against. Results show that the performance across most models is similar (79%-81% accuracy) and that the one rule algorithm (76%) and the Bayesian network (75%) perform worst. Only the decision tree based on the CART methodology provided a significant improvement over the baseline algorithm. In another study, Delen (2010) predicted student dropout using five years of freshmen student data. The prediction occurs at the end of the first semester so decision makers can potentially perform an intervention during the second semester. The dataset consists of 16066 students and 39 variables. The dataset is unbalanced and consists of 20% dropout students and 80% students that were retained. Artificial Neural Networks, Decision Trees, Support Vector Machines, Logistic Regression and various ensemble techniques are compared on predictive accuracy. When using the full (unbalanced) dataset the Support Vector Machine performs best with an accuracy of 87.23%. However, because the dataset contains much more retaining students than dropout students the model is not actually good at predicting dropout. Rather, the model is overestimating the amount of students in the retained category. Next, the authors create a balanced dataset where the Support Vector Machine still performs best with 81.18% accuracy. The authors also compared the ensemble methods Random Forest and Gradient Boosted Trees and found that Random Forest performed best.
Alper and Cataltepe (2012) compared machine learning algorithms on the task of predicting whether a student would pass or fail a fourth-year course based on previously obtained grades. The dataset consists of data on students from 2005 to 2011 for Computer Engineering students at Istanbul Technical University. Compared machine learning models include: Naïve Bayes, Neural Network (multilayer perceptron), SVM (rbf kernel) and Logistic Regression. The predictions are calculated for three different courses. For each course, a different model performs best. Naïve bayes, Logistic Regression and
Bayesian Logistic Regression belong to the best performing models. On the other hand, Kabakchieva (2013) compared machine learning models while predicting student grades classified in 5 categories; bad, average, good, very good and excellent. Compared models are: Decision Tree, Naïve Bayes,
Bayesian Net, k-Nearest Neighbors and Rule Learner. The accuracy in predicting different classes varies a lot. Additionally, all models have an overall accuracy below 70% as well as recall and precision scores below .70. The Bayes classifiers perform worst while the decision tree is the most reliable across all classes. The dataset is very unbalanced. For example, 4336 students are in the ‘very good’ class while 347 students are in the ‘average’ class. This is probably the cause of the bad performance of the machine learning models. Romero, Espejo, Zafra, Romero and Ventura (2013) also compare machine learning models while predicting student marks. The marks to predict are split-up in four categories: fail, pass, good and excellent. 21 different machine learning classifiers have been compared. Results show that pre-processing tasks like rebalancing of the data, discretization and processing of categorical variables all affect different models. However, the accuracy of most models is still not high, peaking below 66% accuracy.
10 The authors do not try deep learning algorithms but instead experiment with different n-gram features to use in the prediction. Results show that 3 or 4 n-gram features perform best when considering precision, recall and the f1-score.
2.4 Comparing Deep Learning Models
This section focuses on the use of deep learning in EDM research, how to compare deep learning models and the architectural decisions that have to be made when designing various models.
Guo, Zhang, Xu, Shi and Yang (2015) predicted student performance based on a combination of five types of data sources: background & demographic data, past study data, school assessment data, study data and personal data. Student performance is categorized in five classes. The deep neural network is first pre-trained using a sparse auto-encoder and is then treated as a supervised learning problem to finetune the parameters. The authors’ deep neural network outperforms Naïve Bayes, SVM and multilayer perceptron algorithms. Piech et al. (2016) researched the use of Recurrent Neural Networks to model student learning. The main advantage of these type of networks is that they consider the sequential dimension and can model long-term dependencies. The input into the model is a list of student interactions and the output of the model consists of whether the student would answer exercises correctly or not. The authors use an embedding layer instead of one-hot encoding because one-hot encoding would result in very large and sparse vectors (Piech et al., 2016). The RNN with LSTM performs better than Bayesian Knowledge Tracing models. The two main advantages of this model are that they do not need expert feature engineering and they can operate on any input that can be vectorized. A downside is that they need large amounts of training data. Additionally, Tang et al. (2016) also researched the use of Recurrent Neural Networks with LSTM on sequential educational data. The authors tried the predict the next action of a student participating in a MOOC course. The best
performing model was a Recurrent Neural Network with LSTM units. The model achieved an accuracy of 72.23%.
Tamhane et al. (2017) researched whether a sequence of visited product categories on a fashion e-commerce website could be used to predict the last viewed product category. To deal with the
sequential nature of the data the authors use a Recurrent Neural Network with a Gated Recurrent Unit (GRU). The GRU has a similar structure as the LSTM units discussed earlier. The authors also use an embedding layer to map each product category into a vector. The RNN achieves better results than the baseline methods; majority voting and the product group graph method. Main conclusions are that the RNN (with GRU) performs better when the context changes within a session. Additionally, the RNN performs better as more data becomes available and when the behavioral user sequence becomes longer. Salehinejad and Rahnamayan (2016) used a RNN with LSTM to accurately predict customer behavior on a grocery shopping dataset.
11 set or on other new data all neurons are ‘on’. Figure 4 presents a visual representation of dropout. When comparing different deep learning models, it is important to keep activation functions and the number of hidden units similar across different models (Guo et al., 2015; Piech et al., 2016). Application of dropout is important to prevent complex architectures from overfitting soon in the training process.
Figure 4. Example of dropout. Adapted from Srivastava et al. (2014, p. 1930).
In Natural Language Processing, it has become increasingly popular to transform words into a vector as preparation for a deep learning model. This approach was popularized by the ‘word2vec’ model and has been described in Mikolov, Chen, Corrado and Dean (2013) and Goldberg and Levy (2014). When using an embedding layer each word is changed to an index. In the embedding table this index can then be used to look-up the corresponding vector. Embedding layers do not result in huge vectors like one-hot encoding all these words would in a big language model. During the training process of the deep learning algorithms the weights of the embedding vector get updated just like the weights in the deep learning model (Piech et al., 2016). This also allows for the exploration of similar words after a language model has been trained. Lately, research has explored the use of embedding layers for different features than words or word combinations. Tang et al. (2016) used embeddings to represent actions taken by users in a MOOC. Additionally, Tamhane et al. (2017) used embeddings to represent different product categories on an e-commerce website.
2.5 Model Validation and Metrics
Next, it is important to consider the validation approach and metrics used when comparing different machine learning models.
Cross-validation is a common approach in the comparison of machine learning models (Alper & Cataltepe, 2012; Kabakchieva, 2013; Romero et al., 2013). In this process, the dataset gets split up in different folds for validation of the prediction model. The obtained metrics from the different folds are then averaged at the end. For example, when using 10-fold cross-validation the machine learning model gets trained on 90% of the dataset and validated on 10% of the dataset. This then happens 10 times for different folds of the dataset. This provides a more stable way of analyzing a machine learning model than using one training and test split. However, deep learning models are often much more expensive to train. Even when training deep learnings on a GPU they can take significantly longer to train than
12 deep learning because the process is often too time consuming. In deep learning, the single train-test split is often used.
In terms of metrics to validate the model on, accuracy is the main metric used and occurs in almost every study where machine learning algorithms are compared. Additionally, recall, precision and the f1-score all provide additional insights next to accuracy (Kabakchieva, 2013; Li et al., 2017). Especially in unbalanced datasets, accuracy can give a distorted picture of the performance of the algorithm. The f1-score is a way to combine precision and recall into one metric. Dekker et al. (2009) chose a baseline algorithm and compared if other models significantly improved on the accuracy of the baseline model. Guo et al. (2015) and Tang et al. (2016) point out the importance of training time in the comparison of deep learning models. These models must be trained on a GPU. Additionally, training on a GPU can still take very long which can make it difficult to do a thorough grid search of hyperparameters. Table 1 presents an overview of the different metrics used in research that involved the comparison of machine learning models.
Table 1
Metrics used in papers where machine learning models are compared
Authors Metrics used in study
Alper & Cataltepe (2012) Accuracy
Dekker et al. (2009) Accuracy, significant changes on FP, NP, TP, TN
Delen (2010) Accuracy, per-class accuracy
Goldstein et al. (2016) Precision, F1-score
Guo & Agichtein (2016) Precision, recall, f1-score
Guo et al. (2015) Accuracy, training time
Kabakchieva (2013) Recall, precision
Li et al. (2017) Precision, recall, f1-score
Piech et al. (2016) AUC
Romero et al. (2013) Accuracy
Tamhane et al. (2017) Normalized Discounted Cumulative Gain, Precision, Recall
Tang et al. (2016) Accuracy
2.6 Research Model
13
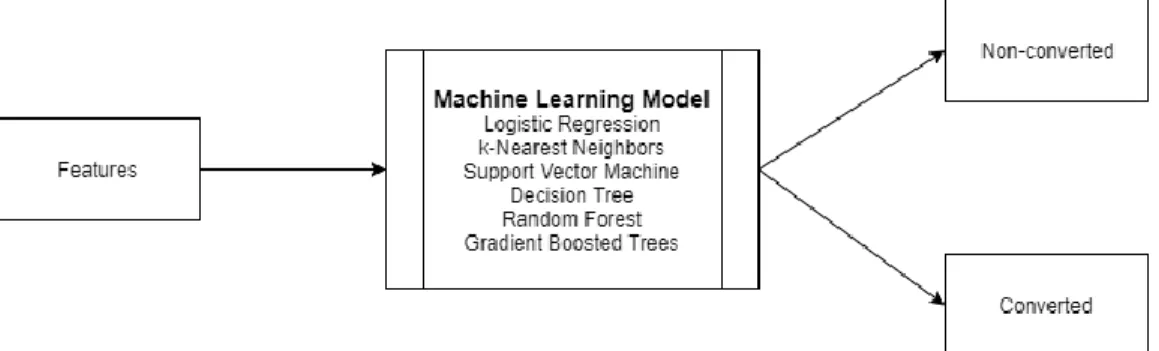
Figure 5. Schematic representation of the traditional machine learning approach.
Figure 6. Schematic representation of the deep learning approach.
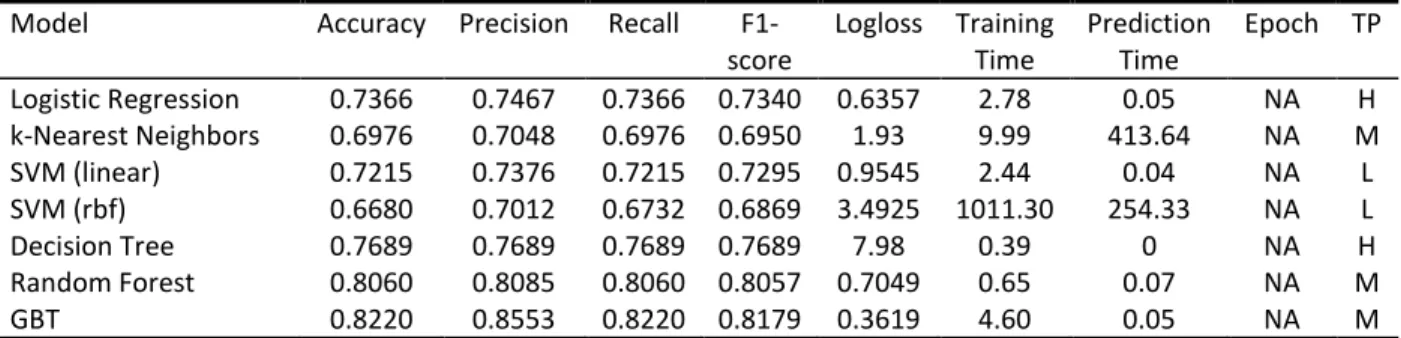
The goal of this study is to capture the value of deep learning for predicting customer conversion. In order to do that various deep learning models are compared with each other. Additionally, these deep learning models are also compared with traditional machine learning models. All these models are compared on the same metrics. Part of these metrics focuses on assessing the predictive quality of the model. These metrics are accuracy, precision, recall, f1-score and Logloss. The other part of these metrics focuses on the practical usability of the model. These metrics are the training time, prediction, the epoch the model achieved its best prediction at and the transparency of the model. The epoch metric is specific to deep learning models. Table 2 presents an overview of the table that this study will try to fill-in and is therefore also the research model of this study.
Table 2
Research Model
Model Accuracy Precision Recall
F1-score
Logloss Training
Time
Prediction Time
Epoch Trans-
parency Model A
14
3. Methodology
This study will compare various traditional machine learning models and deep learning models on predicting conversion. Both approaches require their own type of input data and specific pre-preprocessing tasks. Therefore, most methodology sections are split-up in two parts. This provides a clearer way to describe the required pre-processing steps and analysis required for both types of models. First, the modeling approach will be discussed which presents a short summary of the different models used in the study. Second, the dataset and its collection will be discussed. Third, the feature extraction process will be described. Fourth, the various pre-processing tasks will be discussed. Finally, the metrics and validation of the models will be discussed.
3.1 Modeling Approach
3.1.1 Traditional Machine Models
The traditional machine learning models require features to be extracted and their input to be prepared in a tabular format. The best way to understand this is by comparison to an Excel sheet. Every row is one sample of the data and every column is one feature. When working with a tabular dataset it does not matter whether a value is in row 1 or in row 100, column 1 or column 100. Therefore, the input into these models can include features like: the number of study pages visited, the total number of pixels scrolled etc. However, the model cannot consider the effects of what action was taken in what order. This section provides a quick overview of the different machine learning algorithms used in this study.
Logistic Regression
Logistic Regression is a regression model where the dependent variable is categorical. Standard logistic regression focuses on binary classification. The model tries to fit a regression curve to the data using the sigmoid function and predicts whether a data point belongs to category 0 or 1.
k-Nearest Neighbors
The k-Nearest Neighbors algorithm (k-NN) makes a prediction based on the similarity of nearby data points. The similarity of data points is calculated based on the distance between the features of each data point. Therefore, it is important that all features are on a similar scale. Otherwise, a single variable with high values can skew the prediction.
Support Vector Machine
The support Vector Machine (SVM) tries to find a multi-dimensional hyperplane that separates the data points in a way that maximizes the distance between this hyperplane and the closest data point on each side of the plane. If the input is a k-dimensional vector (where k stands for each feature), the algorithm operates in a k-dimensional space. The SVM supports various kernels which can be used so that the algorithm can find non-linear relationships in the k-dimensional space. In this thesis, the linear kernel and the radian basis function (rbf) kernel will be used.
Decision Tree
15
Random Forest
A random Forest (RF) is an ensemble method of decision trees that constructs many decision trees based on random subsets of features and random parts of the dataset. One of the main advantages of a random forest is that the random selection of features on each tree balances the tendency of decision trees to overfit on the training set. Overfitting occurs when a machine learning model is very good at finding patterns in the provided training set but does not generalize well to new data.
Gradient Boosted Trees
Gradient Boosted Trees (GBT) is another ensemble method of decision trees. The core idea behind gradient boosting is to combine many ‘weak learners’, decision trees that perform not much better than random guesses. Each new tree is added on top of existing trees and a loss function is minimized
through gradient descent. This thesis will use the ‘XGBoost’ implementation of Gradient Boosted Trees which uses more regularization to prevent overfitting.
3.2.1 Deep Learning Models
Deep learning models have been achieving breakthroughs with unstructured data. Examples of these data types are images, speech and text. These data types all include a sequential element that traditional machine learning models cannot easily capture. For example, when working with image recognition it is very important to know in what part of the image a certain group of pixels occurs. If you try to recognize a face it is not enough to know that there are two eyes, a nose and a mouth in the image. Additionally, you also need to know where in the image these things are in relation to one another. Another example is found in natural language processing. When working with sentences the order in which words appear is very important in determining the meaning and sentiment of the sentence. Next to language, behavior can also be organized as a sequence.
Deep Neural Network
The Deep Neural Network (DNN) is an artificial neural network with multiple hidden (deep) layers. The combination of multiple deep layers allows the network to learn complex and non-linear functions. Basically, the network consists of matrix multiplications along each layer of the network. The network is trained through backpropagation with gradient descent.
Convolutional Neural Network
The Convolutional Neural Network (CNN) is a popular choice in image recognition. The network operates by sliding multiple filters over the data. The contents of these filters are learned by the network itself. In the case of images, the inputs are multi-dimensional. However, in this case the input is a
one-dimensional sequence. Therefore, the filters are one-one-dimensional as well.
Recurrent Neural Network
16 The DNN, CNN and RNN architectures have been chosen because they represent the main architectures used in deep learning (LeCun et al., 2015). Different variations of each architecture will be used related to the number of hidden layers and type of units used in the recurrent neural network. The architectural choices in deep learning are, for a big part, still based on intuition. By exploring different variations of each architecture the effects of different architectures can be seen.
3.2 Data Collection
All data for this master thesis has been collected from StudyPortals’ database. StudyPortals stores their data in Amazon Redshift. Redshift is a cloud data warehouse system hosted by Amazon and is built on PostgreSQL. StudyPortals tracks and stores user behavior data in table called ‘events’. This events table contains clickstream data of the users of the StudyPortals website The two main types of events that are stored in this table are ‘page view’ and ‘page ping’ events. Page view events show which pages the user viewed and can be used to construct the path a user took on the StudyPortals website. Page ping events are recorded per interval of a couple seconds and show the position of the website on the user’s screen. From this information the scrolling behavior of the user can be calculated. The events table also records the conversion events that this study will try to predict. The full events table has a very big amount of data. Therefore, the data analysis for this thesis will be executed on a sample of this dataset. Training some of the machine learning models on the full dataset would be too heavy to run locally and would also take too long. Therefore, the comparison of models is done on one month of data ranging from 25-04-2017 till 25-05-2017. This sample contains a total of 56.349.410 events and includes over 36.000 converting users. From this sample, the user behavior for both converting users and non-converting users can be extracted. To create the dataset of converted users the first step is to get the first conversion event for each user in the user’s first session (Lo et al., 2016). Next, the behavior for each user up until the conversion event is collected based on the timestamp of the conversion event. The process to create the dataset of non-converting users is similar. Although there, only users without conversion events are included since users without these are non-converting users. The behavioral dataset is then created by combining the dataset that has information of the converted users with information of users that did not convert.
For the training of all machine learning models a balanced dataset is used. This means that the same amount of converting users as non-converting users will be used to train the models. There are much more people in the overall dataset that did not convert than users that did convert. We take the number of converting users and then randomly select the same number of non-converting users. Using the full amount of non-converting users would greatly skew the dataset as seen in Delen (2010). For example, imagine a dataset consisting of 95% non-converting users and 5% converting users. A machine learning model can then simply predict that a user is non-converting 95% of the time and achieve 95% accuracy without learning anything from the data. Additionally, only users that have at least three registered page views are included in the dataset that is used for training the machine learning models. A quick first model built as a test model scored 94% accuracy. However, this model was greatly skewed by non-converting users with 0 registered page views. These users are probably logged into the table by another one of StudyPortals’ databases. Because the referral button is shown on study pages, a user needs to have page views to see a referral button and click on one. See appendix C for more information on this decision.
17 models will be trained locally on a CPU. The deep learning models will be trained on an external GPU server hosted by Amazon. These GPUs are optimized for deep learning models and allow for great parallelization of matrix operations.
Python libraries that are the standard for data science have been used in this research. Here is an overview of the main python libraries used and the task that they were used for:
- Numpy (linear algebra) - Pandas (data analysis)
- Matplotlib & Seaborn (data visualization) - Scikit-learn (machine learning)
- XGBoost (gradient boosted trees) - Keras & Theano (deep learning)
- SQLAlchemy (communication with StudyPortals’ Redshift database)
3.3 Feature Extraction
3.3.1 Traditional Machine Learning Models
For the traditional machine learning models, the feature extraction process is crucial for the
performance of the model. This section presents how all features have been extracted from the raw clickstream data. Table 3 presents an overview of all the extracted features. The features are presented in categories that show the type of data each feature belongs to. Most features are selected based on results from previous studies discussed in the literature review. Other features are specific to the StudyPortals website and are therefore extracted. It should be noted that the main goal here is to extract as many meaningful features that could influence conversion. This study does not test
hypotheses for the relationships between each feature and the target variable and whether these are significant or not. The main focus is on the comparison of the different models.
Total interactions
The first feature simply contains information on the overall interactions recorded per user.
Online tests
StudyPortals offers two online tests that users can fill in to assist them with their study choice. These tests are a country test and a personality test. The tests serve as a way to give the user better
suggestions for studies that might fit them. Doing one of these tests could influence the conversion of a user. It is expected that a user that got tailored suggestions is more likely to convert. These variables are measured as binary variables: whether a user did the test (1) or not (0).
Page pings
18
Page views
The next type of events to include in the model are page view events. The total number of page view events is included as a feature. Next, the average time spent on each page has been calculated by dividing the session length by the total number of page views per user. The average time per event contains information on whether the user has stayed longer on each page or whether the user is quickly clicking through the website. The URL of the viewed page can be used the extract the type of page the user viewed. There are many different pages a user can visit and some of them are quite rare. Including all these unique page types into the model would cause the model to be flooded with redundant features (Chan et al., 2014). In order to make the model more transparent and reduce unnecessary complexity of the model only the most viewed page types are included. The most viewed pages in a recent daily sample of the dataset were explored. Table 4 presents the top ten page types that are included for feature selection. It was decided to combine ‘study-options’ and ‘study-options-c’, as well as ‘scholarship’ and ‘scholarships’. In both cases these pages represent the same page type but are logged differently depending on the portal the user is on. The sum of page views on the eleventh most visited page type was a lot lower than on the 10th most viewed page type. (from 371.169 to 89.023).
Therefore, the top ten pages are included as features for the model. The page type can be extracted from the URL by splitting the URL based on slashes and selecting the part between the first and second slash. For example, the page URL is saved as ‘ www.mastersportal.eu/studies/29143/sciences-du-medicament-qualite-des-medicaments-et-des-aliments.html’. From this example ‘studies’ is the page type. The number of page views per page type are also included as features. These are the page types shown in table 4.
Meta information
Finally, the meta information from each user is included. These features are included as categorical features and include information on the user’s: country of origin, browser, operating system, type of device and the portal the user entered on. StudyPortals has various portals (BachelorsPortal,
MastersPortal etc.) and the portal the user visited could influence conversion.
Target
19 Table 3
Features included in the dataset used for the Traditional Machine Learning models
Feature Description Example values
Total interactions
No_of_interactions Total number of interactions. integer
Online tests
No_of_ctests Whether the user did a country test. 0, 1
No_of_ptests Whether the user did a personality test. 0, 1
Page pings
Page_pings Number of page ping events Integer
Scrolling Total amount of vertical scrolling in pixels. Integer
Page views
Page_views Number of page view events. Integer
Avg_page_time Average time per interaction in seconds. Integer
No_studies Number of study pages viewed. Integer
No_searches Number of search pages viewed. Integer
No_homepages Number of homepages viewed. Integer
No_study_options Number of study option pages viewed. Integer
No_universities Number of university pages viewed. Integer
No_disciplines Number of discipline pages viewed. Integer
No_articles Number of article pages viewed. Integer
No_countries Number of country pages viewed. Integer
No_account Number of personal account pages viewed. Integer
No_scholarships Number of scholarship pages viewed. integer
Meta information
Page_url_host The portal that the user entered on. www.mastersportal.eu
Geo_country Country the user visited from. GB, US
Br_family Type of browser used. Firefox
Os_family Type of operating system used. Linux, Chrome OS
Dvce_type Type of device used. Computer, Mobile
Target
20 Table 4
Top ten most visited page types in the sample
Page type Page views
Studies 2.323.800
Search 1.439.348
Homepage (empty string) 1.061.880
Study-options + study-options-c 1.072.820
Articles 888.503
Universities 731.369
Disciplines 586.254
Countries 529.042
Account 466.843
Scholarship + scholarships 371.169
3.3.2 Deep Learning Models
For deep learning models the feature extraction part is much less crucial to the performance of the model. Deep learning models essentially learn the features themselves. Therefore, these models can use much ‘rawer’ data than traditional machine learning models. However, the sequence of clickstream data as stored in the events table cannot be directly passed into them either. In order to create the
behavioral sequence per user, decisions have to be made as to what constitutes a behavior that should be included in that sequence. Categorical variables like the browser of the user and the country of the user are not included here. The focus is purely on the behavior of the user as this can be represented as a sequence. As mentioned in the previous section the events table at StudyPortals mainly tracks page view events and page ping events. Therefore, behaviors are extracted from these two event types. The different type of behaviors will be represented by an index to be used by the embedding layer in the model (see section 3.4.2). Therefore, decisions need to be made on what constitutes a behavior and which behaviors should be included.
Page view events
A page view event is characterized by two main variables: the portal the user was on and the type of page the user viewed. Portals refer to different websites of StudyPortals like BachelorsPortal and MastersPortal. The type of page refers to different pages users can visit on these portals like studies, articles and disciplines. By combining portal type and page type the different page view behaviors will be created. It is expected that different pages will be popular on different portals. Also, portals can be organized differently and whether a user will convert could be influenced by the portal they are on. Similar to the traditional machine learning models we do not want to include every possible
combination of portal and page type. Therefore, we look at the most viewed portals and page types in our dataset and use this to decide which portals and page types are viewed enough to include. For the portal type, there are 13 main portal types until page views per portal drop quickly. Portal types not part of these 13 are combined into a 14th type called ‘other’. Similarly, there are 25 main page types, the
21
Page ping events
Page ping events include information on vertical scrolling in pixels. Instead of calculating the sum of pixels scrolled, we now include each scrolling behavior in the behavioral sequence. To code this scrolling into behavior they have to be put into categories of pixels scrolled. Figure 7 presents the histogram on the amount of scrolling per page ping event. There is a small number of outliers above 5000 pixels that are excluded from this histogram for visualization purposes. One can see that the number of page ping events with over 4000 pixels scrolled is very small. Therefore, it has been decided to create scrolling categories up until 4000 pixels. The smallest category is 0 scrolling and everything above 4000 is categorized as 4000+. Everything in between is split into categories of 100 scrolling. The page ping events used to calculate the scrolling behavior are recorded in regular intervals. Zero pixels scrolled means that the user has not scrolled in that interval. This can, for example, happen when a user is reading text on the page. As an example the categories of scrolling are saved as ‘0’ and ‘200-300’.
Figure 7. Histogram on vertical scrolling in pixels per page ping event.
3.4 Data Pre-processing
3.4.1 Traditional Machine Learning Models
22
Categorical Variables
There are two main ways to encode categorical variables in machine learning: label encoding and one-hot-encoding. Label encoding turns categorical variables into numbers. Tree-based machine learning models can handle these categories because of how they split the data at each node. However, linear models cannot deal with this encoding because it implies an order. For these linear models, another type of encoding is often used called one-hot encoding. One-hot encoding creates a new feature for each level of the categorical feature. For the true value that feature will be 1 and for all other features it will be 0. When a categorical variable has many levels this will create many of these 0 values in the dataset. Table 5 provides an example of both types of encoding using the device type of users.
Table 5
Example of Label Encoding and One-Hot Encoding
One-Hot Encoding
Label Encoding Is_computer Is_tablet Is_mobile
Computer 0 1 0 0
Tablet 1 0 1 0
Mobile 2 0 0 1
Normalization
Additionally, some machine learning models operate on the distance between features. For example, the k-NN algorithm searches to find the closest neighbors to a data point based on the distances between its features. Therefore, it is very important that these features are on a similar scale.
Normalization takes care of this issue by scaling all numerical features to be on a scale from zero to one.
23 Table 6
Accuracy scores (%) of different pre-processing tasks per machine learning model
Model LE LE & Normalization OHE OHE & Normalization
Logistic Regression 74 69.32 75.85 71.88
k-NN 55.85 66.68 59.5 68.57
SVM (linear) 63.43 70.87 70.87 72.37
SVM (rbf) 53.63 59.2 59.85 66.93
Decision Tree 77.23 75.87 76.77 77
Note. LE = Label Encoding. OHE = One-hot Encoding. The highest accuracy score per model is in bold.
3.4.2 Deep Learning Models
Now that all unique behaviors have been defined in section 3.3.2 it is possible to assign an index to each unique behavior. For example, a page view on a study page on MastersPortal gets index 1 and scrolling between 200 and 300 pixels get index 2 etc. Using these indexes, a numerical sequence representing the behavior of the user can be created.
Sequence length
Next, a decision should be made on the maximum length of the behavioral sequence. Some users have a short sequence of behaviors while other users show much more behaviors. The deep learning models expect all input to consist of the same length. Therefore, the sequence length must be decided. Figure 8 provides a histogram on the sequence length per user, where the x-axis has been cut at 250 for
24
Figure 8. Histogram on sequence length per user.
The sequence of user behavior has been created using the indexes for each unique behavior. Therefore, an example sequence looks like this: 4, 142, 3, 3, 7, 47, 59, 101, 45 etc.
All deep learning models will start with an embedding layer (Tang et al., 2016; Tamhane et al., 2017). This layer assigns several latent factors to each behavior. These latent factors are then used to train the model. Basically, it turns positive integers into dense vectors of fixed size. The deep learning model can be trained using these latent factors (Gal & Ghahramani, 2016). Table 7 provides an example of a small embedding matrix with five unique behaviors and 9 latent factors per behavior.
Table 7
Example of a small embedding matrix
Latent Factors
Index Represented behavior LF1 LF2 LF3 LF4 LF5 LF6 LF7 LF8 LF9 1 Mastersportalstudies .32 .02 .48 .21 .56 .15 .21 .27 .23 2 Bachelorsportalsearch .65 .23 .41 .57 .03 .92 .88 .36 .24 3 Phdportalcountries .45 .87 .89 .45 .12 .01 .51 .14 .74
4 0-100 .65 .21 .25 .45 .78 .82 .36 .34 .23
5 1500-1600 .04 .19 .63 .27 .85 .15 .56 .15 .14
25
3.5 Model Validation
The dataset will be split-up into a training set and a test set. Machine learning models are often
compared based on cross-validation. However, for deep learning models this is often not possible due to computational restrictions. Therefore, this research will use the same train-test split for all models. The training set is used to train the model on. This where the model learns and finds patterns in the data. However, there is the risk that the model overfits. This happens when the model learns patterns from the data that are too specific. The model then does not generalize well when making predictions on new data, which is the main reason machine learning models are used. In order to the test the
generalizability of the model a test set is used. The test set includes data that the model has not seen before. The training set will contain 70% of the data and the test will contain 30% of the data. Splitting the dataset in this way allows for a good general comparison of the different algorithms. Next, the best performing models will be tuned through a process called hyperparameter optimization. The
hyperparameter optimization will happen through a grid search. A grid search is a way of optimizing hyperparameters by trying different values of these parameters. Machine learning models have a set of parameters that are learned from the training data. Additionally, there are other parameters that cannot be learned from the training process. These parameters are called hyperparameters and vary for each machine learning model. This process allows us to see how much performance gain can be
achieved by not simply using the base values of the hyperparameters of these models. The differences in performance will probably be small based on changing the hyperparameters. Therefore, cross-validation will be used when tuning the parameters of the best performing models. Cross-cross-validation splits the dataset in different training and test sets and calculates the performance for each fold. Then, the performance scores are averaged at the end. By using k-fold cross-validation we know that the results are not influenced by the way the dataset is split.
Evaluation Metrics
26 Table 8
Confusion Matrix
Predicted Class
Positive Negative
Actual Class
Positive True Positives (TP) False Negatives (FN)
Negative False Positives (FP) True Negatives (TN)
The evaluation metrics can then be formulated as follows.
𝐴𝑐𝑐𝑢𝑟𝑎𝑐𝑦 = 𝑇𝑃 + 𝑇𝑁
𝑇𝑃 + 𝑇𝑁 + 𝐹𝑃 + 𝐹𝑁
𝑅𝑒𝑐𝑎𝑙𝑙 = 𝑇𝑃
𝑇𝑃 + 𝐹𝑁
𝑃𝑟𝑒𝑐𝑖𝑠𝑖𝑜𝑛 = 𝑇𝑃
𝑇𝑃 + 𝐹𝑃
𝐹1 𝑠𝑐𝑜𝑟𝑒 = 2 ∗ 𝑝𝑟𝑒𝑐𝑖𝑠𝑖𝑜𝑛 ∗ 𝑟𝑒𝑐𝑎𝑙𝑙
27
4. Results
This chapter will present the results of the analysis. First, descriptive statistics of the dataset will be presented. Second, the traditional machine learning models will be compared on the various metrics presented in the previous chapter. Third, the deep learning models will also be compared on these metrics. Finally, the best performing models will be tuned through hyperparameter optimization.
4.1 Descriptive Statistics
This section will present descriptive statistics on the datasets used for both type of models. First, the descriptive statistics for the traditional machine learning models are discussed. Next, descriptive statistics on the sequence of user behavior used for the deep learning models are discussed.
4.1.1 Traditional Machine Learning Models
Descriptive statistics for all numerical features can be found in table 9, while table 10 presents information on all categorical features. The dataset (for both machine learning and deep learning models) consists of 75.566 users. The dataset is completely balanced and consists of 36.283 users that converted and 36.283 users that did not convert. Descriptive statistics presented in tables 9 and 10 are calculated separately for the two groups, converting users and non-converting users. This way the relationship between each feature and the target variable can be explored. On average, converting users report a higher mean value for main interactions like the total number of interactions, the number of page views and the number of page pings. Converting users also show much more scrolling (20.656 vs 11.984). This could indicate that converting users interact more with the website than non-converting users. On the other hand, non-converting users do more personality tests (0.11 vs 0.03), visit more homepages (0.92 vs 0.39), more account pages (0.31 vs 0.13) and more scholarship pages (0.37 vs. 0).
When not taking the target variable into account, the average number of interactions per user is 34.65. On average, a user experiences more page ping events (14.67) than page view events (6.28). This falls in line with expectations as it is expected that a user would scroll more with a page than view pages. Table 9 also shows that the scrolling feature is on a different scale than the other features. The tree-based machine learning models know how to handle this difference. Other machine learning models, like k-Nearest Neighbors cannot naturally handle this which is why the features are normalized for these models (see section 3.3.1). The mean of both the country test and the personality test features are low. These features are measured as binary variables. Especially the country test does not seem to be used by many users. Additionally, much more non-converting users than converting users did a personality test. Table 10 also shows that many non-converting users entered StudyPortals on the personality test page. Exploring this actual page showed why the personality test generally leads to non-converting users. The page presents the user with a test and the user is afterwards informed that the results will be send by e-mail. However, after completing the test there is no easy way to go back to the other portals on the StudyPortals website. The target variable has a mean of 0.5 and a standard deviation of 0.5. This is as expected because the dataset is balanced with half of the dataset consisting of converting users (1) and the other half consisting of non-converting users (0).
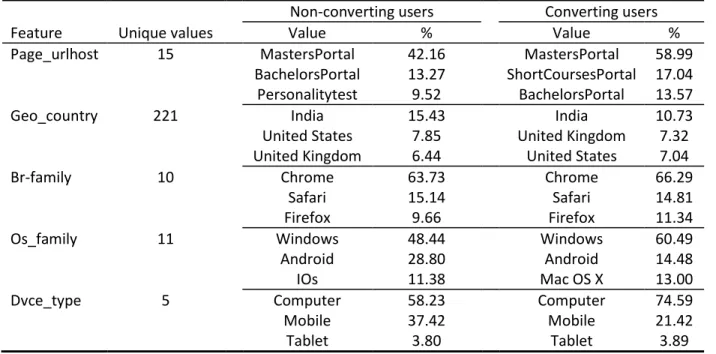
28 use a computer and have Windows as their operating system. For non-converting users the mobile device with Android operating system is much more used than by converting users.
Table 9
Mean values of numerical features
Feature Non-converting users Converting users
Total interactions
No_of_interactions 30.67 38.64
Online tests
No_of_ctests 0.001 0.001
No_of_ptests 0.11 0.03
Page pings
Page_pings 14.11 15.21
Scrolling 11984.07 20656.01
Page views
Page_views 6.07 6.51
Avg_page_time 310.72 37.89
No_studies 1.08 2.68
No_searches 0.96 1.33
No_homepages 0.92 0.39
No_study_options 0.58 0.53
No_universities 0.44 0.39
No_disciplines 0.38 0.52
No_articles 0.28 0.11
No_countries 0.33 0.34
No_account 0.31 0.13
No_scholarships 0.37 0
Target
29 Table 10
Descriptive statistics of categorical features
Non-converting users Converting users
Feature Unique values Value % Value %
Page_urlhost 15 MastersPortal
BachelorsPortal Personalitytest 42.16 13.27 9.52 MastersPortal ShortCoursesPortal BachelorsPortal 58.99 17.04 13.57
Geo_country 221 India
United States United Kingdom 15.43 7.85 6.44 India United Kingdom United States 10.73 7.32 7.04
Br-family 10 Chrome
Safari Firefox 63.73 15.14 9.66 Chrome Safari Firefox 66.29 14.81 11.34
Os_family 11 Windows
Android IOs 48.44 28.80 11.38 Windows Android Mac OS X
60.49 14.48 13.00
Dvce_type 5 Computer
Mobile Tablet 58.23 37.42 3.80 Computer Mobile Tablet 74.59 21.42 3.89
4.1.2 Deep Learning Models
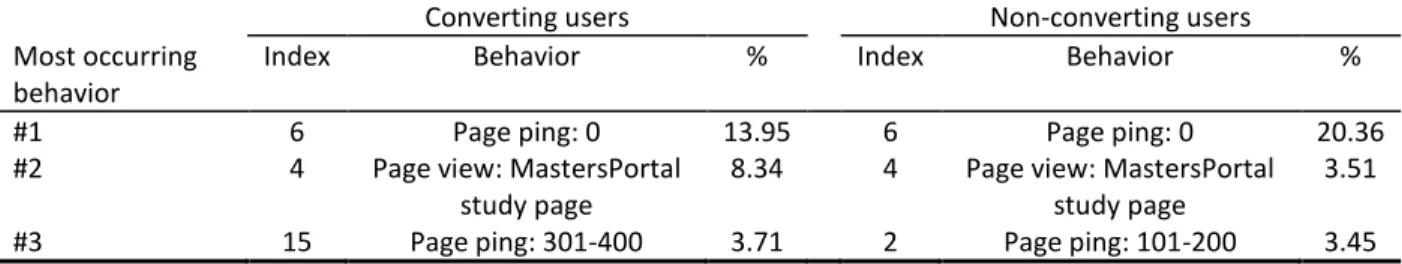
30 Table 11
Descriptive statistics on the top 3 most occurring user behaviors
Converting users Non-converting users
Most occurring behavior
Index Behavior % Index Behavior %
#1 6 Page ping: 0 13.95 6 Page ping: 0 20.36
#2 4 Page view: MastersPortal
study page
8.34 4 Page view: MastersPortal
study page
3.51
#3 15 Page ping: 301-400 3.71 2 Page ping: 101-200 3.45
4.1.3 Correlations
Figure 9 represents an overview of the correlations between the numerical features used for the traditional machine learning models. Because the data is not normally distributed, Spearman’s rho has been used.
The highest positive correlations are between the number of page pings and the number of interactions (r = .89) and between the number of page views and the number of interactions (r = .79). This is
expected as the number of interactions is simply the sum of the number of page views and the number of page pings. Additionally, there also is a high positive correlation between the number of study pages viewed and the number of total interactions (r = .71). The highest negative correlation is between the number of study option pages visited and the number of home pages visited (r = -.17). There also is a negative correlation between the personality test variable and the target variable (r = -.16). As mentioned before the page that host the personality test leads to a ‘dead-end’.
31