i
EXAMINATION COMMITTEE: S. McKenney
R.L.G. Lemmens University of Twente
FACULTY OF BEHAVIOURAL, MANAGEMENT & SOCIAL SCIENCES MASTER EDUCATIONAL SCIENCE AND TECHNOLOGY
Master thesis
ENGAGING WITH A LIVING TEXTBOOK:
An exploratory study on the way in which students and teachers interact with and perceive a web based concept map visualization tool.
Niall Walsh
2
SUMMARY
The ability to recognise the relationships between concepts is a crucial aspect of meaningful learning. However, facilitating students to identify and understand these cross connections can be a challenge for teachers in higher education as concepts are often dealt with in isolation. Expert generated concept maps have been shown to help students in forging connections by acting as scaffolds for cognitive processing. The Geo-Information Science (ITC) faculty at the University of Twente are prototyping a Living Textbook which combines an online knowledge repository with an interactive map visualizing the relationships between concepts. The pedagogical beliefs of teachers play an important role in whether or not such a tool is effectively integrated into the learning process. This study explored how teachers conceptualize the pedagogical value of visualizations, how students engage with these visualizations in their learning journey, and what elements of the current prototype of the Living Textbook concept map are usable and which are not. ITC students and teachers were interviewed about their experience with the concept map tool, and a think aloud walkthrough and usability test was conducted with students. The findings show that both students and teachers perceive the tool’s capacity for highlighting conceptual connections as a valuable learning aid, but are intimidated by the cluttered layout of the concept map. Faculty emphasize the tool’s value in helping to order and structure course content, and stress the importance of introducing hierarchy to make its navigation more effective. Two sets of design guidelines for the tool are proposed, one related to the support needed by students (mitigate cognitive overload, prioritize certain content and increase content depth, introduce detail on demand, improve ease of access) and another related to what teachers need (increase ability to manipulate tool, track frequently visited concepts, enable student teacher interaction, reduce effort to update content).
3
TABLE OF CONTENTS
Acknowledgements 5
1. Concept maps as key to unlocking connected thinking 6
1.1 Background of the study 6
1.2 Context 7
1.3 Problem Statement 8
1.4 Goals of the study 9
2. Conceptual Framework 11
2.1 Factors influencing the use of digital learning tools 11
2.2 Student engagement with expert generated visualizations 12
2.2.1 Behavioural Engagement 12
2.2.2 Cognitive Engagement 13
2.2.3 Emotional Engagement 13
2.3 Usability of web-based educational software 14
2.3.1 Screen Layout 14
2.3.2 Navigation 14
2.3.3 Interactivity 14
2.3.4 Content 15
2.3.5 Accessibility 15
2.4 Teacher pedagogical beliefs about value of concept map tools 16
2.4.1 Beliefs about value for teachers 16
2.4.2 Beliefs about value for students 17
2.4.3 Institutional influence on teacher beliefs 17
2.5 Research questions 18
3. Research Methods 19
3.1 Research design 19
3.2 Participants 20
3.3 Procedure 20
3.4 Instrumentation 22
3.4.1 Semi structured interview schema for students 22
3.4.2 Concurrent and retrospective think aloud protocol 22
3.4.3 Semi structured interview schema for teachers 23
3.5 Data preparation 23
3.6 Data analysis 24
4. Findings 27
4.1 Student engagement 27
4.1.1 Behavioural engagement 27
4
4.1.3 Emotional engagement 30
4.2 Usability 31
4.2.1 Perceived value 31
4.2.2 Usability issues & suggested improvements 34
4.3 Teacher pedagogical beliefs 38
4.3.1 Beliefs about how to promote student engagement 38
4.3.2 Institutional influences on teacher beliefs 39
4.3.3 Beliefs about tool's value for students 41
4.3.4 Beliefs about tool's value for teachers 43
5. Discussion and Conclusions 46
5.1 Conclusions 46
5.1.1 RQ1: Student Engagement with tool 46
5.1.2 RQ2: Usability of tool 46
5.1.3 RQ3: Teacher beliefs about tool 47
5.1.4 Main research question 47
5.2 Discussion of findngs 47
5.2.1 Student engagement with concept map 48
5.2.2 Usability of the tool 49
5.2.3 Teacher’s pedagogical beliefs 51
5.3 Theoretical implications 52
5.4 Limitations of study and directions for future research 53
5.5 Design Recommendations for tool 55
5.6 Closing remarks 58
6. References 60
7. Appendices 66
7.1 Appendix A: Semi structured schema for student interviews 66
7.2 Appendix B: Think aloud protocol 67
7.3 Appendix C: Semi-structured schema for teacher interviews 69
5
ACKNOWLEDGEMENTS
This thesis is written as the final element in my completion of the MSc program in Educational Science and Technology at the University of Twente, and represents the end of a journey of almost two years. Along the way, there have been many people who have played an integral role in this research and in my development, and there are some in particular that I want to make special mention of.
First of all, I want to thank all those who took part in this study, and who gave of their time to voluntarily participate in the interviews and usability tests. These students and teachers have a multitude of other commitments and pressures drawing on their time, but without their willingness to give of themselves, this research would not have been possible in its current guise.
Alongside this, I want to thank both of my supervisors for all of their guidance and help over the past twelve months or so since this project was initiated. My first supervisor, Dr. Susan McKenny, has remained patient with me throughout this process, and provided remarkably meticulous feedback often at very short notice. For this, and for her unending supply of optimism and faith in my ability to get there in the end, I am very grateful. Also I would like to thank my second supervisor Dr. Rob Lemmens, who has always been very open to new directions for this project, and whose passion for this area has consistently motivated me.
6
1. CONCEPT MAPS AS KEY TO UNLOCKING CONNECTED THINKING
The ability to recognise relationships is a key aspect of meaningful learning, and a key component of expert behaviour in a professional context. Teachers often struggle to facilitate students to see such interconnections in their classes as concepts are taught in isolation, but online knowledge repositories combined with digital concept maps represent a possible solution. While expert generated concept maps have been shown to have a positive effect on learning and retention, they run the risk of causing the viewer to disengage if the information visualized is too cluttered or overbearing. The present study explores how students engage with a prototype of such a tool developed by the Geo-Information Science faculty at the University of Twente. The data gathered will reveal not only to the ways in which students interact with the tool, but will also explore the critical role that teacher beliefs and perceptions play in the adoption of such educational software. The study will use the insights gleaned to generate a set of design guidelines that can improve how the tool augments the teaching and learning experience.
1.1 BACKGROUND OF THE STUDY
Meaningful learning takes place when the learner assimilates new concepts and propositions into existing concept and propositional frameworks (Ausubel, 1968). This type of learning is critical as it allows students to build the interconnected cognitive schemas necessary for problem solving (Mayer, 2002). Teachers often struggle to facilitate this kind of interconnected learning due to the fact that traditional education breaks wholes into parts, focusing separately on each section, and learners often experience difficulty conceptualizing the big picture (Wang, Peng, Cheng, Zhou & Liu, 2011) as a result.
This is out of sync with many contemporary theories about how people learn and the highly interconnected cognitive schemas that experts need (Moore, 2013). Novak (2002) emphasizes that students must engage in meaningful learning activities to form conceptual understanding. and proposes concept maps as a tool to help achieve this. Concept mapping as a tool has been defined as the process of visually linking two or more concepts with propositions to form statements from which meaning can be induced (Novak & Cañas, 2008). Initially, concept mapping was developed primarily as a medium to help learners visualize what they did and did not know (Novak & Cañas, 2008) but concept knowledge maps generated by experts have also been shown to have a positive effect on learning and retention (Nesbit & Adescope, 2006). These expert generated learning aids have the capacity to act as advance organizers for students (Moore, 2015), thus enabling them to more easily develop the cognitive schemas needed to develop conceptual understanding of complex curriculum (Moore, 2013).
7
see connections between concepts (Moore, 2013). There has also been research which highlights that concept map tools can specifically benefit students with low verbal ability (O’Donnell, Dansereau & Hall, 2002) as they provide a more straightforward way to access complex knowledge.
With the growth in digital textbooks across a wide range of subject domains in higher education (Reynolds, 2011), there is an opportunity for such web based concept map tools to be integrated with online course wide knowledge repositories and offer an alternative to the traditional textbook approach. However, any single concept map that covers a cognitive schema as complex as that involved in an entire third level course runs the risk of becoming unmanageable for students to comprehend, display or manipulate (Cañas et al, 2005). This can then lead to a phenomenon known as ‘map shock’ (Blankenship
& Dansereau, 2000), a cognitive and affective reaction that a learner has to the presentation of an overly large and complex concept map which leads to incomplete processing (Moore, 2013). Tergan et al. (2006) highlight that such cognitive overload and navigational disorientation can be mediated by effective visualizations which can be used to unburden cognitive processing and memory functions.
1.2 CONTEXT
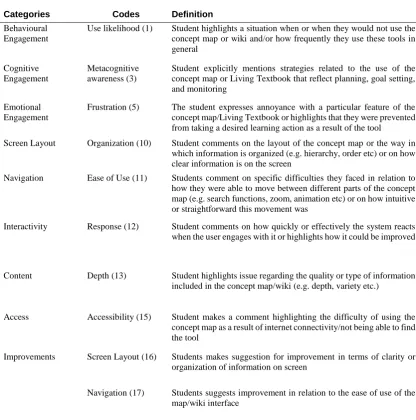
8
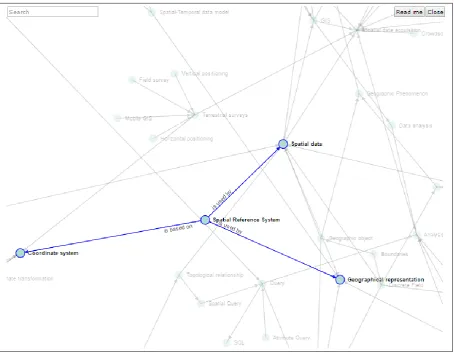
Figure 1: Example of the Living Textbook concept map interface
The present study will be carried out in the context of the Living Textbook project. The content for the concept map has been created in-house at ITC, with individual faculty members providing the ontology for their respective pieces of the core curriculum module. An ontology is a set of concepts and categories in a subject area or domain that shows their properties and the relations between them. The Living Textbook team have previously trialled the wiki only version of the tool with students in the Distance Education (DE) core curriculum module and are seeking now to gain feedback on how students interact with the concept map visualization and navigation tool. The team are aiming to further improve their prototype in order to better enable students in the ITC department to develop interconnected conceptual knowledge. The present study is aiming to help evaluate the tool’s potential capacity from both a student and a teacher perspective.
1.3 PROBLEM STATEMENT
9
visualizations such as these are not something many students are familiar with. Engagement is a critical construct to explore in relation to any such prototype of educational software, given it has shown to lead to student learning and retention and can be indirectly associated with student outcomes (Umbach & Wawrzynski, 2005). While exploring the ways in which students engage with the tool is important, it is critical to also gain their perspective on the elements of the tool that are usable, and those that are not. Understanding the reasons behind this is crucial if developers wish to develop educational software that is efficient, effective and satisfactory for the user (Carvalho, 2001). With specific relation to expert generated concept map tools, it is important to explore how students respond to course wide visualizations in the tool, as there is the danger that such visualizations can overwhelm the user as a result of their complexity (Cañas et al, 2005).
Given the critical role that teachers play in engaging students (Umbach & Wawrzynski, 2005; Bryson & Hand, 2007), any educational software that is being designed to meet the needs of the diverse student body must also take into account the teacher perspectives on the pedagogical value and efficacy of such tools. There have been claims that teachers can benefit directly from the process of generating content for adaptive concept map tools as they can enable instructors to spot gaps in their course content and ensure greater flow between courses (Moore, Pierce & Williams, 2012). Alongside this, having teachers refer to the tool during instruction can help students to see the big picture and motivate them to learn topics (Schwab et al., 2017). However, teacher beliefs have an impact on the pedagogy they practice (Ertmer, 2005) and understanding these beliefs plays a vital role in determining the ways in which teachers are likely to adopt and encourage adoption of new technologies. Thus, it is necessary to explore the beliefs that teacher’s hold in relation to the potential use of the current prototype of the Living Textbook concept map tool.
1.4 GOALS OF THE STUDY
10
teaching practice, and thus the present study also seeks to understand in more detail the pedagogical beliefs that faculty hold about the value of expert generated concept map tools for both teachers and students. The data gained from this study will offer insights more broadly into the nature of student engagement with web based visualizations and the kinds of beliefs that teacher’s hold about web based concept map tools. This will be of value to future researchers seeking to understand how to better support teachers and students in visualizing and developing interconnected knowledge.
11
2.
CONCEPTUAL FRAMEWORK
The goal of this study is to explore how teachers and students engage with and perceive course wide digital concept map visualizations. The factors which play a role in the adoption and integration of these tools into the teaching and learning process will be discussed in this chapter. Engagement has been indirectly associated with learning outcomes, and thus it is important to explore how students are cognitively, behaviourally and emotionally engaged with the Living Textbook concept map. Alongside engagement, it is also critical to explore the usability of any web based educational software, as if the tool is not easy to use and navigate it can hinder engagement. Course wide concept maps also have the potential to better enable teachers to plan and structure their courses, and to spot content gaps or inconsistencies. The degree to which teachers adopt such tools is connected with their pedagogical beliefs, and thus it is important to explore these beliefs and the institutional factors which may influence them. Faculty members’ perspective on the pedagogical value of the digital concept map is vital to explore as teachers have the ability to increase the propensity with which students engage with such tools.
2.1 FACTORS INFLUENCING THE USE OF DIGITAL LEARNING TOOLS
Despite the increased availability and popularity of digital learning tools, there are still numerous barriers to the integration of such instructional technology into higher education. Some of these factors include the effort faculty are willing to invest, the degree of technology satisfaction expressed by students, and the competency of the students themselves (Surry, Ensminger, & Haab, 2005). The degree of technology satisfaction students express is informed to a large degree by the value they perceive in such tools, and the usability of the tool determines whether users can easily or efficiently meet their learning goals and needs (Koohang, 2004). It is of critical importance to study usability in order to aid developers and designers to better understand how students perceive and react to different elements of web based learning (Koohang & Durante, 2003). Usability has an influence on student engagement, and well-designed web based learning technology has been shown to have a positive impact on student engagement (Chen, Lambert & Guidry, 2010). However, it is also important to understand how students interact with and perceive such web based learning tools and explore in more depth how and why students engage with them.
12
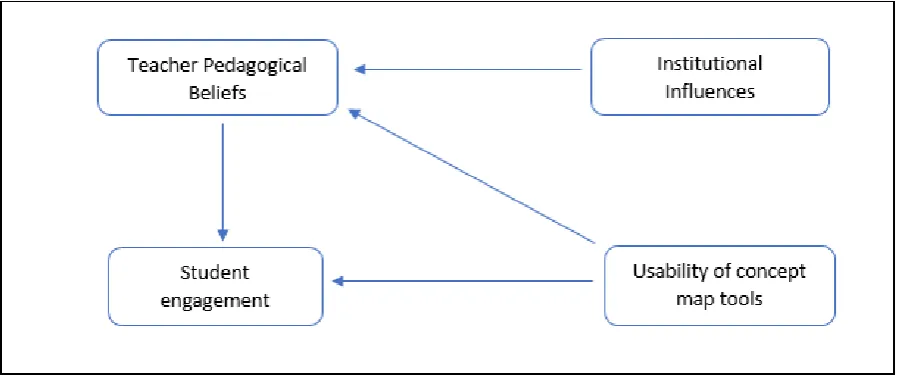
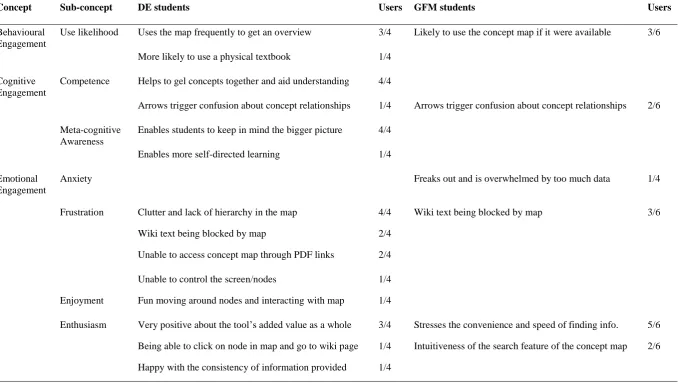
[image:12.595.73.529.124.312.2]how students and teachers interact with web based learning tools, and each of these constructs will be elaborated in the following sections.
Figure 2: Theoretical model of how students and teachers interact with digital learning tools
2.2 STUDENT ENGAGEMENT WITH EXPERT GENERATED VISUALIZATIONS
Understanding the role that student engagement plays in higher education is currently a vital research issue, with growing evidence of the key role it can play in achievement and learning (Kahu, 2013). In the most prevalent higher education surveys on engagement (Kuh, 2003; Coates, 2006) the construct is defined as the degree of student’s involvement with and time invested in activities and conditions likely to generate high quality and meaningful learning. More attention needs to be paid though towards the reasons why students engage with specific forms of digital technologies during their studies (Henderson, Selwyn & Aston, 2017) as well as to the ways in which students use these technologies in the learning process. Interactive web based learning tools can amplify, enhance and guide the cognitive processes of learners (Agostinho, Bennett, Lockyer & Harper, 2004) but in order to understand the way that students interact with these tools, it is important to study the meta construct of engagement. Most researchers agree that this meta-construct is comprised of emotional, cognitive and behavioural elements that adequately capture the psychological state of engagement (Fredricks, Blumenfeld & Paris, 2004). The focus of the present study is on student engagement in technology mediated learning experiences, and in this context these three facets of engagement are elaborated upon in detail below.
2.2.1 Behavioural Engagement
13
outcomes, and can be measured by outlining the active responses that students make to learning tasks (Chapman, 2003) and in the context of this study, the Living Textbook concept map tool. Kahn (1990) highlights that when behaviourally involved, students show evidence of high levels of cognitive awareness, and are emotionally invested in the activity. Thus these two constructs are of critical importance to the present study and are described in more detail below.
2.2.2 Cognitive Engagement
Cognitive engagement can be categorized as the focused effort learners give to effectively understand the content conveyed, including self-regulation, deep learning and metacognitive behaviour (Fredericks et al., 2004). Cognitive engagement is a critical construct to explore for those seeking to design and develop digital learning environments as it is central to the student’s relationship with the learning design of the tasks and activities in these environments (Wiseman, Kennedy & Lodge, 2016). This construct is evidenced by the way in which students feel about themselves and their work, their skills, and the strategies they employ to master their work (Metallidou & Viachou, 2007) and is consistent with theories proposing the fundamental needs of autonomy and competence (e.g., Connell & Wellborn, 1991). Given the purpose of the Living Textbook concept map tool is to help students see the interconnections between concepts, student’s self-perceptions of competence can be evidenced by statements which highlight their cognitive improvement as a result of their use of the tool. Pintrich & De Groot (1990) associated engagement levels of students with their use of metacognitive strategies to monitor and guide their learning process, and thus this sub construct will also be explored in this study. This metacognitive awareness can be measured by how students perceive the concept map tool has helped them to more effectively monitor and strategically manage their own learning. It is also important to understand how students perceive their own level of involvement with the tool, and the degree to which they have been made more cognitively aware by their use of it.
2.2.3 Emotional Engagement
Emotional engagement can be defined as the feelings students have about their learning experience (Fredericks et al., 2004). There is an emotional intensity attached to the experience of learning that is often underappreciated (Askham, 2008) and this is important to examine because this can often have an impact on the cognitive and behavioural elements of engagement (Kahu, 2013) already outlined above.
14
(Valiente et. al, 2012). Anxiety can be recognised as a state of worry, concern or unease, and specifically in the context of a digital learning tool can be evidenced by students expressing that they are overwhelmed or intimidated by certain features of the interface. On the other hand, frustration is a less intense emotion and is visible when a student expresses annoyance or irritation with a particular aspect of their learning experience, such as the time it takes for a page to load or being prevented from navigating the interface in a particular way. Enthusiasm refers to interest or excitement the learner expresses in relation to their learning experience and in this case it is an important emotion to explore because it highlights the interest that students have towards the learning experience (Trowler, 2010). Students enthusiasm in relation to a digital learning tool could be a positive expression of interest in a particular feature of the tool or positive comments in relation to the tool’s benefit to them. Enjoyment is a slightly different case in that it can be seen by the student taking pleasure in the act of learning, and in the context of a digital learning tool this could be seen by the student having fun interacting with the tool. It is important for the present study to explore the degree of motivational intensity of these emotions users experience as they engage with the concept map, because this can aid in understanding the positive or negative reactions provoked by interacting with digital learning tools.
2.3 USABILITY OF WEB BASED EDUCATIONAL SOFTWARE
In order to gain an understanding of students’ engagement with such a concept map visualization, it is vital to also explore the usability of such a tool. While studies have emphasized the need to move beyond usability to design for more engaging experiences (Hassenzahl & Tractinsky, 2006), the premise still stands that if a tool is not usable, students will not be able to engage with it effectively. The concept of usability encompasses such attributes as learnability, efficiency, flexibility and user satisfaction (Nielsen, 1994) and explores the degree to which something is fit or ready to be used. Shiratuddin, Hassan & Landoni (2003) compare the web usability factors proposed by Nielsen, IBM and Microsoft and outline screen layout, accessibility, navigation, interactivity and content as key factors to explore. The relevance and operationalization of these factors is outlined in the subsequent sub sections below.
2.3.1 Screen Layout
15 2.3.2 Navigation
Good navigation will help users find what they need easily and quickly especially for large amounts of information (Shiratuddin et al., 2003). Any technology based support needs to be easy to use (Dale & Lane, 2007) and effective navigation plays a critical part in this. Good navigation is evidenced by how easy it is for users to search for information and how smoothly and quickly they are able to transition from one element of the interface to another. Nielsen & Loranger (2006) emphasise that best practice in navigation is to make it as efficient as possible, and to make main topics and icons static and appear at once in order to allow people to skim quickly between their choices.
2.3.3 Interactivity
Students should be provided with interactivity elements such as giving response, feedback, and searching for information (Shiratuddin et al., 2003). Providing greater user control is identified by IBM as one of the elements that can enhance usability, and adding interactive features is one way in which website designers are able to do this. While multimedia elements such as animation and interactive features can enhance the user experience, it is important to evaluate whether these are integrated properly so that they do not adversely affect how which users interact with the web based system (Nielsen, 2000). An appropriate level of interactivity will eschew designer controlled action in favour of true user interaction that does not take up too much time or resources (Nielsen & Loranger, 2006). Alongside this, the response time of interactive elements is a critical element to evaluate with any web based application, as slow response time has a direct effect on user satisfaction (Hoxmeier & DiCesare, 2000).
2.3.4 Content
In order for students to perceive value in any web based learning tool, the content provided should be useful, relevant, and up-to-date (Shiratuddin, et al., 2003). Web designers should also ensure that they employ appropriate depth and breadth in the content that they provide, and any multimedia content that is used is appropriate to the context (Venkatesh & Ramesh, 2002). Good content design is evidenced by sites that do not overwhelm the reader with too much information, but still provide the key pieces of knowledge required that are relevant for the student in their learning process. Nielsen & Loranger (2006) emphasise that good content design avoids unscannable text and material that is too dense for the reader to quickly grasp at first glance.
2.3.5 Accessibility
16
in both the developing and the developed world. The proper use of text, having effective cross platform design and the speed of page loading are good indicators of how accessible a website is to users with different levels of internet connectivity (Nielsen, 2000).
For the purposes of the present study, the above usability factors will be evaluated, given how appropriate they are for an interactive navigational tool such as the Living Textbook concept map. Alongside this, the perceived value of the tool will be explored from both the teacher and the student perspective as much of the literature pertaining to student perceptions on learning in web based environments focuses on the perceived value of the task (Venkatesh et al., 2016). Sánchez & Hueros (2010) define perceived value this as the degree to which people believe a tool can enhance their performance, and they emphasize that this can be an extrinsic motivation to the user. Mayes & Fowler (1999) have also highlighted the importance of adopting the constructivist perspective when specifically discussing usability of educational software, and emphasize that learning is a by-product of understanding rather than an activity that can be supported directly. Thus it is necessary in the course of this research project to also explore how students perceive these tools have impacted their understanding, and how each of the components of the tool may have contributed to or impeded that learning (Storey et al., 2002).
2.4 TEACHER PEDAGOGICAL BELIEFS ABOUT VALUE OF CONCEPT MAP TOOLS
Aside from the usability of such tools for students, it is also important to explore their pedagogical value from the perspective of teachers. Moore (2013) highlights that course-wide concept maps have the potential to be useful both as tools for teachers in instructional design as well as in the learning process for students. However, teacher beliefs play a key role in whether educational technologies such as these are adopted (Ertmer, 2005), and thus it is critical to explore the nature of their beliefs in relation to the pedagogical value of the tool for both teachers and students. These beliefs are formed by many years of experience, from life as a pupil in the classroom (Keys, 2007) to the variety of professional context teachers encounter (Prestridge, 2012) and understanding these beliefs is a crucial element in understanding how and why teachers make instructional design decisions regarding technology. Much of the literature regarding pedagogical beliefs focuses on teachers in K-12 education although there is evidence to show that college teacher’s educational beliefs are a strong influence on how they enact their professional roles (Stark, 2000).
2.4.1 Beliefs about tool’s value for teachers
17
relationships, the course instructor can gain insights not only into the order in which content should be presented in their course and any gaps that may reside there, but also into helping to ensure that each interconnected course flows into the next (Moore, 2012). The teacher’s perceptions in relation to a digital concept map tool’s value can be evidenced by the different ways that they outline that they would be likely to use the tool, and the added value or concerns they perceive as accruing from its use to them in their teaching. For example, it must be noted that the construction of such complex and interconnected concept maps can be seen as a time-consuming process for teachers (Moore, 2012). This study will explore the beliefs that teachers hold regarding the potential of such a tool in both the planning and instruction process.
2.4.2 Beliefs about tool’s value for students
Alongside the potential use of these maps as a planning tool for teachers, it is also important to understand the perspective teachers have on their potential benefit for students in the learning process. Teacher beliefs have an impact on the way in which they integrate technology into the classroom (Kim, Kim, Lee, Spector & DeMeester, 2013), and thus can potentially impact on the way in which students adopt new technology. Schwab et al. (2017) highlight numerous ways that teachers could increase the adoption of course wide concept map tools among students, such as referring to the ‘big picture’ during classroom sessions, or highlighting and digitally annotating certain parts of the map so attention could be drawn to sets of concepts of current importance. Teacher beliefs in relation to the value the tool holds for students can be seen by the different benefits they see in its use and the problems they see it solving. These beliefs may also extend to concerns that teachers have about the problems they believe students may encounter with specific features of the tool in their use of it. These beliefs are important to explore because teachers can play a key role in whether students engage with these concept maps.
2.4.3 Institutional influences on teacher beliefs
18
teachers have on the structural challenges they perceive standing in the way of teaching best practice, and in the opportunities afforded to them by the institution that they believe have impacted the way in which they approach teaching.
2.5 RESEARCH QUESTIONS
Overall, research describes the importance of engagement in the higher education context, as well as the potential that resides in expert generated concept maps as instructional and navigational tools. In this study, student engagement will therefore be studied in relation to one prototype of an expert generated concept map visualization tool, alongside exploring the ways in which teachers perceive the pedagogical value of such a concept map. The insights gleaned from the above study will be used to create recommendations specific to the use of digital concept maps as a means of developing interconnected knowledge. To help achieve this aim, the following research question and sub-questions are drawn:
How do students and teachers in higher education engage with and perceive the web based ‘Living Textbook’ concept map tool?
• What is the nature of student engagement when interacting with web based expert generated concept map tools?
• In what ways is the current prototype of the Living Textbook concept map tool usable or not and why?
19
3. RESEARCH METHODS
This chapter will outline the research methods designed to meet the goals delineated in the previous section of this document. The research adopted a qualitative case study model, deemed appropriate to gather in depth information regarding the Living Textbook concept map from student and teacher perspectives. Semi-structured interviews were taken with four randomly purposefully sampled MSc students to understand how they engaged with the tool, and a think aloud study was conducted to evaluate the usability of the tool with six voluntarily participating diploma students. Six teachers voluntarily participated in the study also, and their perspectives were gathered using semi structured interviews. All of this information was then transcribed, coded and a thematic analysis was performed to identify recurring patterns in the data.
3.1 RESEARCH DESIGN
Given the central goal of this research was to determine usability of and engagement with the Living Textbook concept map tool, a descriptive single case study design was adopted. Kahu (2013) highlights that engagement is a dynamic and situational construct, and thus in depth qualitative research methods are more useful for understanding its complexity. There are numerous definitions for a case study but Bromley (1990) defines it as a “systematic inquiry into an event or a set of related events which aims to describe and explain the phenomenon of interest” (p.302). Yin (2014) has emphasized the appropriateness of utilizing case studies to conduct evaluation research and also explicitly states that they are most pertinent to use “when the intervention being evaluated has no clear, single set of outcomes” (Yin, 1994, p. 15). Given that another goal of this exploratory research was to glean insights regarding teacher’s beliefs and their perceptions of the pedagogical value of this specific tool, this case study involved two sets of respondents (teachers and students). Multiple case methodology has been employed previously to explore how students interact with interactive web based concept maps (Moore, 2015) but there have not been any case studies on interactive concept map technology that focus on both teachers and students. Given that both are key stakeholders in the educative process, it was determined that including both within the scope of the case would provide a more rounded perspective on how users engage with and perceive such concept map tools. While participants also had interactions with the Living Textbook wiki tool as part of their course environment, this was not considered a part of the case explored. Any questions asked in relation to the Living Textbook tool as a whole or the wiki element were included to provide context to the student’s use of the concept map tool. To ensure that rich data would be collected that would provide valid feedback on the tools usability and value, only participants studying or teaching Geo-Information Science were selected.
20
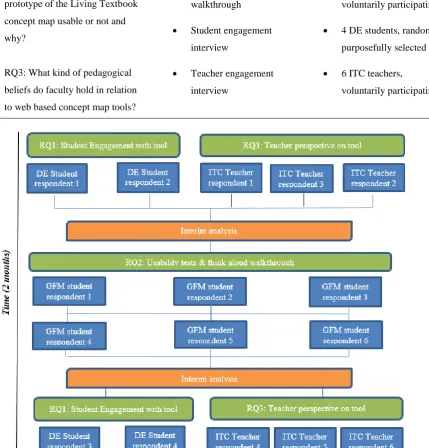
The alignment between the research questions outlined in the previous section and data collection methods proposed is included below in Table 1. The data collection process is further visualised in relation to the key research themes in Figure 3.
Table 1
Alignment between research questions and data collection methods
Research Questions Data Collection Method Respondent Information RQ1: What is the nature of student
engagement when interacting with web based expert generated concept map tools?
• Student engagement interview
• 4 DE students, random purposefully selected • Think aloud
walkthrough
• 6 GFM students, voluntarily participating
RQ2: In what ways is the current prototype of the Living Textbook concept map usable or not and why?
• Think aloud walkthrough
• 6 GFM students, voluntarily participating
• Student engagement interview
• 4 DE students, random purposefully selected
RQ3: What kind of pedagogical beliefs do faculty hold in relation to web based concept map tools?
• Teacher engagement interview
• 6 ITC teachers,
[image:20.595.72.502.290.739.2]voluntarily participating
21 3.2 PARTICIPANTS
Students and teachers from the University of Twente’s ITC department were asked to participate in this research. As the focus was on a particular group who are directly involved with the Living Textbook tool, this concerned purposive sampling (Devers & Frankel, 2000). A prototype of the Living Textbook tool had recently been piloted in a DE core MSc module of Geo-Informatics and it has been argued that these kinds of typical cases are often the most likely to have the greatest benefit from the application of purposeful sampling (Miles & Huberman, 1994, p. 34). Four students taking part in the DE core module participated (n=4) with a mixture of educational experience, with some students having attained PHD’s and others only Bachelor Degrees, but most students had substantial experience working with GIS software. All the DE students interviewed had high competency in the English language. Alongside this, six faculty members who were teaching part of the DE module (n=6) and had contributed to the content of the concept map were interviewed. These teachers had a range of experience teaching in the ITC faculty, with some teachers having just begun teaching in the department two years previous and others having been involved with the ITC department for the last 15 years.
In addition to these participants, another six students from the face to face Geo-Informatics Diploma Program (GFM) participated in the think aloud usability tests (n=6). These students were a lower educational level than those taking the DE course but were chosen because they have no prior experience using the Living Textbook tool but still enough knowledge of Geo-Information science to navigate the usability test effectively. However, the students interviewed all came from an international background and did not have a high level of competency with English as it was not their first language. As a result, it is still important to note that there was expected to be a significant difference in the subject domain knowledge between the MSc students and those taking part in the Diploma course and any data collected was interpreted keeping this distinction in mind. All teachers and students signed a form of consent prior to participating in this research.
3.3 PROCEDURE
As ethical concerns play a role the ethical committee had to first approve the research and as such an ethical form was submitted and approved in advance by the ethical committee of the University of Twente. Due to the researcher’s location, the semi-structured interviews with most teachers and all students took place via Skype. The researcher briefed the participant on the nature of the research before recording the audio of the interview, which took approximately 30 minutes.
22
that no questions were to be asked unless a participant was very unsure about how to proceed. During the tasks, which took participants between 30 and 45 minutes to complete, the researcher observed the participant and took notes on the way in which they used the tool and any difficulties they encountered. At the end of the test, the researcher conducted a retrospective think aloud interview (lasting approximately 15 minutes) focusing on highlighted moments from the individual participants’ test. The researcher recorded audio throughout and the computer screen which the participants used was also recorded. These interviews took place when these students were in the second and third week of their GFM course module.
3.4 INSTRUMENTATION
In order to explore the ways in which students engaged with the Living Textbook tool, the self-report measure of the semi-structured interview was employed. Alongside this, to collect more authentic data regarding the specific ways in which students utilize the tool and the issues they encounter, a think aloud protocol was developed for the usability tests. A separate semi-structured interview instrument for teachers was developed in order to probe the perspective of faculty within the ITC with regard to the pedagogical value of the Living Textbook tool. The researcher, who did not have any domain specific knowledge of Geo-Information Science, executed all of this. Below, more detailed explanations are given with quotes included to exemplify the different elements of the instruments.
3.4.1 Semi-structured interview schema for students
The schema developed for students (Appendix A) focused on eliciting insights regarding how students are engaging with the Living Textbook tool (“How have you engaged with the Living Textbook so far?”) as well as trying to capture what their initial reactions were to the tool (When you opened up the concept map for the first time, what was your reaction?”). Alongside this, a series of probes were developed
relating to clarification (“Can you give an example of that, I think I know what you are talking about, but if you could clarify a bit?”) as well as elaboration (“Why do you think that would benefit you so
much?”). In order to glean further insights regarding what students need in relation to their learning experience, questions were also added to the schema relating to their perceptions on the learning environment (“How has the experience of doing distance learning been different from the face to face experiences of education you have had?”) and features they would like to see added to the tool (“What
suggestions for additional functionality could the WIKI/Concept Map provide? Why would this feature
appeal to you?”).
3.4.2 Concurrent and retrospective think aloud protocol
23
instructions for the students in how to effectively participate (“We would really like you to think aloud, that you say what you are thinking, as otherwise we cannot really use the test usefully”). An additional
protocol was developed for the retrospective think aloud interview which consisted of questions triggered by observations of the researcher (“The first thing you did was moving the nodes itself, why do you think that was the first thing that you did?”) alongside pre-defined questions related to each of
the tasks (“How was your experience of moving between the wiki and the concept map in Task 2?”) This retrospective think aloud protocol elements were included to address the likelihood that participants would not feel comfortable thinking aloud while engaging with the task, and this had the additional benefit of freeing participants from the extra cognitive load of being compelled to think aloud during a complex task (Van den Haak, de Jong & jan Schellens, 2003)
3.4.3 Semi-structured interview schema for teachers
The interview schema developed for teachers (Appendix C) explored their conceptions of the teaching and learning process(“How would you describe your own philosophy of teaching/education?”) in order to provide insight on the reasons behind their perspective relating to the value of the Living Textbook tool. To help place these conceptions of teaching and learning further in context questions were included that explored some of the institutional factors that influence teachers such as medium, (what do you think are the additional challenges, constraints or opportunities when you teach in a distance education
context?) and time (“So what would be the advantages or disadvantages as far as you are concerned,
having it in such an intensive burst, these modules?”). The schema also focused on directly investigating
their perceptions of the pedagogical value of the Living Textbook tool (“How do you think the Living Textbook could help teachers improve the way in which they teach?”) which was important to explore
given the key role teachers play in the creation and maintenance of such expert generated visualizations. Alongside this, the third part of the interview schema explored ways in which teachers believed the tool could be redesigned to better meet the needs of students (“How could the visualizations be made more effective for the next iteration of the tool?”) and teachers (“so from a teacher perspective if you were to
add additional features to the concept map, what do you think you would add that could further support
you to teach more effectively?”).
3.5 DATA PREPARATION
24
audio recordings of the test to track what was on the participants screen at the time of the utterance. In total 16 interviews, lasting 12 hours in all, were transcribed, covering 85 transcript pages.
3.6 DATA ANALYSIS
The final data set consisted of audio recordings of the Skype interviews with teachers and students, as well as the audio recordings of the concurrent think aloud and retrospective think aloud interviews. This data was used to help explore and interpret how students and teachers perceived and engaged with the web based concept map visualization element of the Living Textbook tool. In order to reach conclusions about this, a codebook was developed and then the data was first coded by hand and then interpreted by thematic analysis. The process of data reduction, data display and conclusion was adhered to throughout this process (Miles & Huberman, 1994).
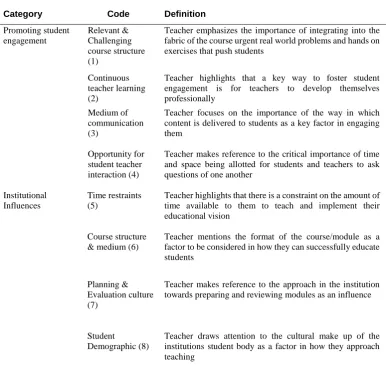
Two separate codebooks were developed for the different datasets, with one focusing on the teacher perspective on the tool, and the other on usability and student engagement with the tool. A set of four categories and 17 codes were developed inductively for the teacher perspective, after reading through the interviews multiple times. On the other hand, the 10 categories and 20 codes for the student interviews were mainly deductive, drawing heavily from Fredericks et al.’s (2004) theory on student engagement as well as from website usability heuristic literature (Nielsen, 1994; Hassan & Li, 2001). Even though the majority of codes were deductive, there were still some emergent codes that were developed during the process of coding the transcripts of this data set. A selection of categories, code definitions and sample data are outlined in Table 2 and Table 3 below.
To first secure reliability, a segment of the data was coded and then a second rater coded the same 5% of the data and Cohen’s Kappa was then computed, measuring the inter-rater conformity by two independent coders (Cohen, 1960). At first there was some discrepancy between the coders, with an unreliable Cohen’s Kappa rating of .59 but after a discussion with the other independent rater, specific issues were highlighted in relation to three or four codes that had been causing confusion and two that were not mutually exclusive. The researcher then reworked the respective codebooks, merging two codes together, deleting another, and clarifying the definitions of a number of other codes. The researcher then coded another segment of the data, and different interview segments were sent to the independent rater, and there was a much more reliable Cohen’s Kappa rating of .81.
25
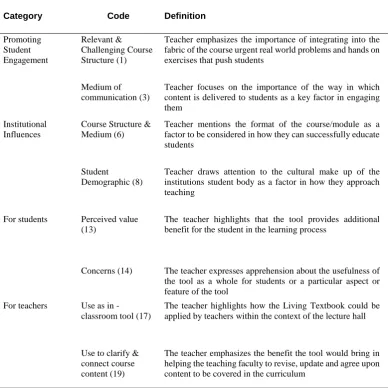
Table 2.
Sample inductive codes and data on teacher perceptions of the pedagogical value of the Living Textbook tool
Category Code Definition Example
Promoting Student Engagement Relevant & Challenging Course Structure (1)
Teacher emphasizes the importance of integrating into the fabric of the course urgent real world problems and hands on exercises that push students
“they really need this because otherwise, because they will come with their own real life problems and if a lecturer like me stays somewhere on top and doesn’t give any examples then they will feel like lost because they need to be practical as well”
Medium of communication (3)
Teacher focuses on the importance of the way in which content is delivered to students as a key factor in engaging them
“ I explain something and then say ‘ but what if we had this situation, what do you think would happen’ and then if the group is dynamic you can even have a mini debate for one or two minutes and then you can continue.”
Institutional Influences
Course Structure & Medium (6)
Teacher mentions the format of the course/module as a factor to be considered in how they can successfully educate students
“And it also has to do with the time that we have and the way that we teach in three week intensive modules and after three weeks they have to do the assessment and with only one weekend in between they have to go on to the next module and so there is no way to digest things over a longer time.” Student
Demographic (8)
Teacher draws attention to the cultural make up of the institutions student body as a factor in how they approach teaching
“there are cultural differences, definitely differences, there are more cultures where it is allowed and stimulated to have discussion even with your professor lets say, and then there are cultures where it is not allowed at all and you are not supposed to interfere or put a question to what the professor says” For students Perceived value
(13)
The teacher highlights that the tool provides additional benefit for the student in the learning process
“the added value of this concept map is that you have a visual that makes relationships clear between concepts that are not maybe so close in the text so where you would normally have to do several clicks before you find that certain concepts are related, you see them quite easily in this diagram Concerns (14) The teacher expresses apprehension about the usefulness of
the tool as a whole for students or a particular aspect or feature of the tool
“What I am afraid of, is if that we continue like this the ontology will grow and grow and grow and grow and there will be no way to find by visual exploration anything in this map.”
For teachers Use as in
-classroom tool (17)
The teacher highlights how the Living Textbook could be applied by teachers within the context of the lecture hall
“lets say the lecture today is going to be about a certain topic so we go straight to the ontology, talking about what are the major concepts directly connected to this one and then say more or less putting a boundary line around the subject matter of that lecture”
Use to clarify & connect course content (19)
The teacher emphasizes the benefit the tool would bring in helping the teaching faculty to revise, update and agree upon content to be covered in the curriculum
26 Table 3.
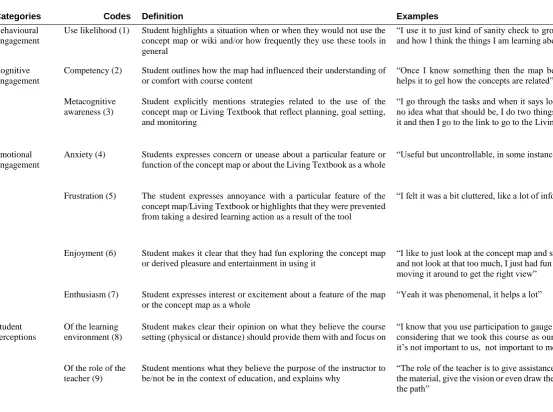
Sample deductive codes and data on usability and engagement from student interviews
Categories Codes Definition Examples
Behavioural Engagement
Use likelihood (1) Student highlights a situation when or when they would not use the concept map or wiki and/or how frequently they use these tools in general
“I use it to just kind of sanity check to ground myself with my thoughts and how I think the things I am learning about are related”
Cognitive Engagement
Metacognitive awareness (3)
Student explicitly mentions strategies related to the use of the concept map or Living Textbook that reflect planning, goal setting, and monitoring
“I go through the tasks and when it says look up this and this and I have no idea what that should be, I do two things, I copy and paste and google it and then I go to the link to go to the Living Textbook” Emotional
Engagement
Frustration (5) The student expresses annoyance with a particular feature of the concept map/Living Textbook or highlights that they were prevented from taking a desired learning action as a result of the tool
“I felt it was a bit cluttered, like a lot of information in one place”
Screen Layout Organization (10) Student comments on the layout of the concept map or the way in which information is organized (e.g. hierarchy, order etc) or on how clear information is on the screen
“Things were not necessarily in a chronological order, so you had to put in extra effort to understand how you move from point A to point B”
Navigation Ease of Use (11) Students comment on specific difficulties they faced in relation to how they were able to move between different parts of the concept map (e.g. search functions, zoom, animation etc) or on how intuitive or straightforward this movement was
“You zoom it and it comes all the way down or all the way up and you can’t get right in the middle, you can’t get just that one size you’re looking for”
Interactivity Response (12) Student comments on how quickly or effectively the system reacts when the user engages with it or highlights how it could be improved
“I’m not quite sure but I was obviously looking for those nodes that are related to the concept that I am searching, so I thought that I could go to the other node by dragging this somewhere, but it didn’t work so I just tried to move the whole screen”
Content Depth (13) Student highlights issue regarding the quality or type of information included in the concept map/wiki (e.g. depth, variety etc.)
“But what I noticed with the Living Textbook is that the quality of the depth that is provided varies a lot, some entries are very repetitive”
Access Accessibility (15) Student makes a comment highlighting the difficulty of using the concept map as a result of internet connectivity/not being able to find the tool
“The whole of my first week I could neither access the textbook or the concept map because I did not have the proper credentials”
Improvements Screen Layout (16) Students makes suggestion for improvement in terms of clarity or organization of information on screen
“But if you only show me the whole tree the main branches the letters should be bigger, not all of them but the main concepts on the homepage”
Navigation (17) Students suggests improvement in relation to the ease of use of the map/wiki interface
27
4. FINDINGS
In this chapter, the combined findings from the think aloud walkthrough and the semi structured teacher and student interviews will be discussed in relation to the research question. The three sub-questions focus on student engagement with the tool and its usability, and on teacher perspectives on the pedagogical value of the tool. DE students claim to use the tool frequently in their study and believe that the map has aided their competence with regard to conceptual clarity. Both sets of students also appear to be emotionally engaged with the tool, with most students expressing enthusiasm for the tool as a whole and frustration with specific features of the concept map they believe do not function in the most effective manner. These findings are echoed in the usability test, where students indicate that they perceive the tool as useful as a navigational aid and in its capacity to show a contextual overview. The areas that students experience most usability issues are in relation to the cluttered and intimidating nature of the screen layout, the difficulty in accessing the concept map, and problems in transitioning from the map to the wiki text. Teachers indicate that they perceive the concept map as a useful tool for helping students see connections between concepts that wouldn’t be seen from a textbook, as well as for helping teachers more effectively connect content within and between courses.
4.1 STUDENT ENGAGEMENT 4.1.1 Behavioural engagement
The majority of the DE students interviewed report using the concept map frequently, with some students using the map as a precursor to looking up information on the wiki, and others using it only once they had gained some initial conceptual understanding of the information. These users cite the fact that the map is able to provide them with an overview of the content and a quick way to see the relations between concepts as the primary reason for their continued usage of it. One student also highlights another reason for their continued use of the map, in that it enables them to review and reflect on their learning as they progress through the text:
“I’m really just using it like I said when I’m just reading through the text and just kind of a little back and forth, I think just kind of a sanity check to ground myself with my thoughts and how I think the things that I am learning about are related.”
Only one student reports relatively infrequent use of the concept map, saying they use the map only 50% of the time, and explain that they would prefer a physical textbook. The reasons they cite for this usage pattern are that they find that the information contained within the map is not that detailed, and also that the digital format of the map does not engage the senses sufficiently.
Alongside this, three GFM students involved in the usability tests report being likely to use the concept map as compared to text if it were available to them as a tool, as it would enable them to find information quicker. One student emphasises that they would use it primarily as a navigational tool:
“The functions which the wiki has, the concept map all covers, the search function and every concept and I can just double click and just enter the page, so maybe it is better to use the concept map first in every situation.”
28 Table 4.
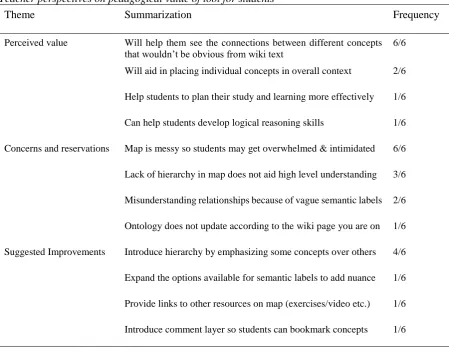
Summary of DE & GFM data collected on student engagement with concept map
Concept Sub-concept DE students Users GFM students Users
Behavioural Engagement
Use likelihood Uses the map frequently to get an overview 3/4 Likely to use the concept map if it were available 3/6
More likely to use a physical textbook 1/4
Cognitive Engagement
Competence Helps to gel concepts together and aid understanding 4/4
Arrows trigger confusion about concept relationships 1/4 Arrows trigger confusion about concept relationships 2/6
Meta-cognitive Awareness
Enables students to keep in mind the bigger picture 4/4
Enables more self-directed learning 1/4
Emotional Engagement
Anxiety Freaks out and is overwhelmed by too much data 1/4
Frustration Clutter and lack of hierarchy in the map 4/4 Wiki text being blocked by map 3/6
Wiki text being blocked by map 2/4
Unable to access concept map through PDF links 2/4
Unable to control the screen/nodes 1/4 Enjoyment Fun moving around nodes and interacting with map 1/4
29 4.1.2 Cognitive engagement
Competency. For students to fully benefit from a learning aid such as the Living Textbook concept map,
they would need to be developing increased cognitive competence as a result of their use of it. Students interviewed who are taking part in the DE masters course have been using the map for a number of weeks, and as a whole report that the map enables them to develop increased competency in terms of the relationship between concepts and building a conceptual overview of the subject. Students comment that the map helps them gel concepts together and enables them to understand the other concepts that are associated with the one they were searching for, as shown in Table 4 above. One particular student comments on the role of the map in helping to situate new knowledge, highlighting:
“you find out whatever topic you just studied, how it is embedded in the rest of the stuff.”
On the other hand, students claim that some features are having a potentially adverse effect on their competence, in that they prompt more confusion than conceptual clarity. Two students cite the size of the arrows and the difficulty in reading relationships as the primary causes of such confusion:
“But also, the other thing was you know the little arrow heads, I was looking into if that gives me an idea of direction, of directional information, and again it seemed like no.”
Two GFM diploma students participating in the usability study also highlight this same confusion brought about by the arrows regarding the direction of relationships. One of those students in particular emphasized that she did not even see the arrows and this was partly what prompted the misunderstanding of the conceptual content:
“So I will always read on the direction of the text, that is my reading habit, and I haven’t noticed the arrows, I haven’t noticed it because if it was bigger I could see it”
Metacognitive awareness. One of the potential benefits of expert based concept map visualizations is that they can make students more mindful of their learning process, and of where the concept they are exploring fits in their learning journey. All the DE students who report consistent use of the concept map emphasise that the tool had better enabled them to keep sight of the bigger picture as they progress through content. One student stresses the importance of the tool in helping to strategize about what content to prioritize:
“so it gives me ideas for things high level things to focus on, or I guess critical things for me to know about this particular concept.”
Digital concept maps can also be used as navigational tools, and it has been theorised that they could aid students in engaging more in self-directed learning. Only one of the DE students interviewed makes reference to this, highlighting that the tool gives her more control over the direction of her learning:
30 4.1.3 Emotional engagement
Students’ emotional engagement with educational software can be both negative and positive, depending on whether students feel the tool is enabling or inhibiting their learning. When the student’s experience of a particular negative emotion leads to the student focusing on the object of the negative emotion, it can drain cognitive resources away from the educational task at hand. Conversely, the positive emotions of students in relation to an educational tool can promote broader cognitive awareness of potential solutions to problems.
Anxiety. This feeling can be brought about when the student feels overwhelmed, lost or confused by a
particular aspect of the educational tool they are utilizing in their learning journey. This is not an emotion visible among the DE students interviewed, but there is one very specific of a GFM student expressing this emotion in the think aloud study. The student in question is opening the concept map for the first time during the usability test, and reacts strongly to the way in which the information is presented:
“Okay, what’s this? I think if I click this it is better to show me the topics or the related bars/fields I am looking at, I think it is better to highlight the topological relationship and it will be more useful for me, if you just show me this actually I can’t see, I freak out, I’m lost, I don’t know where I should go.”
Frustration. This emotional reaction is much more evident among both DE and GFM participants, with
almost all students expressing frustration in some shape or form. In the vast majority of cases, the frustration the student highlights is in relation to a specific feature of the concept map tool, rather than with the tool as a whole. These are often usability issues which prevent students from being able to interact with the tool in the manner in which they want to. The most common gripe students have in relation to the tool is with respect to the messy and cluttered layout of the concept map. While the GFM student in the section above reports ‘freaking out’ in an anxious manner, most DE students express their annoyance about this feature in a much milder manner:
“Well I thought it was a lot of information that we need to learn and it got a little bit messy, but apart from that when you go down into a concept it actually tells you what concepts are connected and a little bit how.”
However, these emotional responses still represent a significant distraction from the task at hand, and are thus of interest in the context of this study. Another common source of irritation among both sets of participants is in relation to the navigation between the concept map and the wiki. Participants do not like that they are not able to have the wiki and the concept map open side by side. They express frustration that the concept map covers the wiki text so they are unable to read about a concept in detail as they try to simultaneously look at its relationship with other concepts. One DE student remarks that this could result in them utilizing the concept map less frequently:
31
Given that one of the main functions of the tool is to serve as a navigational conduit, this is not an ideal scenario. Not all students want to be able to view both pages at the same time, but still express frustration about the fact that text content becomes obscured after they interact with the concept map. One GFM student in particular pinpoints the fact that the map should not remain open after clicking a node. Enthusiasm. Almost all of the participants express some degree of enthusiasm, although often the enthusiasm is for the Living Textbook as a whole, rather than for the concept map tool specifically. Some students do comment specifically on the concept map as a feature that they find “very convenient”, with one student highlighting that they find the tool “phenomenal, it helps a lot”. The specific feature that most captures the imagination of the participants in the usability test is the search functionality:
“When I type a word or several letters it will match the available concepts it will match and I just click and find it so it is very convenient”
Among the DE students interviewed, on the other hand, the specific feature that garners the most positive comments is the ability to navigate directly from the concept map to a wiki page:
“The thing that I liked on the concept map is the ability on clicking on a node of information on the title and it takes you right back to the textbook and this is where it is”
Enjoyment. The more that students enjoy interacting with educational software, the more likely they will
be to make continued use of it. There was very little evidence of students expressing enjoyment in either the usability test or the DE interviews. While students are content with the overall convenience of the tool, only one DE student expressly mentions that they had fun with the tool:
“I just had fun following the connections and moving it around to get the right view that I thought for me makes more sense, by just moving it around, I like that very much”
Overall, students appear to be quite engaged with the concept map tool on an emotional level, although the majority of their responses are not high in motivational intensity. Many of the features that cause the most negative reactions are usability issues with the concept map, and these are explored in greater detail in the following section.
4.2 USABILITY
Students will engage with a web based concept map if they perceive it as a valuable aid in their learning process. At the same time, students may be less likely to engage with the concept map if specific issues are inhibiting their use of it.
4.2.1 Perceived value
32 Table 5
Perceived value of concept map tool according to students
Overall, 70% of students perceive the concept map as more valuable to them than the wiki, and cite the fun and convenience of the concept map as the primary reason for this. One student in particular highlights that the ability to see an overview is one of the most useful aspects of the tool:
“I would always go first to the concept map, also simply because it is also more fun, I like to get an overview first, I don’t like to read into detail one by one, so I like that very much.”
The predominant areas which the students deem the concept map beneficial are in its capacity as a navigational tool and the speed of finding information. Alongside this, students see value in its interactive features and the content contained in the map, particularly in relation to how concepts connect with one another.
Navigation. The most common benefit of the concept map participants highlight is the speed with which
it enables them to find information, and how this sense of getting an overview contributes to being more quickly able to place a concept in the broader scheme of information. One DE student specifically comments:
Category Perceived value Users
(10) Overall Likely to use concept map first as it is more convenient & useful 7
Increased ability to self-direct learning 1
Screen Layout Digital presentation of the map 1
Navigation Speed of finding information on the concept map 4 Search functionality on the concept map is very useful 2
Interactivity Being able to move nodes to reorganize information 4 Map feature intuitively suggests matches after typing a few letters 2 Instant switching to wiki page after clicking on a node in map 1 Being able to move the screen of the concept map to navigate 1