A Thesis Submitted for the Degree of PhD at the University of Warwick
http://go.warwick.ac.uk/wrap/1066
This thesis is made available online and is protected by original copyright. Please scroll down to view the document itself.
Genomic Data
Yinyin Yuan
Department of Computer Science
University of Warwick
A thesis submitted for the degree of
Doctor of Philosophy
Abbreviations xii
1 Introduction 1
1.1 Genome Architecture and Functions . . . 4
1.1.1 Key Processes and Related Data . . . 5
1.1.2 Microarray Data Acquisition . . . 9
1.2 Statistical Inference for Functional Genomics . . . 10
1.2.1 Tight Clustering of Gene Expression Profiles . . . 11
1.2.2 Clustering Validation Using Functional Annotation . . . 12
1.2.3 Transcriptional Regulatory Network Reconstruction . . . 13
1.3 Thesis Overview . . . 16
1.3.1 Thesis Contributions . . . 16
1.3.2 Thesis Organisation . . . 18
2 Partial Mixture Model for Tight Clustering Gene Expression 19 2.1 Introduction . . . 19
2.2 Existing Methods and Future Needs . . . 21
2.2.1.1 Spline model . . . 22
2.2.1.2 Autoregressive model . . . 23
2.2.2 Parameter Estimation . . . 24
2.2.3 Limitations of Existing Methods . . . 26
2.2.4 Emergence of Tight Clustering . . . 27
2.3 Proposed Tight Clustering Method . . . 29
2.3.1 Minimum Distance Estimator (MDE) . . . 30
2.3.2 Weighted Mixture Model with MDE . . . 31
2.3.3 Partial Mixture Model with MDE (PMDE) . . . 34
2.3.3.1 The spline regression model . . . 34
2.3.3.2 The stopping criteria . . . 36
2.3.4 Experimental Validation of MDE with partial modelling . . . 37
2.3.5 The PMDE Clustering Algorithm . . . 41
2.4 Experimental Results . . . 42
2.4.1 Experiment on Simulated Data . . . 42
2.4.2 Experiments on Yeast Cell Cycle (Y5) Data Set . . . 44
2.4.2.1 Clustering yeast Y5 data set . . . 46
2.4.2.2 Gene ontology enrichment analysis . . . 50
2.4.2.3 Predictive accuracy test . . . 54
2.4.2.4 Scattered genes . . . 59
2.4.2.5 Comparative evaluation on scattered gene detection 62 2.4.3 Experiments on Yeast Galactose Data . . . 63
2.5 Conclusions . . . 68
3.1 Introduction . . . 70
3.1.1 An Introduction to Gene Ontology (GO) . . . 72
3.1.2 Rationales for GO-based Clustering Validation . . . 74
3.2 Existing Methods Assuming GO as Functional Categories . . . 76
3.3 Existing Methods Based on GO Semantic Similarity . . . 79
3.3.1 GO Semantic Similarity . . . 79
3.3.2 Problems of Methods in this Category . . . 81
3.3.3 Experimental Assessment . . . 83
3.3.3.1 Clustering validation indices . . . 83
3.3.3.2 Experiment . . . 84
3.4 Proposed Validation Method . . . 87
3.4.1 GO-based Term-Term Distance . . . 89
3.4.2 Within-Cluster Compactness . . . 91
3.4.3 Between-Cluster Similarity . . . 92
3.4.4 Combined Index WB . . . 93
3.4.5 Confidence Thresholds . . . 94
3.5 Experimental Results . . . 95
3.5.1 Evaluation of Six Clustering Algorithms . . . 97
3.5.1.1 Experiments on yeast Y5 data . . . 99
3.5.1.2 Experiments on Arabidopsis diurnal data . . . 103
3.5.2 Perturbation Experiment . . . 109
3.5.3 Finding Optimum Number of Clusters . . . 111
3.6 Conclusions . . . 114
Network Reconstruction 116
4.1 Introduction . . . 116
4.2 Data Sources and Existing Methods . . . 119
4.2.1 Heterogenous Data Sources . . . 119
4.2.2 Existing Methods for Network Reconstruction . . . 120
4.2.2.1 Methods for single data source . . . 121
4.2.2.2 Methods for multiple data sources . . . 122
4.2.3 Existing Problems and Prelude to the Proposed Approach . . 124
4.3 Proposed Bayes Random Fields (BRFs) Integrative Method . . . 125
4.3.1 Bayes Framework . . . 126
4.3.2 Random Fields Model . . . 128
4.3.3 A Gibbs Sampling Algorithm for BRFs . . . 129
4.4 Experiments . . . 133
4.4.1 Synthetic Networks . . . 134
4.4.2 Saccharomyces Cerevisiae Regulatory Network . . . . 136
4.5 Conclusions . . . 146
5 Conclusions and Future Research 147 5.1 Conclusions . . . 147
5.1.1 Partial Mixture Model Tight Clustering . . . 148
5.1.2 Clustering Validation Using Gene Ontology . . . 149
5.1.3 Transcriptional Regulatory Network Reconstruction . . . 151
5.2 Future Research . . . 152
5.2.2 GO-driven Validity Index for Regulatory Network Inference
Methods . . . 154
5.2.3 Combined Analysis of DNA Sequence and Microarray Data . 154
A 157
A.1 Theoretical Comparison between MDE and MLE . . . 157
A.2 Mean Integrated Squared Error . . . 158
B 161
B.1 Efficient Computation of Partial Correlation . . . 161
1.1 Key processes in the central pathway (adapted from [8]). . . 4
1.2 Genomic data is providing large-scale descriptions of nearly all
com-ponents and interactions within the cell (adapted from [75]). . . 6
1.3 An Arabidopsis circadian gene network of six genes (adapted from
Locke et al [87]). Circles are proteins and DNA segments represent
genes. . . 14
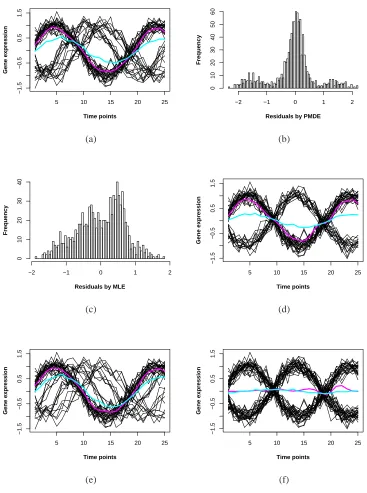
2.1 Comparing MDE and MLE by data fitting and their residual histograms.
(a) MDE fit (pink line) and MLE fit (blue line) to simulated data
gen-erated from three sine waves; (b) Histogram of residuals by MDE; (c)
Histogram of residuals by MLE; (d) MDE fit (pink line) and MLE
(blue line) fit to simulated data generated from two sine waves; (e)
MDE fit (pink line) and MLE (blue line) fit to data with many outliers;
(f) MDE fit (pink line) and MLE (blue line) fit when two components
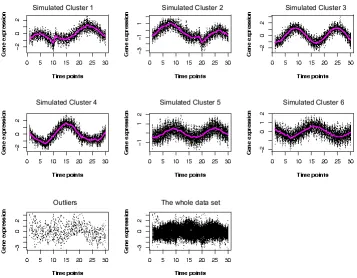
2.2 The resulting partition by the partial regression clustering algorithm
for the simulated data set. The first 6 plots correspond to the gene
clusters, the left plot in the third row shows the outliers, the right plot
in the last row shows the whole data set. . . 43
2.3 The original partition of the yeast Y5 data set with the bottom right
plot of the whole data set. . . 46
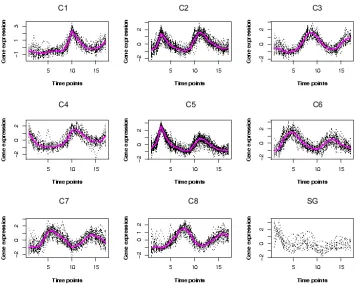
2.4 The clusters by the partial regression clustering algorithm for the Y5
data set. The bottom right plot shows the scattered genes. . . 47
2.5 Heatmaps for the original partition (left), SplineCluster (middle)
parti-tion and the proposed PMDE clustering (right) partiparti-tion. The brighter
red color corresponds to higher expression levels and brighter green
color corresponds to lower expression levels. . . 48
2.6 Predictive accuracy plots for five clustering methods on Y5 data set.
Five clustering methods are evaluated in terms of their functional group
prediction accuracy. The five methods are the proposed PMDE (red),
SplineCluster (violet), MCLUST (black), hierarchical clustering (green),
and K-means (blue). The higher the curve is the better the performance
is. . . 55
2.7 The profiles of seven genes related to Late G1, SCB regulated cell
cycle phase. The red profile is the gene “TIP1/YBR067C”, one of the
ten scattered genes. It displays a distinctive pattern from the other six
2.8 Comparison of performance of PMDE and MCLUST in outlier
detec-tion. A small index value of WS S indicates better performance in
out-lier filtering. PMDE performs better than MCLUST with large number
of clusters. . . 62
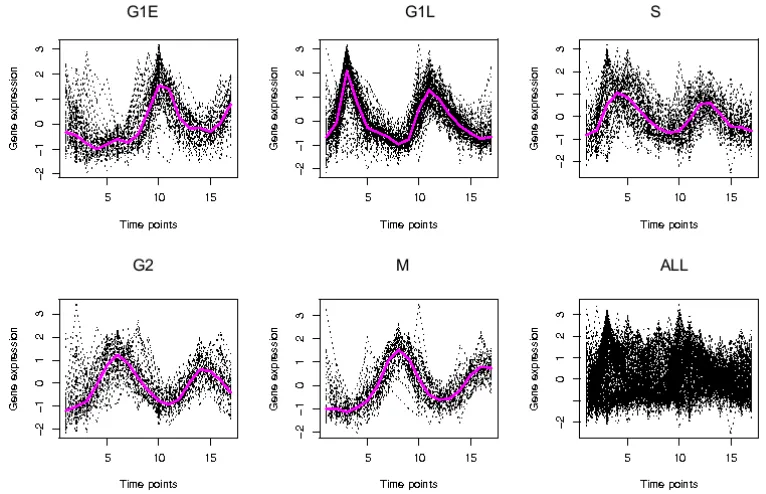
2.9 Expression data across 20 time points in four functional categories of
yeast galactose data. . . 64
2.10 Scattered genes in original cluster 2 of the yeast Galactose data set.
The expression profiles of some scattered genes detected by the
pro-posed algorithm are plotted for the yeast Galactose data set. This
plot shows the expression patterns of all 15 genes in original cluster
2, among them the 3 colored genes are the detected scattered genes. . 65
2.11 Scattered genes in original cluster 3 of the yeast Galactose data set.
The expression profiles of the 3 scattered genes in original cluster 3.
They share GO annotations but have various expression patterns. . . . 66
3.1 The graph structure of GO, edge weights are to be defined in Section
3.4.1 . . . 73
3.2 An example of functional overlapping in gene clusters with the
over-represented terms (pink) for three gene clusters (C1, C2 and C3). There
is an overlapping over-represented term (GO:0000278) between C1
3.3 Experiments on discriminating random partitions (yellow curves) from
meaningful partitions (non-yellow curves) with semantic similarity based
on the Silhouette index. For each of the GO category, three semantic
similarity measures, Resnik’s (R), Lin’s (L), Jiang and Conrath’s (JC)
measure, are used. . . 85
3.4 Experiments on discriminating random partitions (yellow curves) from
meaningful partitions (non-yellow curves) with semantic similarity based
on the Davies-Bouldin index. Colour codes are provided in the legend
in Figure3.3. . . 86
3.5 Experiments on discriminating random partitions (yellow curves) from
meaningful partitions (non-yellow curves) with semantic similarity based
on the Dunn index. Colour codes are provided in the legend in Figure
3.3. . . 87
3.6 The Arabidopsis L. Heynth diurnal data clustered into eight clusters
by K-means clustering. . . 96
3.7 For the Yeast Y5 data set, plots of (a),(b),(c) WCC scores and (d),
(e), (f) BCS scores for six clustering algorithms and the average of
ten random runs based on the three GO categories BP, MF and CC,
respectively. . . 102
3.8 For the yeast Y5 data set, normalised scores of six validity indices for
various clustering algorithms and random partitions. The solid lines
denote that the indices are GO-driven, while the dashed lines denote
3.9 For the Arabidopsis diurnal data set, normalised scores of six validity
indices for various clustering algorithms. Colour codes indicating the
validity index identities are the same as they are in Figure3.8. . . 105
3.10 Normalised scores of validity indices with increasing level of
pertur-bation in the yeast galatose data set. Large values correspond to good
partitions for all the indices. (a) GO-driven validity indices WB, BHI
and BSI calculated based on the GO category ‘Biological process’, (b)
WB index and data-driven indices. . . 110
3.11 Scores of the six validity indices as a function of cluster numbers for
the yeast Y5 data set using (a) SplineCluster algorithm, (b) hierarchical
algorithm, (c) PMDE algorithm. Colour codes are the same as they are
in Figure3.8(black: WB, red: BHI, green: BSI, dark blue: Dunn, light
blue: CH, pink: DB). . . 113
4.1 Experimental results for the synthetic networks. . . 135
4.2 Experimental results for the 909 yeast genes. . . 139
4.3 Plot of the inferred cell cycle specific sub-network, with size of the
nodes indicating the degree of connectivity. . . 140
4.4 ROC curves for threshold selection methods for the three data types
used in network reconstruction and the resultant network by BRFs on
the 296-gene sub-network. PCOR stands for the partial correlation. . . 141
4.5 Connectivity degree distribution of the 296-gene sub-network. The x
axis shows the degree of connectivity of 296 nodes on log2scale. . . . 142
4.6 Plot of time series data of the eight transcription factors (pink) and the
2.1 Cross tabulation of the original partition and the PMDE clustering
par-tition for the Y5 data set. . . 46
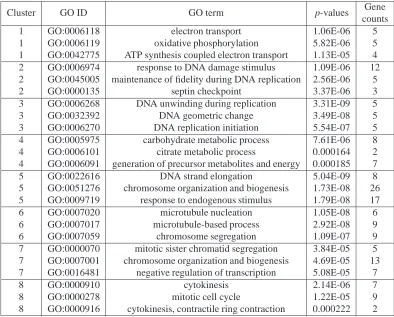
2.2 Over-represented GO terms by the proposed PMDE algorithm for the
Y5 data set . . . 52
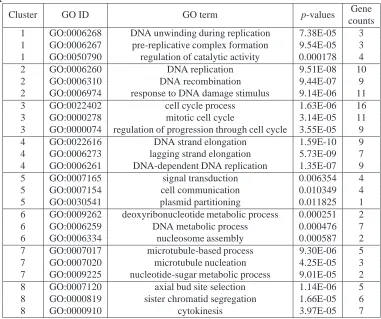
2.3 Over-represented GO terms by the SplineCluster Algorithm for the Y5
data set . . . 53
2.4 Verified cell cycle related (68) genes in the yeast Y5 data set . . . 57
2.5 Cross-tabulation of clustering outcome (C1-C8 and SG) with verified
gene functional categories for the yeast Y5 data set . . . 58
2.6 Details of the set of scattered genes for the yeast Y5 data set detected
by PMDE, including their SGD IDs, the frequencies that they are found
across eight experiments of various thresholds, and their annotations. . 61
2.7 Cross-tabulation of the original partition (O1-O4) and the resulting
partition (C1-C4 and SG) for the yeast Galactose data set. . . 66
2.8 Over-represented terms in each original cluster for the yeast galactose
3.2 Confidence levels (α) and corresponding p-value cut-offs (ρ) in the
PMDE partition for the Arabidopsis data set . . . 104
3.3 Over-represented GO terms in the K-means partition for the
Arabidop-sis data set . . . 107
3.4 Over-represented GO terms in the PMDE partition for the Arabidopsis
data set . . . 108
3.5 Confidence levels (α) and corresponding p-value cut-offs (ρ) in the
starting partition for the Galatose data set for the perturbation experiment109
4.1 Some parameter settings for SynTReN software to generate the
simu-lated data sets, the rest are set as default. . . 134
4.2 Over-represented GO terms in the transcriptional modules for eight
transcription factors. . . 143
4.3 Over-represented GO terms in four phases specific modules found in
I would like to thank my supervisor, Dr Chang-Tsun Li, for giving me the
opportunity to explore the vast spectrum of knowledge and discover the
exciting field of bioinformatics. Since our acquaintance in 2003 during
my master course, he has alway been supportive and encouraging, not only
for my Ph.D. study but also in pursuing my academic goals. I received his vision, experience, and in particular his rigorous research attitude, which
will be greatly beneficial to my future career.
I am grateful to Prof Roland Wilson, who, as my advisor, helped me keep
track of my progress in the last three years and supported me through many difficulties. I want to acknowledge the generous support and advices given
by Dr Vicky Buchanan-Wollaston and Linda Hughes in Warwick
Horti-culture Research International. During our interactions, many ideas were
inspired that have led to significant progress in my study. I am also
thank-ful to Dr Sascha Otts in the Centre of Systems Biology whose penetrating
insights in both computational and biological aspects of bioinformatics are
very helpful.
I also would like to thank many colleagues and friends for their help and
friendships, without which my life at Warwick University would not have
This thesis explores the potential of statistical inference methodologies in
their applications in functional genomics. In essence, it summarises
algo-rithmic findings in this field, providing step-by-step analytical
methodolo-gies for deciphering biological knowledge from large-scale genomic data,
mainly microarray gene expression time series.
This thesis covers a range of topics in the investigation of complex
mul-tivariate genomic data. One focus involves using clustering as a method
of inference and another is cluster validation to extract meaningful
biolog-ical information from the data. Information gained from the application
of these various techniques can then be used conjointly in the elucidation
of gene regulatory networks, the ultimate goal of this type of analysis.
First, a new tight clustering method for gene expression data is proposed to obtain tighter and potentially more informative gene clusters. Next, to
fully utilise biological knowledge in clustering validation, a validity
in-dex is defined based on one of the most important ontologies within the
Bioinformatics community, Gene Ontology. The method bridges a gap in
current literature, in the sense that it takes into account not only the
varia-tions of Gene Ontology categories in biological specificities and their
sig-nificance to the gene clusters, but also the complex structure of the Gene
Ontology. Finally, Bayesian probability is applied to making inference
from heterogeneous genomic data, integrated with previous efforts in this
thesis, for the aim of large-scale gene network inference. The proposed system comes with a stochastic process to achieve robustness to noise, yet
remains efficient enough for large-scale analysis.
Ultimately, the solutions presented in this thesis serve as building blocks
of an intelligent system for interpreting large-scale genomic data and
I hereby certify that all of the work described within this thesis is the
orig-inal work of the author. Any published (or unpublished) ideas and/or
tech-niques from the work of others are fully acknowledged in accordance with
the standard referencing practices.
Yinyin Yuan
• Y. Yuan and C.-T. Li, “A Bayes Random Field Approach for tive Large-Scale Regulatory Network Analysis,” Journal of
Integra-tive Bioinformatics, 5(2):99, 2008.
• Y. Yuan, C.-T. Li and R. Wilson, “Partial Mixture Model for Gene Expression Tight Clustering,” BMC Bioinformatics, 9:287, 2008.
• Y. Yuan and C.-T. Li, “Understanding Gene Clusters: An Investi-gation into Quantitative Assessment,” submitted to Bioinformatics,
2008.
• Y. Yuan and C.-T. Li, “Probabilistic Framework for Gene Expression Clustering Validation Based on Gene Ontology and Graph Theory,”
in Proc. of International Conference of Acoustics, Speech, and
Sig-nal Processing (ICASSP), pp. 625-628, Las Vegas, US, 2008.
• Y. Yuan and C.-T. Li, “Partial Mixture Model for Tight Clustering in Exploratory Gene Expression Analysis,” in Proc. of International
Symposium on BioInformatics and BioEngineering (BIBE),
BCS Between-Cluster Similarity
BHI Biological Homogeneity Index
BP Biological Process
BSI Biological Stability Index
CC Cellular Component
CH Calinski and Harabasz index
DNA Deoxyribonucleic Acid
EM Expectation-Maximisation
FC Functional Compactness
FDR False Discovery Rate
FS Functional Similarity
GO Gene Ontology
IC Information Content
MDE Minimum Distance Estimator
MF Molecular Function
MLE Maximum Likelihood Estimator
mRNA messenger Ribonucleic Acid
PAM Partitioning Around Medoids
PMDE Partial mixture model with MDE
Introduction
The genomics age has entered a new era to provide a grand picture of the whole
genomes. Advances in microarray, deoxyribonucleic acid (DNA) sequencing
tech-niques, and other high-throughput biotechnologies have brought great success to the
life sciences. With the support of these high-throughput biotechnologies, significant
breakthroughs in life science have been achieved, such as the advancement of cell
reprogramming [139] and the development of low cost sequencing techniques [42].
Increasingly, high-throughput technologies are changing the biological landscape with
their efficiency, cost effective nature and genome-wide coverage.
Therefore, some of the most significant advances in genomics research in recent
years have been achieved with the availability of these high-throughput technologies
to produce large-scale genomic data. The advent of these genome-scale data sources
has transformed conventional biological research into data-oriented investigations. In
these investigations, a key research direction is the effective interpretation and efficient
utilisation of these information-rich data. For instance, inference from these data at the
new discipline employing innovative data mining methods supported by high-throughput
biological experimental technologies. The central goal is to employ computational
techniques for extracting knowledge from the large-scale genomic data, and translate
gained knowledge into system-based applications such as disease classification.
Statistical inference methods have been intensively applied to various research
ar-eas such as multimedia processing [150] and computational neuroscience [58].
Al-though statistics has been the support for biological data analysis for many years,
bi-ological data has changed over time not only in size, but above all in structure. In
particular, genomic data from high-throughput biotechnologies have their unique,
di-verse features. New statistical challenges arise from the requirements of analysing
these high-throughput genomic data, and, ultimately, deriving fundamental biological
information. In this sense, innovative, objective and effective computational methods
are urgently needed.
In recognition of this, this thesis addresses existing problems in statistical inference
from large-scale genomic data resulting from high-throughput technologies, which, in
essence, originate from the scale and the intrinsic characteristics of the data. In
re-sponse, it introduces new computational statistical approaches built upon up-to-date
biological understanding. The new algorithms have been developed taking into
ac-count the unique characteristics of genomic data, and have been validated by means of
statistical benchmarking with both synthetic and real-world data. Above all, the thesis
represents the methodology of designing novel statistical models in accordance with
biological prior knowledge about the subjects under investigation.
ge-nomics research, bridging multiple disciplines such as computer science, molecular
biology and statistics. The thesis highlights an exposition that advanced statistical and
computational techniques, combined with highly problem-specific modeling efforts,
can be eventually developed into elegant yet realistic formulations for genomics
re-search. On the other hand, the immense complexity and stochasticity nature of the
data faced by genomics research not only challenge the fields of theoretical and
algo-rithmic statistical learning, but also foster new developments within. Further, insights
gained from this process could lead to new perspectives in algorithmic findings for
a broad range of fields that involve statistical learning, such as signal processing and
neuroscience.
This chapter is organised as follows. To understand the central goal in genomics,
this chapter first gives a brief description about the genome architecture and
function-ality. It then discusses the current state as well as the strengths and weaknesses of the
representative data types presented, with an emphasis on how the genomic data are
re-lated to certain biological process and how they contribute to the analysis. Specifically,
this chapter gives a description about the acquisition process of gene expression data
from microarray technology, the main source of data analysed in this thesis, to help
understand the data particular characteristics. Later the key issues related to genomic
data analysis are laid out, as both derived from the literature and initial experimental
data analysis. Following this, the objectives of this thesis are presented. The chapter
Figure 1.1: Key processes in the central pathway (adapted from [8]).
1.1
Genome Architecture and Functions
Functional genomics is, fundamentally, an area of research dedicated to understanding
the structure and functional organisation of the genome [40]. The central dogma states
that it is the genetic information encoded in the genes, which through a molecular
decoding process, facilitates the functioning of cells in a living organism [27].
Deci-phering the gene control circuitry encoded in the genes and its functional organisation
is a fundamental problem in genomics research, and is a focus of this thesis.
The expression of genetic information encoded in the genes occurs in two stages, as
depicted in Figure 1.1. Genes are segments of DNA, which is a long double-stranded
anti-parallel molecule in which single complementary strands reversibly bind to each
other to form a double stranded helix. From the left of Figure1.1, genes are regulated
by their own gene regulatory proteins, namely transcription factors, and transcribed
to the process of making a single-stranded mRNA molecule using a single coding DNA
strand as a template, it is also the initial step of gene expression. mRNA are then
trans-lated into proteins which are responsible for carrying out nearly all cell functions. In
turn, some of the proteins can again act as transcription factors which act to
(coordi-nately) regulate transcription itself. These transcription factors regulate the next gene
expression for the gene themselves are encoded by and/or the transcription of other
genes. The whole procedure is governed by complex biochemical interactions that
regulate gene expression and interaction. Therefore, the regulatory mechanisms are
vital in directing genetic information flow and are the key to a global understanding of
genome functions.
Study of the above genetic information flow from gene to protein in the central
pathway helps reveal functional regulatory components in the genome, discover their
connections with each other, and ultimately lead to mapping out the whole picture
of the regulatory mechanism. The fundamental problem is how to infer collective
gene regulatory functions and clarifying the roles of genes in cellular processes. By
providing computational methodologies applicable to the high-throughput data that
monitor these processes, this thesis aims to shed light on the study of gene regulatory
mechanisms. The investigation focus is on transcriptional activities that are central to
the regulatory mechanisms in the genome.
1.1.1
Key Processes and Related Data
Recent advances in high-throughput technologies have enabled the entire information
flow procedure in the central pathway, as described in Section1.1, to be captured on a
Figure 1.2: Genomic data is providing large-scale descriptions of nearly all compo-nents and interactions within the cell (adapted from [75]).
at different levels of the regulatory mechanism, three processes are explicitly listed
below, followed by related types of data that can provide relevant information about
these processes.
• Transcription factor binding Proteins that are transcription factors bind to
genes/segments of DNA, cause changes in their expression and facilitate
tran-scription.
• Gene expression Genes are transcribed into mRNAs, and the resulting mRNA
abundance can indicate the active genes and their expression levels.
• Protein-protein interaction mRNAs are translated into proteins which perform
cell functions. Some proteins that are transcription factors can again initialise
gene expression.
Figure 1.2 depicts these three processes tracing the genetic information flow. As
inter-action data or component data. The interinter-action data specify links between molecular
components while components data deal with the molecular content of the cell.
From the top, transcriptions factors (proteins) regulate and initiate transcription
of mRNA from DNA. The processes that are responsible for generating and
modify-ing these cellular components are generally dictated by molecular interactions, in this
case, by protein-DNA interactions. These interactions can be described with the
tran-scription factor binding data, which directly capture protein-DNA interactions in the
first place. Then during transcription, genes are expressed and result in mRNAs. The
presence and the relative abundance of resulting mRNA transcripts can be measured
by the component data of the microarray gene expression data. After these mRNA
are translated into proteins, protein-protein interactions are involved in translational
processes as well as enzymatic reactions. Protein-protein interaction data can indicate
how the end products interact and dictate cellular functions. This figure shows how
genome-scale data conveniently provide rich information about the key processes
oc-curring within the genome and proteome. Next, we review these representative data
and the techniques that are used to generate them.
Transcription factor binding data
(Transcription factor) Binding data directly identify interactions between proteins and
DNA in vivo, particularly between transcription factors and their target genes. Such
interactions fundamentally define the underlying regulatory network and reflect the
binding kinetics of the constituent molecular species (genes and proteins). Binding
data can be obtained with high-throughput technologies such as ChIP-Chip [98]. Still,
binding is only a necessary condition for regulation. Many true positives at the binding
Microarray gene expression time data
Microarray gene expression data record the levels of genes being expressed in order to
determine the set of genes that are differentially expressed between two experimental
treatments or conditions [114]. If microarray is used in expression profile experiments
that are conducted at subsequent time points, the resulting data consist of gene
expres-sion level measurements taken at either uniformly or unevenly distributed time points.
Gene expression data receive special attention in genomics research, both because of
its rich information and genome-wide coverage. However, the data is prone to high
degree of variability and noise due to inherent problems of the technique.
Protein-protein interaction data
Protein-protein interactions play critical roles in dictating most cellular process, such
as enzyme-complex formation and catalysis. In essence, information from
protein-protein interactions not only potentially reveals sets of protein-proteins that are involved in the
same pathway, but also can be related to transcriptional regulation level in the sense that
interacting proteins are often co-expressed and co-localised to the same sub-cellular
compartment. Protein-protein interaction data can be obtained by the high-throughput
scaling of technologies that exhaustively probes all the potential interactions within
entire genomes, such as the yeast two-hybrid system [68]. However, these methods
can suffer from high false positive and false negative rates owing to their inherent
lim-itations [140].
The availability of these data makes it possible to understand gene functions and
spe-cific cellular phenotypes which is the physical manifestation/change brought about by
altered gene expression, e.g. disease susceptibility. However, it is important to
recog-nise that high-throughput methods generally sacrifice specificity for scale, yielding
many false positives and high-level noise in the data. Since gene expression time
se-ries data provide dynamic information about cell activities, they are the main focus of
this thesis. The other two data types will be used in Chapter 4.
1.1.2
Microarray Data Acquisition
Of the three types of data, only microarray gene expression data analysed in this thesis
are time series data. Microarray data are obtained from time series experiments to asses
gene expression profiles in order to extract genomic information across time or under
different experimental treatments. Gene expressions over time can be captured and
recorded into a succession of numbers, on the scale of tens of thousands of genes. The
dynamic information in time series data is useful in studying casual relations between
time series, which are essentially equivalent to regulatory relationships between genes.
Ideally, this will ultimately lead to mapping out the regulatory circuits in the genome
[146].
Microarray is a high-throughput technology that can provide gene expression
mea-surements for thousands of gene simultaneously. A microarray has a collection of
DNA products printed onto a glass slide and each product is specific for an individual
gene. mRNA from two biological samples are fluorescently tagged and hybridised
si-multaneously to probes on the array. Through competitive binding of these probes to
the gene-specific DNA products a relative abundance of that gene within the two
the two separately tagged probes. The underlying hypotheses are that the mRNA
abun-dances in probes reflect the expression levels of the corresponding genes, and that the
mRNA abundances decides, as a result of the detection, the strength of the signal under
the excitation of a laser scanner, because abundant sequences will generate strong
sig-nals and rare sequences will generate weak sigsig-nals. In other words, microarray takes
snapshots of gene expression levels of all the genes in an organism.
To obtain microarray gene expression time series, microarray experiments are
per-formed at different time points with either uniform or uneven intervals. Quantitative
data are extracted from the resulting microarray images, normalised and processed into
a gene expression matrix. Each row in this matrix describes the expression levels for
one gene across time. Consequently, gene expression time series data are obtained as
sequences of gene expression measured at successive time points at either uniform or
uneven time intervals [114].
1.2
Statistical Inference for Functional Genomics
Statistical inference for functional genomics aims at integrating statistical inference
methods and the understanding of functional mechanisms of the genome [40, 71].
To achieve the central goal of functional genomics, which is essentially extracting
biologically relevant network topologies, various types of techniques such as clustering
and network modelling can be utilised, so that problems can be systematically tackled.
This section provides a summary of relevant literature and problem formularisations
1.2.1
Tight Clustering of Gene Expression Profiles
To deal with the large-scale gene expression data, clustering is usually the initial step
towards biological inference for gene functions. Clustering aims to assign genes that
share similar expression patterns into the same cluster. It provides an efficient way
to extract information from large-scale gene expression data sets. Relevant genes can
be screened out for the biological process under study, or possible functional
rela-tionships can be found among tens of thousands of genes on a microarray. The
un-derlying assumption in clustering gene expression data is that co-expression indicates
co-regulation, thus clustering should identify genes that share similar functions. This
biological rationale is readily supported by both empirical observations and systematic
analysis [17].
Given this promising direction, various clustering methods have been proposed to
process the tremendous amount of microarray data, see [71, 72] for excellent reviews
of current techniques. Looking at the prevalence of the many existing algorithms there
may be no need to implement new ones. However, continuous development of the
microarray technique brings new challenges on a regular basis. Moreover, many
ex-isting methods were adapted or even directly applied to gene expression data from
conventional clustering algorithms [72], which may fail to meet current needs.
In particular, tight clustering arose recently from a desire to obtain tighter and
potentially more informative clusters in gene expression studies [138]. Scattered genes
with relatively loose correlations should be excluded from the gene clusters. Although
various model-based clustering methods have been proposed, few of them address the
need of obtaining tight and hence more biologically meaningful clusters. Objective
are therefore essential. In Chapter 2, a new tight clustering method will be proposed to
meet these requirements.
1.2.2
Clustering Validation Using Functional Annotation
With many clustering algorithms available, it is non-trivial to select one that can best
tackle the challenges posed by the genomic data. Systematic formulation is therefore
needed to prove the feasibility of clustering methods in this field. While it is still open
to debate how a validation system should be constructed for gene expression clustering
to verify the usefulness of the schemes, one promising direction is assessing the
perfor-mance of an algorithm with existing biological knowledge. Outcomes from biological
research have been gathered and translated into databases over decades, which provide
specialised information to describe the functional profiles of genes. Exploiting
infor-mation from these databases can facilitate integrative analysis of experimental results
and existing knowledge, and further provide evidence for validation studies.
One of these databases, the Gene Ontology consortium (GO) [132], offers a wealth
of complementary biological knowledge and is one of the most important ontologies
for gene functions. Its structured vocabulary not only provides straightforward
infor-mation about the gene functions, but it is also computationally accessible to quantify
the relationships between genes. In essence, mappings are set up between genes and
structured functional categories, and thereby annotating genes with a defined set of
functions. Potentially, genes can be grouped according to their functional mappings to
corresponding GO terms, which provides a good validation platform for a clustering
method.
func-tional relationships between genes and, ultimately, to assess the quality of gene clusters
[2, 29, 88]. However, none of them has systematically taken the structure information
in GO into account. In Chapter 3, a GO-driven clustering validation index is proposed
to make full use of the information provided by GO.
It is worth mentioning that another way of utilising GO knowledge in clustering
analysis is to incorporate GO information into the clustering process in the hope of
building more biologically meaningful clusters [22, 59, 129]. For example, it is
pro-posed in [129] that the number of clusters can be determined by extracting Web-based
knowledge to be used as input to their semi K-means algorithm. However, the
ef-fectiveness of this strategy greatly depends on the accuracy of knowledge about the
organism under study. It neglects the fact that existing knowledge and the true
pat-terns do not necessarily coincide and may as a result fail to discover the true biological
patterns. One of the reasons for this contradiction originates from the incompleteness
and false positives of biological databases. After all, an important goal for clustering
is to identify novel functional annotations. Indeed, it is the desire of understanding
the gap between statistical findings and current biological understanding that drives
researchers.
1.2.3
Transcriptional Regulatory Network Reconstruction
A gene regulatory network is a collection of genes and gene interactions with each
other indirectly through their RNA and protein expression products and with other
substances in the cell, thereby regulating the rates at which genes in the network are
transcribed. Reconstructing, or reverse-engineering, gene transcriptional regulatory
Figure 1.3: An Arabidopsis circadian gene network of six genes (adapted from Locke
et al [87]). Circles are proteins and DNA segments represent genes.
genes from biological data. Nowadays, genomic, transcriptomic and proteomic data
are in massive production. By using these high-throughput data, transcriptional
regula-tory activities are modelled on a genome-wide scale. Most importantly, gene network
reconstruction helps clarify the role a gene plays in the transcriptional regulatory
sys-tem, so that relevant genes, such as important transcription factors, can be screened out
and chosen for further experimental manipulation to help consolidate the knowledge
of the system under investigation.
As an example of a transcriptional regulatory network, a circadian gene network in
Arabidopsis Thaliana is illustrated in Figure1.3as studied in [87]. One of the regula-tory relationships in this network is the protein TOC, together with light derived input
turn has regulatory effect on the transcription of the gene TOC.
Although gene expression data from microarrays are typically used for the purpose
of transcriptional regulatory network reconstruction [3], it often lacks the desirable
specificity and accuracy [11], since the information in the data is often entangled in
a complex mixture of various types of noise. When more than one biological data
source is available, integrative analysis is likely to offer significant advantages, and is
currently a subject of ongoing research. As shown in Section 1.1, DNA, RNA, and
protein interact with each other. The information from all three realms must be
com-bined to bring full understanding of the global cellular structure. Integrative inference
algorithms serve this purpose by exploiting, in addition to expression profiles,
protein-protein interaction data, sequence data, protein-protein modification data, metabolic data and
more, in the inference process [3].
For integrative approaches, existing techniques have evolved from the simplest
vot-ing model [142] to more sophisticated Na¨ıve Bayesian Networks [82, 120], and
pro-gressively to substantially more complex systems nowadays [86, 127]. However, so
far there is no robust method that can be routinely applied to noisy and heterogeneous
data and yet be efficient enough for handling gene expression time series [135,161].
One of the issues in designing such an integrative system arises from the diverse
formats of genomic data, which, in particular, is made explicit by the high-dimensional
microarray time series. The study of inferring gene networks from microarray time
se-ries data alone fits well into classical theose-ries of dynamic systems. However, for
exist-ing time series inference methods the microarray time series are very often too short to
provide enough information about the regulatory relationships underneath concomitant
behaviour changes.
imply direct physical interactions, but can also refer to indirect regulations via proteins,
metabolites and mRNA that have not been measured directly. Computational analysis
that can differentiate between these two types of interactions are important to bring a
better understanding to the underlying network structure. New, objective methods are
needed in order to address these problems outside the boundary of classical theories.
In Chapter 4, a new gene regulatory network inference method is proposed to make
integrative inference from multiple data sources to increase predictive accuracy and to
address these issues.
1.3
Thesis Overview
1.3.1
Thesis Contributions
Although biologists possess a basic understanding of the mechanisms regulating the
flux and flow of information through this complex multidimensional regulatory
sys-tem, they have not yet determined individual roles of most genes in the transcriptional
system. This thesis presents computational tools to help infer gene functions, utilise
current biological knowledge, and discover gene regulatory relationships. The
ap-proaches combine ideas from signal processing, graph theory, Bayesian models. In
particular, it presents algorithms for gene clustering and network modelling, and
solu-tions for inferring from large-scale, noisy and diverse genomic data. In this respect, it
points out that efficiency, robustness and flexibility are the key to successful
applica-tions of statistical inference algorithms to this particular field of research.
One contribution of the thesis involves the discussion of advantages and limits in
problem in analysing gene expression data as discussed in Section 1.2.1, that gene
clusters often need to be tight/small enough to provide strong evidence for gene
func-tion discovery. Although various clustering methods have been proposed, few of them
address this need of obtaining tight clusters. At the same time, scattered genes with
relatively loose correlations within clusters should be excluded from gene clusters. We
point out that there is little work dedicated to this particular area of research in the
literature. In response, a new tight clustering algorithm is proposed specifically aiming
at the usually short gene expression time series.
The second contribution concerns utilising current biological knowledge for
quan-titative clustering validation. In Chapter 3, we analyse current progress in this field
and bring up limits and challenges, before laying out a validation framework
specifi-cally designed for GO. Two validation indices have been developed, based on a new
term-term distance defined within the realm of graph theory. Designed to overcome
the challenges aforementioned in Section1.2.2, the proposed validity indices take into
account the variations in biological specificities for GO terms, the strength of
relation-ships between terms, and the graphical structure of GO.
Another contribution involves proposing a new computational method for
integra-tive analysis of heterogeneous data sources. Chapter 4 presents a Bayesian integraintegra-tive
framework for transcriptional regulatory network reconstruction with a Markov
Ran-dom Fields [80] component that applies the tight clustering method proposed in
Chap-ter 2. A stochastic process for parameChap-ter estimation is designed to achieve robustness
to noise, yet the system remains efficient enough to facilitate large-scale analysis. This
chapter not only addresses the issue of integrating different formats of genomic data
by providing a simple yet effective solution, but also reveals diverse characteristics of
1.3.2
Thesis Organisation
Chapter 2, 3, and 4 constitute the three core analytical chapters in this thesis. Each
chapter has its individual section of literature review, emphasising on the research gaps
in the current literature. In an attempt to bridge these gaps, a solution is proposed and
demonstrated to be effective in the experimental section, independently.
Nevertheless, all chapters are connected in one way or another. The partial mixture
model-based clustering algorithm proposed in Chapter 2 serves as a preliminary step
towards inference and is used throughout the thesis when necessary. Complementary
to Chapter 2, Chapter 3 introduces a Gene Ontology-driven validation method,
provid-ing evidence of the superior performance of the partial mixture clusterprovid-ing algorithm.
Moreover, it provides useful insights into the complex structure of Gene Ontology.
Chapter 4 constitutes the gene network inference part of research. In Chapter 4, an
integration framework for combining different biological sources is proposed for
tran-scriptional regulatory gene network reconstruction. Such a network is useful in
dis-covering relevant network structure and identifying important genes in certain cellular
process.
Chapter 5, the concluding chapter, summarises the finding of the studies in this
thesis, while providing insights into their implications and impacts to this field. It
reviews the goals set in Chapter 1, objectives raised and solutions presented in the
Partial Mixture Model for Tight
Clustering Gene Expression
2.1
Introduction
With the advances of high-throughput microarray techniques, gene expression data
clustering has been an active research area. Gene expression clustering aims to reveal
groups of genes that share similar functions in the biological pathways. In particular,
consider gene expression time series experiments, where the data are made up of tens
of thousands of genes, each with measurements taken at either uniformly or unevenly
distributed time points. For such large-scale data sets as the gene expression time
series, clustering provides a good initial investigation tool, which ultimately leads to
biological inference.
In this chapter, we review previous advances, discuss existing problems and
pro-pose a novel clustering algorithm specifically targeting gene expression time series.
chapter is outlined as follows.
In Section2.2, we first review probabilistic models on which some popular
clus-tering methods are based, and the parameter estimation methods that are routinely
applied, in order to understand the intrinsic problems in existing clustering methods.
Then through a discussion of current research trends, we show that conventional
clus-tering algorithms cannot be simply adapted and applied to this field. In contrast,
in-novative and objective set ups are needed to tackle new problems in high-throughput
genomic data in the hope of revealing biologically meaningful results.
In response to the existing problems and new challenges, a partial mixture model
teamed with a minimum distance estimator is formulated for gene expression tight
clustering in Section 2.3. The inherent robustness of the minimum distance
estima-tor is experimentally proved, which makes it a powerful tool for outlier detection in
model-based clustering. In the comparative experiments in Section 2.4, both
biolog-ical and statistbiolog-ical validations for the proposed method are conducted on a simulated
data set and two real gene expression data sets. The superior performance of the
pro-posed method is confirmed by both biological and statistical validity indices.
More-over, the experimental results show that the tight clusters obtained by our proposed
method are more biologically informative. This further proves the suitability of the
proposed method in this field.
The study concludes by providing new biological hypothesis from the integrative
analysis of the machine learning results and current biological knowledge. We show
that tight clustering is capable of generating more profound understanding of the data
set, well in accordance to established biological knowledge. It also provides new
inter-esting hypotheses from the interpretation of clustering results. In particular, we provide
study, in contrast to prevailing opinion.
2.2
Existing Methods and Future Needs
Various model-based methods for clustering gene expression data have been proposed
following the advances of microarray technique. Among them, finite mixture model
methods are the most popular [63, 152]. Finite mixtures of distributions have offered
a sound mathematical-based approach to statistical modelling [96].
A typical routine using these methods consists of two stages. First, a finite mixture
model of the form p(x) = PK
i=1wipi(x, θ) for a random variable x is designed. wi is
the proportion of the corresponding density pi(x, θ) with parametersθ. Assuming that
there is an underlying true model/density, three sets of parameters need to be estimated
or explicitly specified: the number of clusters K, the proportions of clusters w and the
parameter settingsθfor the densities. Then, the optimal parameters for the model are
systemically found, so that the fitted model/density is as close to the true model/density
as possible.
For modelling time series, pi(x, θ) is usually designed with a linear model to capture
the dynamics in time series. Two of the most popular linear models are described here.
2.2.1
Linear Models
In order to design an appropriate model, continuous representation of gene expression
time series are preferred to capture the system dynamics. Many existing models for
fitting gene expression time series fall into one or more of these categories: the spline
regression models [4,16, 63], the mixed effects models [92, 101] and the
literature.
2.2.1.1 Spline model
Spline models have received special attention in the clustering community for their
desirable properties. For example, the use of piecewise low-degree polynomials results
in smooth curves and avoids the problems of overfitting. Take the model in [4] as an
example, cubic polynomials with B-spline basis are used for fitting gene expression
time series data. Cubic polynomials are the lowest degree polynomials that allow for a
point of inflection. The advantage of B-spline lies in that the degree of the polynomials
is independent from the number of points and that curve shape is controlled locally.
A cubic spline consisting ofιparameterised polynomials can be formulated as
y(t) =
ι
X
i=1
AiSi(t), (2.1)
where y is a vector of data, Ai are the coefficients and Si are the polynomials. t is the
parameter which, in the case of time series analysis, refers to time.
For the application to gene expression time series data, it is desirable to use
B-spline basis to obtain smoothing B-spline, as smoothing B-spline use fewer basis
coeffi-cients than observed data points thus avoiding overfitting. Suppose observations are
made at m time points, this imposes the constraintι <m.Using the Cox-deBoor
recur-sion formula [110], the B-spline basis can be calculated as
bj,0(t)=
1, if sj ≤t < sj+1
0, otherwise,
bj,k(t)=
t− sj
sj+k−sj
bj,k−1(t)+
sj+k+1−t
sj+k+1− sj+1
bj+1,k−1(t). (2.3)
As the order of the basis polynomials, k is 4 for cubic polynomial. sj are the knots
where j is in the range of [1, ι+k]. As splines are piecewise polynomials, the abscissa
values of the join points where the polynomials join are called knots. Knots give the
curve freedom to fit more closely to the data. The use of knot vector s particularly
suits microarray data analysis, since it can be defined to be either uniform or unevenly
spaced. According to the purpose of the microarray experiments, it is sometimes
de-sirable to place more knots where biological activity is intense, instead of using the
uniform knot vector as in [4].
For applications, take the mixture model in [4] as an example. Let Y denotes gene
expression data of n genes{yi|i=1...n}, the mixture model is also a mixed effect model
with both cluster specific and gene specific coefficients
yi =Si(µj+γi,j)+εi. (2.4)
µj denotes the average value of the spline coefficients for genes in class j, and γi,j
denotes the gene specific variation coefficients, depending on the class assignment j.
εi is Gaussian noise. Both γi,j and εi are normally distributed with mean zero and
variancesΓjandσ2, respectively.
2.2.1.2 Autoregressive model
Suppose Y = {yi|i= 1,2, ...,n}is a multivariate stationary time series of n variables and
t time points. A p-order vector autoregressive model specifies the value of a variable at
value, the past of the multivariate time series, and noise
Y(t)= B+A
p
X
u=1
Y(t−u)+ε(t). (2.5)
B is a constant matrix of size n× t. ε consists of vectors of residuals {εi|i = 1...n},
each is assumed to be zero mean noise with variance σ2
i. A is a n × n coefficient
matrix representing the dynamic structure. A special case of the p-order
autoregres-sive process, the first-order autoregresautoregres-sive model is often considered when analysing
microarray data for the sake of simplicity [81,102,151]
Y(t)= B+AY(t−1)+ε(t). (2.6)
When A is a constant matrix, this model assumes homogeneity across time. The
pa-rameters are often estimated by optimisation methods such as the maximum likelihood
estimator (MLE) [63,108,141].
2.2.2
Parameter Estimation
For the task of parameter estimation, the maximum likelihood estimator (MLE) is one
of the most extensively used statistical estimation techniques in the literature. For a
variety of models, maximum likelihood functions[63,101,141] have been applied for
estimating parameters of probability distributions. The solution often involves
max-imising the likelihood over each parameter by iteratively applying the
expectation-maximisation (EM) algorithm [35]. Examples abound [4,63,92,94,101].
The EM algorithm alternates between inference about the hidden variables (the
max-imisation step). The expectation step in EM first uses temporary data to represent a
reasonable guess for the hidden variables. Then the parameter estimation proceeds as
if the data is complete, maximising a likelihood function for the parameters. Once
a solution for the parameter estimates is produced, it is used to place the temporary
data values with better guesses. The two-step process is then repeated again until
con-vergence, i.e., when the difference between the parameters updates is smaller than a
predefined value.
For example, EM is used to determine the maximum likelihood estimation for the
model in [4] (see Eq.(2.4)). Cluster memberships are treated as missing data. The
optimisation problem can be decomposed in the following way, assumingγi has been
observed:
p(Y, γi,j|Γ, σ2, µ) (2.7)
=p(Y|γi,j,Γ, σ2, µ)p(γi,j|Γ, σ2, µ)
=Y
i
Y
j
Z( j|i) 1
(2π)niσni exp[−
1
2σ2(Yi−Si(µj+γi,j))
T(Y
i−Si(µj +γi,j))]×
1
(2π)qΓ1/2 j
exp[− 1 2Γj
γTi,jγi,j],
where Z( j|i) is a binary indicator variable that assigns each gene to exactly one class.
The E-step finds the probability of each gene i belonging to cluster j, p( j|i),
p( j|i)= pjp(Yi|γi,j,Γj, σ
2, µ
j)
P
k pkp(Yi|γik,Γk, σ2, µk)
. (2.8)
at the end the cluster probability pj are updated through
pj =
1
n
n
X
i
p( j|i). (2.9)
The two-step process is then repeated until convergence is reached. Each gene i is then
assigned to class j that maximises p( j|i).
2.2.3
Limitations of Existing Methods
It is observed that model-based approaches generally achieve superior performance to
many others [46, 63,133, 153]. Nevertheless, current methods generally rely on
cor-rect model assumption. For example, the autoregressive model as described in Section
2.2.1.2 requires Markov property and stationarity [94]. The former requirement may
not hold for some time series data. Stationarity means the system that generates time
series should be time invariant. Thus the temporal structure of the data and the length
of sampling intervals are not considered in this approach.
Also, rigorous statistical inference is needed for the estimation of model
parame-ters. The parametric nature of existing methods requires an optimisation process which
might be time consuming. The initial values to start the optimisation often need fine
tuned. To be specific, the problem with the quasi-Newton type of optimisation
meth-ods [31] is that the quantities can be estimated only when they satisfy some constraints,
while with EM, some parameters have to be explicitly specified and others have to be
initialised. For example, in [4, 101,151] the number of clusters K has to be known a
priori, which is not practical in microarray data analysis. Moreover, the existence of
local optima of the likelihood function and the requirement for an initial configuration
Apart from the aforementioned issues, clustering algorithms may have other
inher-ent problems. For example, SplineCluster [63] is an efficient hierarchical clustering
program based on nonlinear regression splines. The use of nonlinear spline basis can
accommodate non-stationary time-dependence and unequal intervals in the data.
Start-ing from sStart-ingleton clusters, the idea is to successively merge clusters based on a
po-tential function to form a dendrogram. The algorithm is efficient and straightforward
to visualise. However, as a common problem to all hierarchical clustering methods,
the broadest clusters often contain many scattered genes and can sometimes be hard to
interpret, as later merges often depend on aggregated measures of clusters.
In summary, existing methods have their inherent problems. Multivariate Gaussian
models [44] ignore the time order of gene expression and therefore cannot account
for the correlation structure in time series data [94]. Spline models [4, 63, 92, 94]
and autoregressive models [151], such as the ones presented in Section 2.2.1.1 and
Section2.2.1.2, generally apply EM for parameter estimation, and are computationally
expensive for large data sets. Moreover, there has been extensive use of maximum
likelihood estimator (MLE) [78] for model parameter estimation. By contrast, the
minimum distance estimator (MDE) [10] has been largely ignored.
2.2.4
Emergence of Tight Clustering
Intuitively, tight clustering refers to methods that can be built upon an existing partition
to obtain core patterns that are more easily interpretable. The initial partition can be
obtained either empirically or by using generic algorithms such as the K-means
algo-rithm. Only clusters of closely related genes are then separated from these clusters,
from tight clusters. For example, being in the same tight cluster is strong evidence
that the genes share similar functions. Or, if genes in one functional category are
allo-cated into different tight clusters, one may pursue possible explanation by looking into
these clusters. One possible result of such investigation is that some genes have
un-known functions that affect their expression patterns, hence leads to new gene function
discovery.
In this sense, to obtain tight clusters, some genes should be classified as scattered
genes, if forcing them into clusters will only disturb biologically relevant patterns.
Indeed, the issue of scattered genes has received more attention only recently [71,
138]. Currently, there are few methods to deal with scattered genes with respect to the
analysis of gene expression time series.
To the best of our knowledge, the work of [138] is the first to address the problem
about tight clustering. But it relies on heavy computation due to the nature of random
resampling. For the methods that address the problem of scattered genes, one popular
method is MCLUST [44, 153]. MCLUST is an unsupervised method based on
multi-variate Gaussian models. The models are characterised by their geometric features for
the clusters: shape, orientation and volume. Each time the best models are selected for
the data set being clustered and then the model parameters are estimated by EM. It was
proposed in [45] that outliers can be modelled by adding a Poisson process component
in the mixture model. A recent implementation of MCLUST [47] allows an additional
component of homogeneous Poisson process for modelling scattered genes/noise. This
method relies on correct model specification and the robustness of the parameter
2.3
Proposed Tight Clustering Method
When analysing gene expression time series data, special attention needs to be paid to
the following issues:
• Number of clusters: The main difficulty about the model-based methods con-cerns the number of clusters K, which has to be specified most of the time. It
is particularly problematic for microarray data, which may be evenly distributed
in the gene expression space and thus may not have any straightforward solution
featuring isolated clusters.
• Scattered genes: Recently, it has been proposed to allow a noisy set of genes
not being clustered [138]. In microarray experiments, it is generally expected
that many genes could show uncorrelated variations and are unrelated to the
biological process under investigation. Forcing these genes into clusters will
only introduce more false positives, resulting in distorted clusters and difficulty
in interpretation. It is later experimentally verified that methods that allow for
scattered genes give better accuracy and robustness [133].
• Tight clusters: It is suggested that tight clusters are often more biologically
informative, typically of size 20-60 genes [138]. Conventional methods
pro-duce large and loose clusters, while biologists often need to conduct research
on smaller groups of closely related genes. Therefore, tight clustering has been
proposed for obtaining smaller and tighter clusters from gene expression data.
In this section, we present our partial mixture model algorithm to address the above
challenges in a semi-parametric fashion. Built upon the advantages of MDE and
par-tial modelling, the algorithm performs tight clustering which naturally incorporates
To relieve the system of the tedious parameter optimisation process, our proposed
partial mixture model is based on the MDE instead of the MLE. There are many unique
features of MLE, including its efficiency. However the practical deficiencies of MLE,
besides those issues with its optimisation, are the lack of robustness against noise and
its sensitivity to the correctness of model specification. We discuss in this chapter the
performance of the appealing alternative, MDE, which is less explored in this field.
Inspired by the work of [117,118], MDE is used to relax the system’s dependence on
parameter optimisation. MDE provides robust estimation against noise and outliers,
which is especially appropriate for gene expression data analysis, where data are
of-ten noisy. To show the improvement in performance offered by the new method, we
compare the proposed method to SplineCluster and MCLUST in the experiments.
2.3.1
Minimum Distance Estimator (MDE)
Given a density function f (·), its corresponding parametersθand n variables of interest
xi,i = 1,2, ...,n, we aim to find the optimal parameters ˆθ to approximate the true
parametersθ0by minimising the integrated squared difference
d( f (θ), f (θ0))= Z
f (x|θ)− f (x|θ0)2
dx, (2.10)
which gives
d( f (θ), f (θ0))=
Z
f (x|θ)2dx−2 Z
f (x|θ) f (x|θ0)dx+
Z
f (x|θ0)2dx. (2.11)
The last integralR f (x|θ0)2dx is a constant with respect toθ, thus can be ignored. The
![Figure 1.1: Key processes in the central pathway (adapted from [8]).](https://thumb-us.123doks.com/thumbv2/123dok_us/9733528.474172/24.612.139.478.93.322/figure-key-processes-central-pathway-adapted.webp)
![Figure 1.3: An Arabidopsis circadian gene network of six genes (adapted from Lockeet al [87])](https://thumb-us.123doks.com/thumbv2/123dok_us/9733528.474172/34.612.196.421.92.358/figure-arabidopsis-circadian-gene-network-genes-adapted-lockeet.webp)