22. Pastor A, Vasquez E, Ciscar R and de la Guardia M (1997)Analytica Chimica Acta344: 241}249. 23. Llompart MP, Lorenzo RA, Cela R, PareH JRJ, BeHlanger
JMR and Li K (1997) Journal of Chromatography A757: 153}164.
24. Llompart MP, Lorenzo RA, Rosa A, Cela R, Li K, BeHlanger JMR and Pare JRJ (1997) Journal of Chromatography A774: 243}251.
25. Chee KK, Wong MK and Lee HK (1996)Journal of Liquid Chromatography and Related Technology19: 259}275.
26. Egizabal A, Zuloaga O, Etxebarria N, Fernandez LA and Madariaga JM (1998)Analyst123: 1679}1684. 27. Stout SJ, da Cunha AR and Allardice DG (1996)
Analytical Chemistry68: 653}658.
28. Stout SJ, da Cunha AR, Picard GL and Safarpour MM (1996)Journal of Agriculture and Food Chemistry44: 3548}3553.
29. Stout SJ, da Cunha AR and Safarpour MM (1997)
Journal of AOAC International80: 426}432. 30. Steinheimer TR (1993) Journal of Agriculture and
Food Chemistry41: 588}595.
31. Xiong G, Tang B, He X, Zhao M, Zhang Z and Zhang Z (1999)Talanta48: 333}339.
32. Hoogerbrugge R, Molins C and Baumann BA (1997)
Analytica Chimica Acta348: 247}253.
33. Molins C, Hogendoom EA, Heusinkveld HAG, Van Harten DC, Van Zoonen P and Baumann RA (1996)Chromatographia43: 527}532.
34. Xiong G, Liang J, Zou S and Zhang Z (1998)Analytica Chimica Acta371: 97}103.
35. Donard O, Lalere B, Martin F and Lobinski R (1995)
Analytical Chemistry67: 4250}4254.
36. Lalere B, Szpunar J, Budzinski H, Garrigues P and Donard OFX (1995)Analyst120: 2665}2673. 37. Rodriguez I, Santamarina M, Bollain MH, Mejuto MC
and Cela R (1997) Journal of Chromatography A
774: 379}387.
38. Schmitt VO, de Diego A, Cosnier A, Tseng CM, Moreau J and Donard OFX (1996/7)Spectroscopy13: 99}111. 39. Vazquez MJ, Carro AM, Lorenzo RA and Cela R
(1997)Analytical Chemistry69(2): 221}225.
40. Lopez-Avila V, Benedicto J, Charan C, Young R and Beckert WF (1995)Environmental Science and Tech-nology29: 2709}2712.
41. Onuska FI and Terry KA (1995)Journal of High Res-olution Chromatography18: 417}421.
42. Freitag W and Angew JO (1990) Makromolecular Chemistry175: 181}185.
43. Jordi HC, Savage W and Bichard F (1995) Paper pre-sented atPittcon ’95, Paper No. 1209.
44. Pare JRJ (1991) US Patent 5,002,784.
45. Young JC (1995) Journal of Agriculture and Food Chemistry43: 2904.
46. Bichi C, Beliarab FF and Rubiolo P (1992)Lab 20006: 36
47. Mattina MJI, Berger WAI and Denson CL (1997)
Journal of Agriculture and Food Chemistry45: 4691.
Multistage Countercurrent Distribution
G. Johansson, Chemical Center, Lund, Sweden
This article is reproduced from Encyclopedia of Analytical Science, Copyright ^ 1995 Academic Press.
Theory
The separation of chemical compounds by partition-ing between two liquid phases, so-called liquid}liquid extraction, can be made more effective by using it as a cascade process. One way in which this can be carried out is by multiplicative partitioning, also called countercurrent distribution (CCD). This pro-cess, in which complete partition equilibrium is achieved in each step, is presented schematically in Figure 1. The principle is that two sets of liquid phases, the upper and lower phase, come into contact with each other stepwise. The bottom phases are numbered 0, 1, 2 and so on. The sample to be ana-lysed (fractionated) is included in the Rrst system (containing bottom phase number 0). Before each transfer of the upper phases (to the right in Figure 1) the two-phase systems are equilibrated by mixing and
the sample components are distributed between each pair of phases (each full two-phase system). The par-titioning of a pure substance between the phases of a two-phase system can be expressed either by a parti-tion coefRcient,K, deRned as the ratio of the concen-trations (C) of the component in the phases:
K"C(in phase I)
C(in phase II) [1]
or by a partition ratio,G, deRned as the ratio of the masses (m) of the components in the phase:
G"m(in phase I)
m(in phase II) [2]
KandG are related by eqn [3]:
G"K Volume (phase I)
Volume (phase II) [3]
Figure 1 Principle of CCD. The upper phases are transferred stepwise from left to right. Between each transfer the two-phase systems are equilibrated by shaking and the phases are allowed to settle. Filled circle, substance with smallG value; open circle, substance with largeG value.
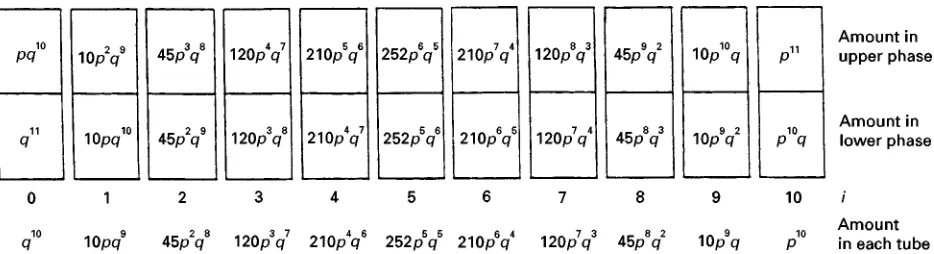
Figure 2 Distribution of a component which partitions in the ratiop/q between the upper and lower phase}after a CCD with 10 transfers. The amounts are given in fractions, i.e.p#q"1.
component in the various phases based on itsGvalue. In the initial two-phase system (number 0) the com-ponent is distributed with the fractionspin the upper phase (phase I) andqin the lower phase (phase II). By deRnitionp#q"1. When the upper phase of system number 0 is combined with the pure lower phase number 1 equilibration of this system will make the transferred fractionpdistribute asp/q("G) giving the fractionp2in the upper phase and the fractionpq in the lower phase. In the new system number 0, with a new upper phase, the remaining fraction q will partition likewise and the equilibration results in the fraction pqin the upper phase and q2 in the lower
phase. The resulting distribution after 10 transfers in the 11 tubes 0}10 is shown inFigure 2. In the same
Rgure the material in each tube (upper plus lower phase) has been calculated. These values are the same as the terms obtained when (q#p)10 is written as a polynomial. More generally, the amount of material Tn,i(in fractions), in tube numberiafter a CCD with ntransfers is given by eqn [4]:
Tn,i" n! i!(n!i)!p
iqn\i [4]
[image:2.568.54.521.558.685.2]Figure 3 The resulting CCD profiles after (A) 10 transfers, (B) 100 transfers and (C) 1000 transfers for substances with the indicated G values.
(1/q)n, eqn [5] is obtained:
Tn,i" n! i!(n!i)!
Gi
(1#G)n [5]
Table 1 The absolute,r, and relative,rrel, peak width
(per-centage of the total number of tubes) of a substance withG"1 after a CCD withn transfers
n r (no. of tubes) rrel(%)
20 13 67
50 21 42
100 30 30
200 42 21
500 67 13
1000 95 9.5
2000 134 6.7
[image:4.568.50.278.599.710.2]5000 212 4.2
Table 2 Number of transfers,n, in a CCD necessary to separ-ate two substances, 1 and 2, with a given separation factor
"K1/K2. The volume ratio is chosen in such a way (eqn [7]) that
G1;G2"1
G1 G2 n
2 0.709 1.414 264
3 0.577 1.732 110
4 0.500 2.00 70
9 0.333 3.00 30
16 0.250 4.00 20
25 0.200 5.00 16
36 0.167 6.00 14
49 0.143 7.00 12
81 0.111 9.00 10
400 0.050 20.0 6
2500 0.020 50.0 4
Gvalues of 0.05, 0.1, 0.25, 0.5, 1, 2, 4, 10 and 20 are shown. The resolution of components with various Gvalues increases with the increase in the number of transfers. This is due to the fact that the difference in the position (tube number) of the peaks (with given Gvalues) is proportional to the number of transfers, while the peak width only increases with the square root of the number of transfers.
The width of a peak r, covering 99.7% of the compound, can be approximately calculated using eqn [6]:
r"6(nG
(1#G) [6]
The relative width of a peak,rrel"r/n, is given in
Table 1forG"1 and a number ofnvalues. The most effective separation of two components, with partition coefRcients K1 and K2, is achieved when their distribution peaks are oriented symmetric-ally around the middle of the tube train, i.e. tube i"n/2. This, as can be seen inFigure 3, is equal to the relation G1"1/G2 which can be written as
G1;G2"1. By combining this relation with eqn [3]
the volume ratio,V, to be used for optimal separation can be calculated as shown in eqn [7]:
V" 1
(K1K2
[7]
The ratio between the K values of two substances 1 and 2 is called the separation factor, , and is a measure of the separability of the substances. In Table 2 the number of transfers necessary for vir-tually complete (more than 99.5%) separation has been calculated for variousvalues.
The G value of a component which has its max-imum peak value in tube numbernL afterntransfers is given by the approximate eqn [8]:
G"nL/(n!nL) [8]
TheGvalue can also be obtained by comparing the amount of a substance in two consecutive tubes, numbersi and i#1. By combining the expressions forTn,iandTn,i#1obtained from eqn [5] theGvalue is obtained as in eqn [9]:
G"Tn,i#1 Tn,i
i#1
n!i [9]
By following the apparentG values over a distribu-tion peak the presence of several substances differing slightly in theirG values can be detected.
Various Modes of Multiplicative
Partitioning
The basic process of CCD has been described, but it can be varied in a number of ways.
Single Withdrawal Procedure
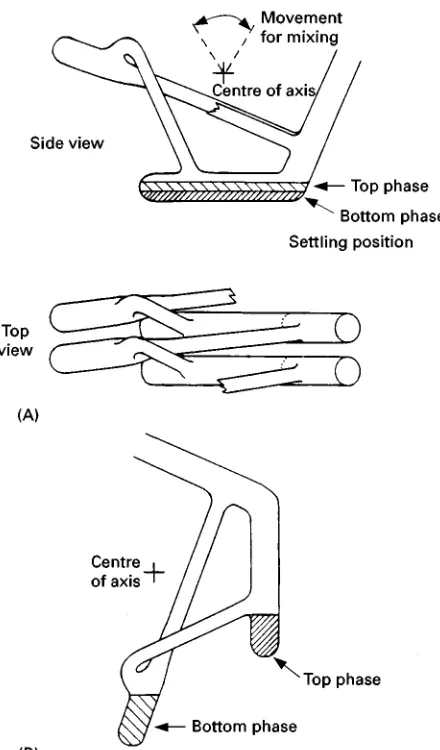
Figure 4 Section of the all-glass apparatus for CCD construc-ted by Craig. (A) Two segments (or tubes) are shown from side and top views. Normally 50}1000 tubes are connected and placed on a horizontal rack which allows simultaneous mixing of all tubes. (B) By turning the axis the upper phases can be decanted. When returning to the original position the upper phases are transferred to the neighbouring tube.
O’Keefe Partitioning
The multiplicative partitioning can be carried in such a way that a new portion of the solute mixture to be separated is added after each transfer step. This method of carrying out the partitioning is called O’Keefe partitioning. Several two-phase systems are arranged in a row and a solute sample is included in the centre system. After equilibration and settling all the upper phases are moved one step to the right and the overSowing upper phase is collected. Then all the lower phases are moved one step to the left and the one to the extreme left is collected. The remaining set is completed with one fresh lower phase (to the right) ane one fresh upper phase (to the left) to restore the original number of systems. After addition of a new portion of solute to the centre system the next cycle takes place. Substances withG'1 will be recovered in the upper phases collected to the right and substan-ces with G(1 in the lower phases removed to the left. This process is used when large amounts of substances are to be separated. The number of sys-tems is usually small, e.g. 7, 9 or 11.
A similar process, called Watanabe}Morikawa partitioning, differs in that the ongoing addition of solute mixture is done in theRrst system of the row. This is useful when only components with high or low G values are to be isolated.
Description of Some CCD Apparatus
CCD with only a few transfers (up to 10) can easily be carried out by using a set of separating funnels for mixing, settling and phase separation. For small phase volumes, 0.5}5 mL, the separating funnels can be replaced by test tubes and the upper phases can be transferred with the aid of a pipette. For CCDs with more than 10 transfers it is strongly advised that some kind of automatic apparatus is used. Some examples of such apparatuses are presented next.
All-Glass CCD According to Craig
Several glass units, allowing mixing, settling and phase transfers (Figure 4) are arranged in batteries on a horizontal axis. Movement about this axis can be used to gently mix the phases, to put the glass units in position for settling of the phases and for decanting the upper phases, respectively. The times for each part of the CCD cycle as well as the number of transfers can be programmed. Standard types of such machines allow 50 transfers while more advanced machines may be used for up to 1000 transfers. The glass units can be obtained in various sizes but stan-dard tubes have space forc. 2 mL (Rxed amount) of lower phase and up to 5 mL of upper phase.
Thin-Layer CCD According to Albertsson
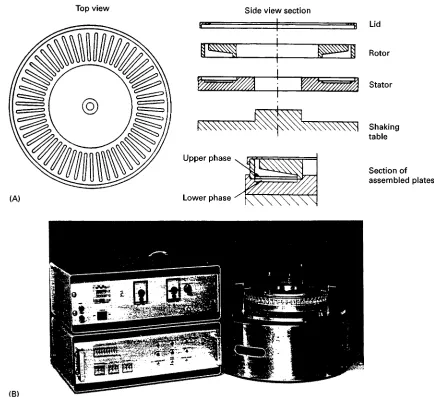
Figure 5 Thin-layer CCD apparatus according to Albertsson. (A) The two discs of polyacrylic plastic contain matching cavities for the upper and lower phases and by rotation the upper plate can move all upper phases relative to the lower ones. See text for further details. (Adapted from Albertsson P-A> (1986)Partition of Cell Particles and Macromolecules, 3rd edn, p. 126. New York: Wiley (interscience), by permission.) (B) A thin-layer CCD machine constructed by Albertsson.
cavities of the rotor and therefore can be transferred relative to the lower phases by rotating the upper plate. The two plates are placed on the shaking table of a machine which also contains a drive for the upper plate rotation. The phase systems are added to each container (chamber) via openings in the upper side of the rotor. These openings, during the run, are covered with a ring-formed lid. The shaking and settling peri-ods and number of transfers are controlled by an automatic unit. After the CCD run is completed the two-phase systems can be collected by use of a frac-tion collector. This is a circular rack with the same number of test tubes (4 mL) as chambers. The rack is placed over the inlet holes and is inverted together with the plates which are then emptied.
Centrifugal CCD According to A>kerlund
Figure 6 Centrifugal CCD according to A>kerlund. A section of the circular separation unit is shown. It is composed of four units: c, the outer ring with cavities for the lower phase: d, the inner plate with cavities for the upper phase; e, the lid; and f, an O-ring for sealing. The position of the two-phase system during centrifu-gation is shown, with the upper phase, a, and the lower phase, b. (From Johansson G, A>kerlund H-E and Olde B (1984)Journal of Chromatography 311: 277, by permission.)
Figure 7 Countercurrent distribution of proteins and cell or-ganelles. (A) Distribution of the enzymes hexokinase (0), 3-phosphoglyceratekinase (- - -), and phosphofructokinase (-)-)-)) when an extract of baker’s yeast was applied to a CCD with 55 transfers. The textile dyes Procion olive MX-3G or Procion yellow HE-3G were used as PEG-bound affinity ligands enriched in the mobile upper phase. Composition of two-phase system: 88% (w/w) water, 7% (w/w) dextran 500, 5% PEG with
Mr"8000, including dye-PEG, 1% of total PEG 50 mmol L\1
sodium phosphate buffer, pH 7.0, 0.2 mmol L\1
ethylenediamine-tetraacetic acid and 5 mmol L\12-mercaptoethanol. Volume
ra-tio, 1.5. Temperature, 33C. A centrifugal CCD apparatus was used with 5 min shaking and 3 min settling (centrifugation). (Adapted from Johansson G, Joelsson M and A>kerlund H-E (1984) Journal of Chromatography 298: 483, by permission.) (B) Frac-tionation of photosynthetic particles, chloroplasts, from spinach using a thin-layer CCD apparatus with 56 transfers and a dex-tran}PEG two-phase system. Peak I, intact chloroplasts sur-rounded by their envelope; peak II, naked thylakoid membranes (class II chloroplasts); peak III, choloroplasts surrounded by a ‘bag’ of plasma membrane also containing cytoplasm, mitochondria and peroxisomes. (From Larsson C, Collin C and Albertsson P-A> (1971)Biochimica Biophysica Acta 245: 425, by permission.)
phases by rotation of the inner plate when the whole system is still spinning and the phases are in a vertical position. After the transfer the centrifugation is stop-ped and a new cycle begins with the shaking process. After the run the phases are collected by pipette.
Continuous apparatus, such as extraction columns and coil planet centrifuges, also corresponds to a CCD process but differs in that no discrete steps are used and equilibrium is not reached.
Analytical Applications
Many metal ions can be separated by using various kinds of water/organic solvent systems for counter-current distribution. Metal chelators, such as dithizone, 8-quinolinol, cupferron, dimethylglyoxime and acetylacetone, are used speciRcally to extract metal ions into the organic phase. Likewise certain anions such as halides, thiocyanate or nitrate can be used. For example, uranium and plutonium have been separated by using an aqueous phase containing 8 mol L\1nitric acid.
Biochemical Applications
CCD has been used for fractionation of a number of biochemical substances and cellular particles as well as cells and viruses. Peptides, proteins and nucleic acids have been fractionated by using aqueous two-phase systems composed of water and the two poly-mers dextran and poly(ethylene glycol) (PEG). The partition coefRcients of the solutes can be adjusted by addition of various salts to the two-phase system and
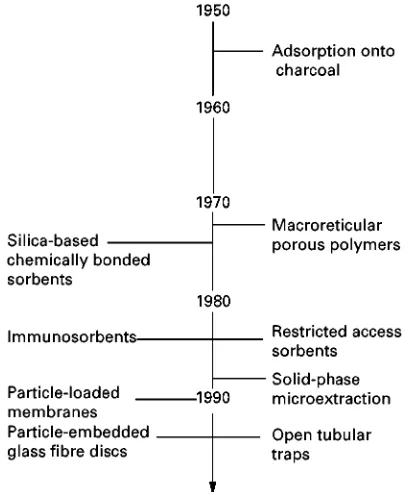
Figure 1 Time line showing the general evolution of solid-phase extraction techniques.
Biological membranes, cell organelles, whole cells and viruses can be fractionated by CCD in the same kind of systems. In this case, however, the particles partition between the two liquid phases and the inter-face between them. The CCD is therefore usually carried out using a stationary interface. This is achieved by using a smaller volume of the lower phase than is needed toRll the lower cavities. There-fore, a portion of the upper phases will also be sta-tionary. TheGvalue satisfying eqn [5] is in this case deRned as the amount of a pure compound, at equi-librium, in the mobile part of the upper phase divided by the amount of the compound in the rest of the system (stationary upper phase, interface and lower phase). Examples of CCD of proteins and of chloro-plasts, the photosynthetic organelle in green plant cells, are given inFigure 7.
See also: II/Chromatography: Countercurrent Chroma-tography and High-Speed Countercurrent Chromato-graphy: Instrumentation.
Further Reading
A>kerlund H-E and Albertsson P-A> (1994) Thin-layer countercurrent distribution and centrifugal countercur-rent distribution apparatus. Methods in Enzymology
228: 87}99.
Craig LC (1962) Countercurrent distribution. In: Florkin M and Stotz EH (eds) Comprehensive Biochemistry, vol. 4, pp. 1}31. Amsterdam: Elsevier.
Hecker E (1995) Verteilungsverfahren im Laboratorium. Weinheim: Verlag Chemie.
Morris CJOR and Morris P (1976)Separation Methods in Biochemistry, 2nd edn, pp. 638}702. London: Pitman.
Solid-Phase Extraction
C. F. Poole, Wayne State University, Detroit, MI,
USA
Copyright^ 2000 Academic Press
Solid-phase extraction is a method used to isolate analytes from a gas,Suid or liquid by their transfer to and retention on a solid-phase sorbent. After separ-ation of the sorbent from the sample the analytes are recovered by elution using a liquid or Suid, or by thermal desorption into the gas phase. If the analytes are recovered from the sorbent in aRnal volume that is only a fraction of the sample volume, then concen-tration as well as isolation is achieved. In addition, if the sorption step, any subsequent rinse steps, and the elution conditions are selective for retention and re-covery of the analyte, then matrix simpliRcation is achieved. Isolation, concentration and matrix
simpli-Rcation are the primary goals of solid-phase extrac-tion.
Probably the earliest application of solid-phase ex-traction was the use of charcoal-Rlled columns in the 1950s to isolate organic contaminants from surface waters for toxicity evaluation. The large volume of water generally sampled (more than 1000 L over sev-eral days) precluded the use of liquid}liquid extrac-tion techniques. The subsequent evoluextrac-tion of solid-phase extraction techniques is summarized in Figure 1.
The introduction of macroreticular porous poly-mers in the early 1970s was responsible for rekindling interest in solid-phase extraction and extending its scope to air sampling and the isolation of drugs from