of proteins and other macromolecules. Continued advances in membrane science and manufacture and engineering improvements to modules and systems will allow a greater penetration of this technology in a variety of industries in the future.
See also: II/Membrane Separations: Filtration; Micro-filtration.
Further Reading
Bhave RR (ed.) (1991) Inorganic Membranes. Synthesis, Characteristics and Applications. New York: Van Nos-trand Reinhold.
Cheryan M (1998) UltraTltration and MicroTltration Handbook. Lancaster, PA: Technomic.
Cheryan M and Alvarez J (1995) Membranes in food pro-cessing. In: Noble RD and Stern SA (eds) Membrane
Separations. Technology,Principles and Applications, p. 415. Amsterdam: Elsevier.
Cheryan M and Rajagopalan N (1998) Membrane treatment of oily streams. Wastewater treatment and waste reduction. Journal of Membrane Science 151: 15}38.
Ho WSW and Sirkar KK (eds) (1992)Membrane Hand-book. New York: Chapman and Hall.
Hsieh HP (1996)Inorganic Membranes for Separation and Reaction. Amsterdam: Elsevier.
Lloyd DR (ed.) (1985)Materials Science of Synthetic Mem-branes. Washington, DC: American Chemical Society. Matsuura T (1994)Synthetic Membranes and Membrane
Separation Processes. Boca Raton, FL: CRC Press. Mulder M (1991)Basic Principles of Membrane
Technol-ogy. Norwell, MA: Kluwer Academic Publishers. Singh N and Cheryan M (1998) Membrane technology in
corn reRning and bio-products processing. Starch/ Sta(rke50: 16}23.
PARTICLE SIZE SEPARATION:
Electric Fields in Field Flow Fractionation
See II / PARTICLE SIZE SEPARATION / Field Flow Fractionation: Electric Fields
PARTICLE SIZE SEPARATION
Electrostatic Precipitation
J. J. Harwood, Tennessee Technological University, Cookeville, TN, USA
Copyright^ 2000 Academic Press
Introduction
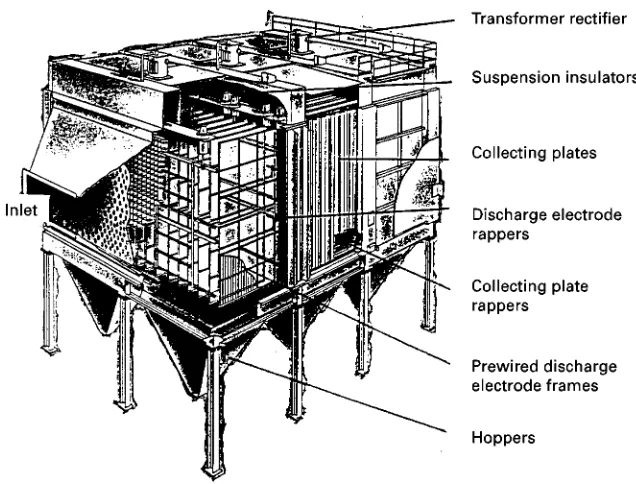
Electrostatic precipitators (ESPs) are the most com-monly used devices for the removal ofRne particles in exhaust from industrial and utility processes. Wire-plate ESPs consist of three or more sections of arrays of large (e.g., 15 m;5 m), grounded metal collector plates between which are situated wire or other nar-row, high voltage electrodes (Figure 1). Less com-monly, a wire-cylinder electrode conRguration is used. Particles entering the Rrst section are quickly charged by ions generated by the plasma coronas around the wires. (Current does pass between the
electrodes, hence the term ‘electrostatic’ is not really accurate, but indicates the small current-to-electrode area.) The charged particles are drawn toward and deposit upon the collector plates, which are period-ically cleaned by mechanical ‘rapping’. This method is very efRcient in removing particles in the 1}'10m range. The most common use of ESPs is in control of exhaust from coal combustion utilities. Precipitators are also used in the cement, ore smelt-ing, steel production, pulp and paper manufactursmelt-ing, and chemical processing industries, and in waste combustion utilities. Small units are used in cleaning domestic and workplace air, and have been con-sidered for use in animal production facilities.
Figure 1 Rigid frame electrostatic precipitator. (Reproduced with permission. Copyright Wheelabrator Air Pollution Control Inc.)
the commercial application of this phenomenon by constructing an electrostatic precipitator to control fumes at a lead smelter. Unfortunately, lead oxide is too resistive to allow sufRcient particle charging with a constant DC discharge, and the application failed. The Rrst successful commercial application of elec-trostatic precipitation was by F. G. Cottrell, who designed an ESP to remove acid mist from sulfuric acid plants. Cottrell facilitated the establishment of the technique by developing the Rrst suitable high-voltage power supplies. ESP particle control became widely used between 1910 and 1930.
Removal of small particles from gas streams is important for process, health, and environmental rea-sons. Centrifugal separators are used to remove par-ticles larger than 10m; fabricRlter ‘baghouses’ are used to removeRner particles and constitute a viable alternative to ESPs. Capital costs are similar for bag-houses and ESPs; however, maintenance, including energy cost, is lower with ESP units.
The increased control of sulfur and nitrogen oxides in the 1970s, and recent calls for the control of very Rne particles, challenge scientists and de-signers concerned with the ESP technique. Use of low sulfur coal reduces Sy ash resistivity below that ap-propriate for conventional ESP operation. Treatment by the addition of limestone to coal increases the particle load on precipitators. Conventional precipi-tators do not efRciently remove submicron particles. As will be discussed in this chapter, researchers are developing means of adapting ESP design and
opera-tion to meet the challenges of improved environ-mental control.
Characteristics of Fly Ash
Hart et al. recently performed a comprehensive in-vestigation of the composition and mineralogy ofSy ash from three utility boilers. Using instrumental neu-tron activation analysis and X-raySuorescence spec-troscopy, they found Si, Al, Fe and Ca to account for more than 90% of major elements from all three boilers. Scanning electron microscopy with energy dispersive spectroscopy revealed successive ESP ashes to be composed mainly of spherical particles which decrease in average diameter with increasing distance from the boiler. Concentrations of As, Co, Cr, Ni, Mo and Sb increased from bottom ash through the sequence of ESP ashes. These trace elements are vola-tilized and transported to cooler regions, where they condense or are adsorbed ontoSy ash particles. The majorSy ash mineral phase found by these and other researchers is quartz (SiO2) with magnetite (Fe3O4),
anhydrite (CaSO4), and mullite (Al6Si2O13) among
other minerals commonly present.
Resistivity () is the most important property of material to be collected by an ESP. The optimum range of resistivity is 104}1011-cm. On collection,
low resistivity particles (4103-cm) release charge
to the collector plate and may be re-entrained. Par-ticles with'1011-cm insulate the collector plate,
Figure 2 Effect of surface film resistivity on flue-dust resistivity. (Reproduced with permission from Busby HGT and Darby K (1963) Journal of the Institute of Fuel 36(268): 184. Copyright The Institute of Fuel).
within the dust layer to cause a counterproductive ‘back corona’.
Two types of resistivity may be important in par-ticle collection in an ESP. Ions collected at the surface of particles control ‘surface resistivity’, which domin-ates at temperatures below 2503C. As indicated in
Figure 2, particle resistivityRrst increases with tem-perature, then decreases. Removal of the surfaceRlm (adsorbed water) by heating in vacuo at 3603C eliminates this initial increase in resistivity. Above 2003C, removal of adsorbed material no longer af-fects resistivity, and at higher temperatures resistivity is attributed to ions in the bulk of the particles,
‘volume resistivity’. Both types of resistivity are prim-arily functions of Na#and Li# ion concentrations, and in some cases K#and I\ions.
Two aspects of the }T relationship affect ESP collection efRciency. First, the maximum resistivity ofSy ash occurs within the range of temperature at which ESPs are commonly operated, 130}1803C. Second, SO3, produced from sulfur in coal,
Operation at non-optimal temperature can be avoided by lowering the temperature, but this re-quires energy input to a cooling device, and also can lead to difRculties with corrosion due to condensa-tion. The temperature of the exhaust is normally cooled by heat exchange in an air pre-heater prior to injection into the precipitator, hence the name ‘cold-side’ precipitator. ‘Hot-‘cold-side’ precipitators operate at temperatures as high as 3703C; resistivity is often reduced to a desirable level of 2;1010-cm at above
3153C. However, difRculties are encountered with the greater volume of the hot gas, and these units require more careful construction.
More commonly, resistivity of high-resistance ash is lowered by chemical conditioning.
Theoretical and Practical Aspects
of Electrostatic Precipitation
Charging of Particles
The corona surrounding a discharge electrode of an ESP is a gas plasma of electrons and cations. The cations are drawn into the electrode, which is biased negative. The electrons are repelled into the interelec-trode space where, within one centimetre travel, they ionize gas particles. These gas particles are drawn toward the grounded collector electrodes. On the way, many of them collide with and attach to the particles to be collected, charging them. The charged particles are then drawn towards the collector elec-trodes. This particle charging is efRcient. Typical charging time is 5 ms; typical residence time in an ESP is 2}5 s.
Charging processes are of two types:Reld charging, where ions moving with the electricReld charge the particles, and diffusion charging, where charging is due to collision with ions moving with random ther-mal motion. The types are distinguished to facilitate mathematical description. Field charging is dominant in charging particles with radius (a) greater than 0.5m; diffusion charging is dominant with
(0.2m particles. Both mechanisms are important in the intermediate size range.
The charge on an ion at timet(q(t)) resulting from
Reld charging, derived by Pauthenier and Moreau-Hanot is:
q(t)"12
#20a
2E 0
t t#
where is the relative dielectric constant; 0 is the
permittivity of free space (C2N\1m\1);ais the
par-ticle radius (m);E0is the electricReld (V m\1);tis the
time (s) and:
"40/N0eb
whereN0is the number density of particles (m\3);eis
the electronic charge (C); b is the ion mobility (m2s\1V\1). (This and other formulae are in the
form presented in Oglesby and Nichols (see Further Reading.) The corresponding expression for diffusion charging presented by White is:
q(t)"akT
e ln
1#avN0e2t)
kT
wherekis the Boltzmann’s constant (J K\1);vis the
rms thermal velocity of ions (m s\1);Tis the absolute
temperature (K).
Smith and McDonald derived an expression for combined diffusion and particle charging. They divided the surface of a particle being charged into three regions: region I, where the electricReld of the particle and that within the ESP duct intersect, sweep-ing ions onto the particle surface; region II, where the radial component of the electricReld of the particle dominates; and region III, where the electricReld of the particle and duct are in the same direction, sweep-ing ions away from the particle. Givsweep-ing the electric
Reld about the particle,Er, as:
Er"E0cos
1#2!1
#2 a3
r3
!ne 40r2
where Er is the radial component of electric Reld
(V m\1); E
0 is the external Reld (V m\1); r is the
radial distance to point of interest (m); is the azi-muth angle measured from the z axis (toward the discharge electrode) (rad); ne is the particle charge (C); these researchers produced a combined charging rate equation: dq dt" dq dtI# dq dtII# dq dtIII
"(N0Anse2/40)
1!n ns
2
#ea2vN0
2 L/2
F0
exp!
ne2(r0!a)
40kTar0
#[3ar20!r30(#2)#a3(!1)]eE0cos
kTr2
0(#2)
sind
#ea2vN0
2 exp(!ne
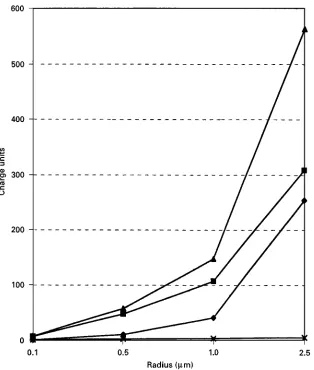
Figure 3 Modes of particle charging.}䉬}, field charging;}䊏}, diffusion charging;}䉱}, total charge;};}, Boltzman charge AC.
(Data from Kanazawaet al. (1993) Journal of Electrostatics 29: 193. Copyright: Elsevier Science.)
where A is the surface area of the particle on which ions may impinge (m2); n
s is the saturation
charge;0is the greatest angle of region from z axis
(rad).
This expression agrees well with measured charg-ing rates.
Representative saturated particle charge as a func-tion of particle radius is presented in Figure 3.
Chemical Conditioning
Conditioning can enhance collection efRciency by re-ducing resistivity to prevent back corona, increasing cohesivity of the collected layer, enhancing the elec-tricReld by increasing the space charge contribution (see below), and increasing agglomeration of small particles. Some exhaust gas conditioning methods which have been used to enhance ESP performance are cooling by in-leakage of cold air, heat exchange to a waste heat boiler, evaporative spray, and chemical
conditioning. The latter has proven most popular in utility applications.
Most commonly, sulfur is combusted and the SO2
produced is catalytically converted to SO3. On
com-bination with the combustion exhaust, SO3
hydro-lyses to produce H2SO4, sulfuric acid. The acid
de-posits efRciently on Sy ash particles, decreasing the particle surface resistivity. SO3is added at levels of
1}10 ppm; up to 30 ppm can be added without signif-icant increase in sulfur emission from the ESP. SigniR -cant SO2 is produced on combustion of even low
sulfur coal, but only about 1% is converted to the useful SO3. Knowledge of the importance of SO3was
initially gained through experience with conditioning of smelter dusts by sulRde ores.
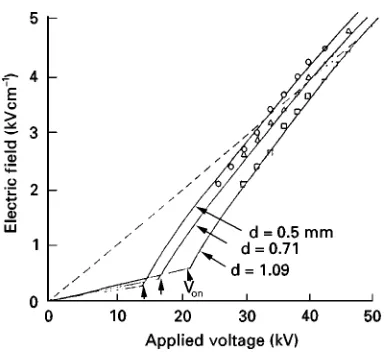
Figure 4 Electric field on the collector electrode just under the corona wire as voltage is applied; d, discharge electrode dia-meter. 2D"20 cm; *, d"0.5 mm; 䉭, d"0.71 mm; 䊐, d"1.09 mm. (Reproduced with permission from Ohkuboet al. 1985.)
Figure 5 Pilot ESP V}I curves before and after development of severe back corona.*, 1 hour after startup;䊐, 8 days after startup. (Reproduced with permission from DuBard and Nichols 1990.)
recovered ESP performance. As NH3increases
collec-tion efRciency with both low and high resisitivity boiler ash, and may or may not decrease resistivity, it is thought that this conditioner functions by furnish-ing salt particles which increase the space charge contribution to the electric Reld and, by increasing dust cohesiveness, reduce rapping losses.
Characteristics of the Corona Discharge
As voltage applied to a wire discharge electrode is increased, visible discharge points, ‘tufts’, begin to appear dispersed along the wire. Eventually the tuft pattern stabilizes, appearing asRngers which elongate and retract at 1}10 Hz and remain at somewhatRxed locations along the wire. This stabilization of the corona is indicated by a distinct increase in the slope of the electric Reld vs. applied voltage curve (Figure 4). Peek determined a semi-empirical expres-sion for the corona onset voltage (Vc) in air:
Vc"3;106am(1#0.03(/a)ln(b/a)
where Vc is the corona onset voltage (V); a is the
radius of discharge electrode (m);mis the wire rough-ness factor (0.5}0.9);is the relative air density;Pis the air pressure (Pa).
This discharge produces a current density (with respect to the area of the collector electrode) in the order of 150 nA cm\2. While the ionic
composi-tion of the interelectrode space has not been well studied, ionization properties indicate that this cur-rent is carried by oxygen, sulfur dioxide, and water, which are negatively charged by the electron current
near the corona, and by particles ionized by these primary ions.
The Electric Field
Current vs. voltage curves (Figure 5) are commonly used in monitoring the operation of ESP. For best collection efRciency, ESP units are operated at the maximum voltage which produces a stable current. A discussion of operation monitoring of ESPs is given by DuBard and Nichols.
Much effort has been given to the task of determin-ing the electricReld within an ESP. Besides the burden of inability to solve known expressions analytically for theReld in a wire-plate electrode system, this task is made difRcult by uncharacterized changes in the collector electrode as the dust layer collects on it. The advent of high-speed computing has allowed satisfy-ing solution of theReld equations for a clean system. Cristinaet al. present a modern method of deter-mining the electric Reld. These researchers use the following expressions for charge and electric potential:
)( )"!Q
)(Q )"0
whereis the permittivity of air (C2N\1m\1);Qis
the ionic charge density (C m\2); is the electrical
potential (V).
is used to balance the electricReld and charge density of elements in an array of triangular elements super-imposed on the inter-electrode space. These elements are each speciRed to have a constant ionic charge density. The contribution of space charge by ionized particulate matter is disregarded in this treatment. In the more dust-laden regions of an ESP, particulate matter is found to alter electricReld slightly.
Equipotential Reld maps developed by this treat-ment show a fairly linear decrease in potential from the discharge to the collector electrode, with circular
Relds to about one-third distance across the channel (from 57.5 kV to 20 kV), then equipotential Reld lines parallel to the collector. Near the collector elec-trode, at about Rve-sixths the channel width, the potential has decreased to 5 kV. Electric Relds of adjacent discharge electrodes interact, producing bell-shaped electricReld patterns radiating from each wire to the adjacent collector plates.
Back Corona
In working ESPs, a portion of the applied potential is dropped across the resistive layer of the collected dust. As the dust layer thickens the resistance, hence voltage drop, across the layer increases. If the dust resistivity is high ('1010-cm), eventually
the Reld becomes great enough to cause electrical breakdown of gas within the dust layer, generating a back corona. Electrons are ripped from the gas, and the resulting positive ionsSow into the inter-electrode space, where they attach to negatively charged par-ticles. The diminished net charge of the particulates leads to greatly diminished collection efRciency; re-entrainment also occurs. A back corona occurs with an electricalReld strength across the dust layer (resist-ance of layer times current) of 8}12 kV cm\1.
A back corona can be visually observed as a glow on the collection surface. It is also characterized by an increase in corona onset voltage followed by an in-crease in current for a given applied voltage as com-pared with a correctly functioning system (Figure 5). The dust layer acts as a resistive-capacitative element in having a lag time before discharge. Both intermit-tent and pulse energization take advantage of this lag time to allow the application of high voltage without the occurrence of back corona.
Current Density
The electric Reld at ESP collection surfaces is not uniform due to both the electrode}collector geometry and to irregular resistance resulting from uneven dust layer thickness. The parameter determined in study-ing the situation at the collection surface is current
density,j (nA cm\2). With poor distribution of
cur-rent over the dust layer, collection efRciency is dimin-ished. Re-entrainment can occur in regions of low current density, and high local currents can lead to back corona even with a low average current. Land-hamet al. measured the current density distribution in a pilot scale ESP by inserting a segmented copper electrode sensor board into a collector electrode. Conventional, intermittent, and pulse energization with both wire and barbed-strip discharge electrodes were investigated. (Barbed-strip electrodes are used by some manufacturers to force a more uniform cur-rent distribution at the collector.)
Intermittent energization (IE) is achieved by inter-rupting the rectiRer circuit output for one to twenty half cycles of the supply power line. A baseline volt-age is maintained, with relatively broad pulses super-imposed. In pulse energization (PE), pulses of 1s to 1 ms width and up to!75 kV are superimposed on a DC voltage set just below the ‘spark limit’. Both techniques have been found to save energy and to reduce the incidence of back corona. PE is more effective in countering problems with low resistivity dust. Dubard and Nichols set IE to one full AC cycle on and four off (duty cycle 0.2), and PE base voltage
!20 kV with 50 Hz, &125s width pulses of
!25 kV. Conventional full-wave rectiRed energiz-ation (CE) was set at about!35 kV.
These researchers found that CE and PE give Gaus-sian current density proRles across the sensor plate surface, while IE gives a more even, but lower magni-tude distribution. Under good operating conditions (clean collector surface), PE had less collector area above dust layer breakdown current than CE or IE, with 96% useful area as compared to 83% and 86%, respectively. Under severe back corona conditions, PE maintained 84% useful area, CE 12%, and IE 54%. Similar results were obtained with both barbed-strip and wire electrodes. The results indicate a linear rela-tionship between the increase in collector area receiv-ing useful values of current density and collection efRciency.
Among alternative discharge electrode designs, barbed plate discharge electrodes appear more effective in producing uniform current distribu-tions (see McKinney and Davidson). This design may also have some advantage with respect toSow turbulence.
Flow
Besides electricReld and current density distribution, gasSow is important in ESP performance. ESPSow velocities vary between 0.2 and 2.0 m s\1. Schwab
1.22 and 1.52 m s\1. Lower velocities diminish the
turbulent mixing which brings small particles into the low Sow region near the collector electrode; higher velocities overwhelm electrostatic attraction of particles to the collector electrode, and can lead to re-entrainment.
Flow within an ESP is inherently turbulent due to high gas Sow velocity, which typically results in a Reynolds number of about 10 000}Rve times that at which turbulentSow replaces laminarSow. Turbu-lence in ESPs is complicated by Sow obstructions }discharge electrodes and collector stiffening bafSes and connectors, and by a non-uniformSow proRle at the ESP inlet. At low velocities (:0.5 m s\1)
turbu-lence resulting from the ion current between dis-charge and collector electrodes (ionic wind) contrib-utes signiRcantly. The Sow regime in an ESP is thus seen to be quite complicated. BafSes within the ESP duct and porous plates at the inlet and outlet are employed to create uniformSow.
Schwab and Johnson have produced a computer model based on Navier}StokesSuidSow equations as an alternative to traditional reduced scale physical models for Sow design. The model can be used to determine inlet plate perforation patterns which pro-duce uniform Sow without highSow near the duct walls.
Collection Ef\ciency
Most important in ESP operation is the particulate collection efRciency, , the fraction of particulates removed. Around 1920, Deutsch and Anderson inde-pendently derived an expression for , now com-monly referred to as the ‘Deutsch equation’:
"1!exp
!AQe
whereAis the collector electrode area (m2);Qis the
volumetric gas Sow rate (m3s\1);
e is the
effective particle migration velocity (m s\1).
EfRciency is also expressed as fractional particle penetration,P"1!.A/Qis the speciRc collection area (SCA), the parameter of importance in sizing an ESP. Assumptions of the Deutsch equation are that particles are instantaneously fully charged and accel-erated, turbulent and diffusive forces cause particles to be distributed uniformly in any cross section of the precipitator, the velocity of the gas stream does not affect the migration velocity of the particles, particle motion is governed by viscous drag where Stokes’ Law applies, the effect of collision between ions and neutral gas molecules can be neglected, and there are
no disturbing effects such as erosion, re-entrainment, uneven gas Sow distribution, sneakage, or back co-rona. A number of researchers have adjusted the Deutsch equation to account for neglected factors. Especially questionable is the assumption of complete turbulent mixing (for instance, see Zhibin and Guoquan). The Deutsch model represents one mixing extreme, with the other extreme being laminarSow (no turbulence). The Deutsch model tends to underestimate
for particles with diameter less than about 1m, and overestimates the collection of larger particles.
The Matt}OG hnfeldt modiRcation attempts to ac-count for variation in particle size distribution:
"1!exp
!AQk
mwhere k is the particle migration velocity (m s\1);
m is an exponent which depends on particle size distribution.
An m of 0.5 is commonly used with Sy ash or cement dust; increasing values can be used withRner size distributions.
In comparing ESP performance under varying conditions, the migration velocity is more useful than
, being independent of ESP collection area and gas
Sow rate. An important consideration in using
values is that migration velocity of large particles decreases at a much lower rate with increasing gas
Sow (or decreased plate size) than that of small par-ticles, hence though small particles will be less efR -ciently collected, measured can increase with gas
Sow rate.
Migration of charged particles can be treated theoretically. Hall presents the expression:
"40kaE0EpCDf
6
wherekis 3/(#2);is the dielectric constant of ash (C N\1m\1);E
0is the particle charging electricReld
strength (V m\1);E
pis the particle collecting electric Reld strength (V m\1);ais the particle radius (m);Cis
the Cunningham slip correction; D is the factor to account for diffusion charging ofRnes;fis the factor accounting for gas turbulence and free electron charg-ing; is the gas viscosity (Pa s); is the fractional particle saturation charge.
Cis used to adjust diffusion of particles with size comparable to mean-free path of gas molecules. The reader can understand that empirical estimation of
The Deutsch model is often used in determining a minimum speciRc collection area in sizing precipita-tors. Extrapolation from performance of pilot or other ESPs should be made only with similar designs and similar dusts.
Computer Modelling
Several comprehensive models of particle collection in wire-plate ESPs are available, including the Southern Research Institute (SRI), Research Triangle Institute Sectional (RTIS), Italian Electricity Board (ENEL), and Electric Power Research Institute (ESPM) models. As an example, the ESPM model will be brieSy described (see Lawless and Altman).
In ESPM, the applied voltage for a given current density isRrst determined for a position directly be-neath the wire:
V"Vc#Ecrw
z!1!lnz#1
2
whereEcis the electricReld at wire surface at corona
onset (V m\1);r
wis the radius of wire (m) and:
z"
1#jb0
b Vw
2
wherebis the wire-plate separation (m);is the ion mobility (m2s\1V\1).
Current densities at other plate locations are cal-culated as:
j()"j0cosn()
where is the angle from between wire and plate (rad);nis a function ofj, 2 (near corona onset) to 4. Ion mobility is based on that of SO2 and SO\2.
Space charge resulting from the charging of particles is treated as an equivalent ion current and used to adjust the operating voltage.
Non-dimensional parameters are used in models to add generality to results and to simplify mathematical treatment. For instance, the initial particle charging rate in an ESP model (ESPM), combining both diffu-sion andReld charging, is:
d d"
3w 4
1!
3w
2
#1
whereis the non-dimensional charge;is the non-dimensional exposure time;wis the non-dimensional electricReld.
Intermediate and saturation charging rates are modelled by different expressions. Back corona charging can be modelled with ESPM, though better understanding of this process is needed to assure accurate results.
Particle collection is modelled with a modiRed Deutsch expression:
P"
1!A/QNw
NwNw is a parameter to adjust for turbulence: a high value approaches Deutschian total mixing, a low value approaches laminar collection (laminar when
Nw"1). To correct for uneven gasSow, penetration
is calculated at several gas velocities and the results combined by weighted averaging. Rapping loss can be speciRed or estimated by applying conventional dynamics to the falling of agglomerated ‘cake’ during collector cleaning. The model treats each ESP section separately, ‘remixing’ particulates exiting from each section.
ESPM can be used to predict V}I curves, ‘grade efRciency’ (penetration as a function of particle dia-meter), and other aspects of ESP performance under varying conditions.
Innovative ESP Designs
Several new means have been developed to facilitate collection of submicron and highly resistive particles by ESPs.
Pulse energization is discussed above (see Current density). By superimposing a brief, high voltage pulse on a DC voltage set just below the back corona level, efRcientRne particle charging and collection are ob-tained with highly resistive dusts.
Enhanced particle agglomeration can also facilitate
Fabric Rltration is the surest means of removing
Rne particles. EPRI has devised the ‘Compact Hybrid Particulate Collector’ (COHPAC). This design simply places a baghouse after an ESP. The ESP removes much of the particulates, easing the load on the baghouse, hence reducing maintenance. The bag-house reduces pollution due to rapping loss, and is insensitive to changes in fuel.
EPRI has also developed an ‘EPRICON’ process which can replace conventional chemical condition-ing ofSy ash from low sulfur coals. In this process, a portion of the gas stream is diverted to a vanadium oxide-based catalytic unit, which efRciently converts SO2 to SO3. Recombination of the treated stream
with the bulk results in the necessary conditioning of theSy ash.
See also: Particle Size Separation: Hydrocyclones for Particle Size Separation; Sieving/Screening.
Further Reading
Busby HGT and Darby K (1963) EfRciency of electrostatic precipitators as affected by the properties and combus-tion of coal. Journal of the Institute of Fuel 36(268): 184.
Dubard JL and Nichols GB (1990) Diagnosis of electrical operation of electrostatic precipitators.Journal of Elec-trostatics25: 75.
Hart BR, Powell MA, Fyfe WS and Ratanasthien B (1995) Geochemistry and mineralogy ofSy-ash from the Mae Moh lignite deposit, Thailand.Energy Sources17: 23. Kanazawa S, Ohkubo T, Nomoto Y and Adachi T (1993)
Submicron particle agglomeration and precipitation by using a bipolar charging method. Journal of Electro-statics29: 193.
Landham EC Jr., Dubard JL and Piulle W (1990) The effect of high-voltage waveforms on ESP current density distri-butions. IEEE Transactions on Industry Applications 26(3): 515.
McKinney PJ, Davidson JH and Leone DM (1992) Current distributions for barbed plate-to-plane coronas.IEEE Transactions on Industry Applications28(6): 1424. McKean KJ (1988) Electrostatic precipitators. IEE
Pro-ceedings Pt.A. 135(6): 347.
Oglesby S Jr. and Nichols GB (1978)Electrostatic Precipi-tation. New York: Marcel Dekker Inc.
Tachibana N (1989) Back discharge and intermittent ener-gization in electrostatic precipitation ofSy ash.Journal of Electrostatics22: 257.
Watanabe T, Tochikubo F and Koizumi Y et al. (1995) Submicron particle agglomeration by an electrostatic agglomerator.Journal of Electrostatics34: 367. Zhibin Z and Guoquan Z (1994) Investigations of the
collec-tion efRciency of an electrostatic precipitator with turbu-lent effects.Aerosol Science and Technology20: 169.
Field Flow Fractionation: Electric Fields
S.N.Semenov, Institute of Biochemical Physics, Russian Academy of Science, Moscow, Russia
Copyright^ 2000 Academic Press
Introduction
Field Sow fractionation (FFF) represents a class of separation techniques, which use a forceReld perpen-dicular to the direction of separation to control the longitudinal velocity of particles injected into the system. It is achieved by particle redistribution in the
Sow with a parabolic velocity proRle due to the ac-tion of a transverse force. This transverse force may be due to an electric Reld, a centrifugal or gravity
Reld, etc. In electric FFF (ElFFF), the transverse move-ment of the particles is caused by an electric Reld. The transverse particle velocity, U, is deRned by
the expression:
U"b)E [1]
where b is the particle electrophoretic velocity, and Eis the electricReld strength in the channel interior, which is available both for the particles and theSow of the carrier liquid. The particle electrophoretic mo-bility is related to the particle electrokinetic potential (zeta-potential):
b"
4f
R [2]whereis the dielectric constant of the carrier liquid,