ISSN Online: 2333-9721 ISSN Print: 2333-9705
DOI: 10.4236/oalib.1104764 Sep. 30, 2018 1 Open Access Library Journal
Prediction of the Fragmentation Pathway of
Valsartan Protonated Ion
Dev Kant Shandilya
1*, Rekha Israni
1, Peter Edward Joseph
21Department of Research, Bhagwant University, Ajmer, India
2Department of Chemistry, ST. Johns College, Agra, India
Abstract
Introduction: A fragmentation pathway of valsartan protonated ion pro-posed based on rational interpretation workflows. Method: The mass spectral data (MS, MS/MS, and MS3) of valsartan protonated ion, were attained by electrospray positive ionization with flow injection analysis; using liquid chromatography systems hyphenated with hybrid tandem mass spectrometer (Q-trap). Results: The pathway of fragmentation was established using prod-uct ions of the protonated ion; elemental composition, molecular strprod-ucture and mechanism of formation for significant product ions were proposed. A pathway was proposed based on the MS/MS and MS3 spectral data in combi-nation with basic interpretation rules and rational workflows. Conclusion: Workflow used for data interpretation can be useful for writing the fragmen-tation pathway, a mechanism for the formation of fragments, and can be ap-plied for mass spectral data interpretation of similar small organic molecules.
Subject Areas
Analytical Chemistry, Chemical Engineering and Technology
Keywords
Valsartan, Small Organic Molecules, Fragmentation Pathway, Protonated Ion, Fragmentation, Interpretation
1. Introduction
Nowadays the use of Mass spectrometry (MS) is amplified in the analytical re-search laboratories of pharmaceutical rere-search and development. Mass spectro-metry plays an essential role for the characterization and identification of small and large drug molecules. Understanding mass spectrometry data interpretation became necessary for the research scientist working in the field of
pharmaceuti-How to cite this paper: Shandilya, D.K., Israni, R. and Joseph, P.E. (2018) Prediction of the Fragmentation Pathway of Valsartan Protonated Ion. Open Access Library Journal, 5: e4764.
https://doi.org/10.4236/oalib.1104764 Received: July 9, 2018
Accepted: September 27, 2018 Published: September 30, 2018 Copyright © 2018 by authors and Open Access Library Inc.
This work is licensed under the Creative Commons Attribution International License (CC BY 4.0).
DOI: 10.4236/oalib.1104764 2 Open Access Library Journal cal research. The application of mass spectrometry is kept on increasing day by day. Therefore in this study spectral data generated using advanced mass spec-trometric systems, along with reasonable data interpretation is beneficial for comprehensive structural analysis study, i.e., to study the fragments and to pro-pose a pathway [1]-[13].
The focus of this study solely towards the mass spectral data interpretation, during this study unit-resolution tandem mass analyzer (Q-trap) mass spectro-metry systems with trap functionality, was used. Q-trap analyzer was very help-ful to generate MS3 spectral data by using the third quadrupole as a trap. MS3 in-formation directed to write a fragmentation pathway for parent and product ions. A small nitrogenous organic molecule with a carboxylic acid functional group; valsartan was selected for this study and spectral data were generated us-ing positive ion mode. Followed by prediction of fragmentation pathway of pro-tonated ion, using similar methodology or workflow as described or applied in
[14] [15][16].
Mass spectrometry spectral data interpretation is the most time taking and complicated process. So, here use of a step by step, rational workflow to interpret MS (protonated peak) and MS/MS (collision-induced dissociation or fragmenta-tion), and MS3 spectra of valsartan (small drug molecule) depicted.
Valsartan [17] [18] [19] is an angiotensin-receptor blocker (ARB) that may be used to treat a variety of cardiac conditions including hypertension, diabetic nephropathy, and heart failure. Valsartan lowers blood pressure by antagonizing the renin-angiotensin-aldosterone system (RAAS); it competes with angiotensin II for binding to the type-1 angiotensin II receptor (AT1) subtype and prevents the blood pressure increasing effects of angiotensin II. Unlike angioten-sin-converting enzyme (ACE) inhibitors, ARBs do not have the adverse effect of a dry cough. Valsartan may be used to treat hypertension, isolated systolic hypertension, left ventricular hypertrophy and diabetic nephropathy. It may also be used as an alternative agent for the treatment of heart failure, systolic dysfunc-tion, myocardial infarction and coronary artery disease (drug bank and rxlist). Valsartan is chemically described as N-(1-oxopentyl)-N-[[2'-(1H-tetrazol-5-yl) [1,1'-biphenyl]-4-yl]methyl]-L-valine. Its empirical formula is C24H29N5O3, its molecular weight is 435.5, and its structural formula presented in Figure 1.
During this study mass, spectral data of valsartan was generated using elec-trospray ionization, and collision-induced dissociation; followed by interpreta-tion, workflow [15] and basic rules were used for the interpretation of the full scan atmospheric pressure ionization mass spectra (MS), collision-induced dis-sociation fragmentation spectra (MS/MS) and MS3 data.
2. Experimental
2.1. Drug Sample
DOI: 10.4236/oalib.1104764 3 Open Access Library Journal
2.2. Chemicals and Reagents
The ultrapure water (18.2 MΩ) was obtained using MilliQ apparatus from Mil-lipore (Milford, USA), acetonitrile HPLC grade and the HPLC grade methanol was purchased from J. T. Baker.
2.3. Instrumentation
Shimadzu Prominence 20 AD HPLC (Kyoto Japan) coupled with Q-trap 5500 (AB SCIEX), equipped with electrospray ionization source (ESI) were used for this analysis.
2.4. Chromatographic and Mass Spectrometric Conditions
The experimental data (MS, MS/MS and MS3 spectral data) of valsartan was generated using high-performance liquid chromatography (HPLC) coupled with Q-trap mass analyzer via Flow Injection Analysis (FIA) mode and Electro-spray Ionization (ESI+) ion source. Collision-induced fragmentation (CID) technique in collision cell (Q2) of Q-trap mass spectrometer was used for the fragmenta-tion of protonated molecular ion into further fragments. The fragmentafragmenta-tion pathways are preferably based on even-electron (EE) and least favorable to the formation of protonated ions in spectra, EE ions will generally result from the charge migration or transfer across the cleavage sites, rearrangement and mul-tiple bond cleavage are common in CID spectra [8]-[13]. Interpretation workflow of [15] was applied for data interpretation. The same work flow can also be applied for de-protonated ions or negative ionization mode [20].
3. Results and Discussion
The mass spectrometry technique is a modern method for the identification of small molecules and their impurities. The full scan MS and product ion spectra of valsartan were obtained from experiments. Figure 1 shows the ESI+ mass spectrum (MS) of valsartan acquired using ESI (+ve). The protonated ion peak appeared at
m/z 436.2 Da as [M + H]+ (calculated formula C
24H30N5O3+). The protonated ion peak was further confirmed by calculating the mass difference with an adduct ion at m/z 458.1 as [M + Na]+ and 474.1 [M + K]+ as exhibited in MS spectrum.
The MS/MS spectrum of valsartan was acquired at collision energy (CE) 10, 20, and 30; to understand and differentiate between the low and high energy fragments and MS/MS spectra of m/z 436.2 at different collision energy were presented in Figures 2-4 and summarized in Table 1.
MS/MS spectra in Figures 2-4 showing the shift of low energy fragments to high energy fragments, aforesaid MS/MS information along with MS3 was help-ful for writing the fragmentation pathway. During CID fragmentation of parent ion 436.2 (M + H)+ ion fragmented into 11 fragments (9 major and 2 trace); m/z 418.2 (PI-1), 408.3 (PI-2), 390.2 (PI-3), 362.4 (PI-4), 352.2 (PI-5), 306.2 (PI-6), 291.1 (PI-7), 235.1 (PI-8), 207.0 (PI-9), 190.0 and 180.0.
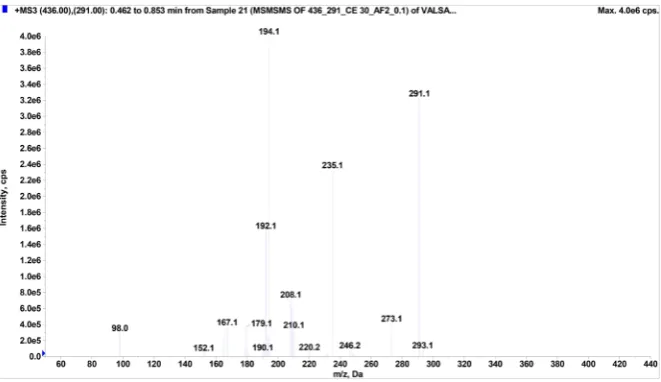
DOI: 10.4236/oalib.1104764 4 Open Access Library Journal presented in Figures 5-10. The fragmentation outcome of MS3 analysis summa-rized in Table 2. During MS3 analysis four new fragments 345.1 (PI-10), 194.1 (PI-11), 192.1 (PI-12) and 167.1 (PI-13). Fragmentation of PI-10 fragment ion (m/z 345) obtained and presented in Figure 8. Based on MS/MS and MS3 spec-tral data, fragmentation pathway was predicted or depicted and presented in
Figure 11 and interpretation of fragment ions, presented in Table 1 and Table
2. Fragmentation pathway presented in Figure 11, for medium and low molecu-lar weight fragments there are multiple source for formation as presented in
Ta-ble 2 (MS3 information). Proposed mechanism for the formation of all
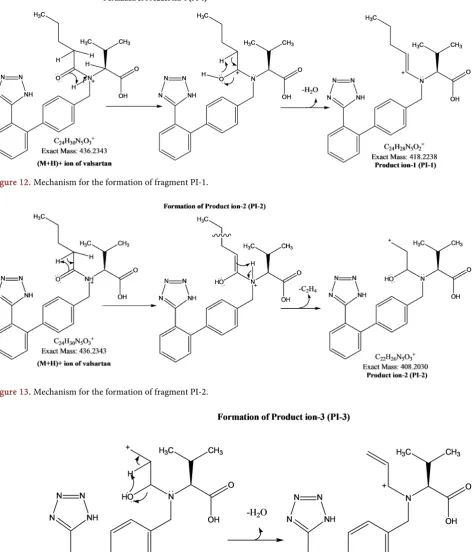
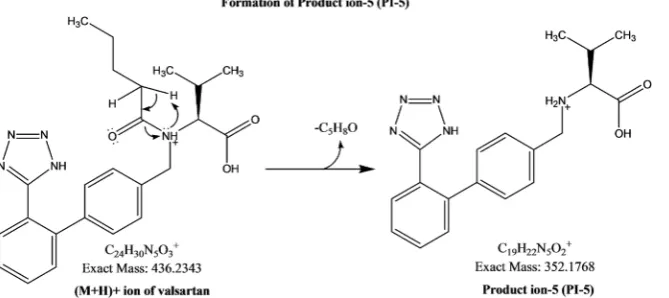
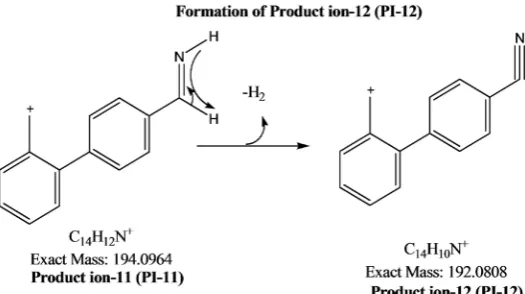
signifi-cant fragment ions PI-1 to PI-13 presented in Figures 12-24.
Table 1. MS/MS data interpretation of Valsartan protonated ion.
Parent
ion (m/z) CE
Product ions (m/z)
PI-1 PI-2 PI-3 PI-4 PI-5 PI-6 PI-7 PI-8 PI-9 436.2
C24H30N5O3+
10 418.2 408.3 C22H26N5O3
+ - 362.4 352.2 306.2 291.1 235.1 -
20 418.2 408.3 390.2 362.2 352.2 306.1 291.1 235.0 207.0 30 - - - 362.2 352.2 306.1 291.1 235.0 207.0
[image:4.595.58.539.254.321.2]CE = Collision energy; PI = product ion.
Table 2. Fragment ions (MS3) interpretation.
Measured Mass (m/z)
(MS/MS) ID Mass (m/z) Measured Electron Paring Nitrogen Rule Nitrogen (s) No. of Proposed Formula Calculated Mass
418 (PI-1) C24H28N5O2 +
Calculated: 418.2
PI-3 390.0 EE ON 5 C22H24N5O2
+ 390.2
PI-4 362.2 EE ON 5 C20H20N5O2
+ 362.2
PI-10 345.1 OE ON 5 C20H19N5•+ 345.2
PI-6 306.1 EE ON 5 C18H20N5+ 306.2
PI-7 291.2 OE ON 5 C17H17N5•+ 291.1
PI-8 235.0 EE EN 4 C14H11N4
+ 235.1
PI-9 207.2 EE EN 2 C14H11N2+ 207.1
362 (PI-4) C20H20N5O2 +
Calculated: 362.2
PI-4 362.2 EE ON 5 C20H19N5O+ 362.2
PI-10 345.1 OE ON 5 C20H19N5•+ 345.2
PI-7 291.1 OE ON 5 C17H17N5•+ 291.1
352 (PI-5) C19H22N5O2 +
Calculated: 352.2
PI-6 306.1 EE ON 5 C18H20N5+ 306.2
PI-8 235.1 EE EN 4 C14H11N4
+ 235.1
PI-9 207.1 EE EN 2 C14H11N2
+ 207.1
345.0 (PI-10) C20H19N5•+
(MS3)
PI-6 306.2 EE ON 5 C18H20N5+ 306.2
PI-8 235.1 EE EN 4 C14H11N4
+ 235.1
PI-9 207.1 EE EN 2 C14H11N2
+ 207.1
306 (PI-6) C18H20N5
+
Calculated: 306.2
PI-8 235.1 EE EN 4 C14H11N4+ 235.1
PI-9 207.1 EE EN 2 C14H11N2 +
207.1 291(PI-7)
C17H17N5•+
Calculated: 291.1
PI-8 235.1 EE EN 4 C14H11N4 +
235.1 PI-11 194.1 EE ON 1 C14H12N+ 194.1
PI-12 192.1 EE ON 1 C14H10N+ 192.1
PI-13 167.1 EE EN 0 C13H11+ 167.1
[image:4.595.64.537.367.711.2]DOI: 10.4236/oalib.1104764 5 Open Access Library Journal
[image:5.595.198.539.64.264.2]Figure 1. Positive ion mode mass spectra of Valsartan.
Figure 2. MS/MS spectra of valsartan (m/z—436) at CE 10.
[image:5.595.198.539.510.711.2]DOI: 10.4236/oalib.1104764 6 Open Access Library Journal
[image:6.595.183.536.72.286.2] [image:6.595.183.539.275.477.2]Figure 4. MS/MS spectra of valsartan (m/z—436) at CE 30.
Figure 5. Fragment ion spectra (MS3) of product ion PI-1 (m/z—418 (Parent 436)).
[image:6.595.182.538.504.707.2]DOI: 10.4236/oalib.1104764 7 Open Access Library Journal
[image:7.595.192.536.511.707.2]Figure 7. Fragment ion spectra (MS3) of product ion PI-4 (m/z—352 (Parent 436)).
Figure 8. Fragment ion spectra (MS3) of product ion PI-10 (m/z—345 (Parent 436)).
DOI: 10.4236/oalib.1104764 8 Open Access Library Journal
Figure 10. Fragment ion spectra (MS3) of product ion PI-7 (m/z—291 (Parent 436)).
[image:8.595.156.534.289.688.2]DOI: 10.4236/oalib.1104764 9 Open Access Library Journal
Figure 12. Mechanism for the formation of fragment PI-1.
Figure 13. Mechanism for the formation of fragment PI-2.
[image:9.595.112.534.516.707.2]DOI: 10.4236/oalib.1104764 10 Open Access Library Journal
[image:10.595.211.546.411.560.2]Figure 15. Mechanism for the formation of fragment PI-4..
[image:10.595.214.538.594.706.2]Figure 16. Mechanism for the formation of fragment PI-5.
DOI: 10.4236/oalib.1104764 11 Open Access Library Journal
[image:11.595.235.511.264.404.2]Figure 18. Mechanism for the formation of fragment PI-7.
Figure 19. Mechanism for the formation of fragment PI-8.
Figure 20. Mechanism for the formation of fragment PI-9.
[image:11.595.235.512.434.549.2] [image:11.595.213.537.579.705.2]DOI: 10.4236/oalib.1104764 12 Open Access Library Journal
[image:12.595.242.505.237.384.2]Figure 22. Mechanism for the formation of fragment PI-11.
Figure 23. Mechanism for the formation of fragment PI-12.
Figure 24. Mechanism for the formation of fragment PI-13.
4. Conclusion
[image:12.595.241.507.418.552.2]DOI: 10.4236/oalib.1104764 13 Open Access Library Journal applied for structure verification studies.
Acknowledgements
This paper is part of the Ph.D. thesis of Dev Kant Shandilya. The author ex-presses his gratitude to the Dean, Department of Research, Bhagwant University, Ajmer, Rajasthan, India for extending his constant support.
Conflicts of Interest
The authors declare no conflicts of interest regarding the publication of this pa-per.
References
[1] Aksenov, A.A., da Silva, R., Knight, R., Lopes, N.P. and Dorrestein, P.C. (2017)
Global Chemical Analysis of Biology by Mass Spectrometry. Nature Reviews
Che-mistry, 1, 54. https://doi.org/10.1038/s41570-017-0054
[2] Smith, R.M. (2005) Understanding Mass Spectra: A Basic Approach. John Wiley &
Sons Inc., Hoboken, 2.
[3] Pramanik, B.N., Bartner, P.L. and Chen, G. (1999) The Role of Mass Spectrometry
in the Drug Discovery Process. Current Opinion in Drug Discovery & Develop-ment, 2, 401-417.
[4] Nicolas, C.E. and Schoolz, T.H. (1998) Active Drug Substances Impurity Profiling
Part II. LC-MS/MS Fingerprinting. Journal of Pharmaceutical and Biomedical
Analysis, 16, 825-836. https://doi.org/10.1016/S0731-7085(97)00132-5
[5] Cooks, R.G., Chen, G., Wong, P. and Wollnik, H. (1997) Mass Spectrometers. In:
Trigg, G.L., Ed., In Encyclopedia of Applied Physics, VCH Publishers, New York,
19, 289.
[6] Chen, G., Pramanik, B.N., Liu, Y.-H. and Mirza, U.A. (2007) Applications of LC/MS
in Structure Identifications of Small Molecules and Proteins in Drug Discovery.
Journal of Mass Spectrometry, 42, 279-287. https://doi.org/10.1002/jms.1184
[7] Ermer, J. (1998) The Use of Hyphenated LC-MS Technique for Characterization of
Impurity Profiles during Drug Development. Journal of Pharmaceutical and
Bio-medical Analysis, 18, 707-714. https://doi.org/10.1016/S0731-7085(98)00267-2
[8] McLafferty, F.W. and Turecek, F. (1993) Interpretation of Mass Spectra. University
of Science Books, Mill Valley, CA.
[9] Angelika, G., Harrison, M.W., Herniman, J.M., Skylaris, C.-K. and Langely, G.J. (2013) A Predictive Science Approach to Aid Understanding of Electrospray Ioniza-tion Trandem Mass Spectrometric FragmentaIoniza-tion Pathway of Small Molecules
Us-ing Density Functional Calculations. Rapid Communications in Mass Spectrometry,
27, 964-970. https://doi.org/10.1002/rcm.6536
[10] Holcapek, M., Jirasko, R. and Lísa, M. (2010) Basic Rules for the Interpretation of
Atmospheric Pressure Ionization Mass Spectra of Small Molecules.
Chromatogra-phy A, 1217, 3908-3921. https://doi.org/10.1016/j.chroma.2010.02.049
[11] Johnson, A.R. and Carlson, E.E. (2015) Collision-Induced Dissociation Mass
Spec-trometry: A Powerful Tool for Natural Product Structure Elucidation. Analytical
Chemistry, 87, 10668-10678. https://doi.org/10.1021/acs.analchem.5b01543
DOI: 10.4236/oalib.1104764 14 Open Access Library Journal
of Anabolic Steroids by Electrospray Ionization Tandem Mass spectrometry.
Jour-nal American Society of Mass Spectrometry, 17, 477-489. https://doi.org/10.1016/j.jasms.2005.11.021
[13] Dermarque, D.P., Crotti, A.E.M., Vessecchi, R., Lopes, J.L.C. and Lopes, N.P. (2016)
Fragmentation Reactions Using Electrospray Ionization Mass Spectrometry: And Important Tool for Structural Elucidation and Characterization of Synthetic and Natural Products. Natural Product Reports, 33, 432.
https://doi.org/10.1039/C5NP00073D
[14] Shandilya, D.K., Israni, R., Joseph, P.E., Kumar, A. and Pillai, M. (2017) Identifica-tion of Oxidative DegradaIdentifica-tion Products of Lansoprazole by Using High ResoluIdentifica-tion
Mass Spectrometry Spectral Data. International Journal of Analytical Mass
Spec-trometry and Chromatography, 5, 57-69. https://doi.org/10.4236/ijamsc.2017.53004
[15] Shandilya, D.K., Joseph, P.E. and Kantamreddi, V.S.S. (2017) Interpretation of Full
Scan Atmospheric Pressure Ionization Mass Spectra (MS) and Collision Induced Dissociation Fragmentation Spectra (MS/MS) of Small Organic Molecules—A Mini Review. Systematic Reviews in Pharmacy, 8, 23-25.
https://doi.org/10.5530/srp.2017.1.9
[16] Shandilya, D.K., Joseph, P.E. and Kantamreddi, V.S.S. (2017) Prediction of the
Fragmentation Pathway of Atorvastatin by Using High Resolution Collision
In-duced Dissociation (HR-MS/MS) Spectral Data. Open Access Library Journal, 4,
e3473.
[17] https://en.wikipedia.org/wiki/Valsartan
[18] https://www.drugs.com/cdi/valsartan-capsules.html [19] https://www.rxlist.com/diovan-drug.htm
[20] Shandilya, D.K., Israni, R. and Joseph, P.E. (2018) Prediction of the Fragmentation
Pathway of Atorvastatin De-Protonated Ion. Open Access Library Journal, 5, e3473.
Abbreviations Used
LC: Liquid chromatography; HPLC: High performance liquid chromatography;
MS: Mass spectrometry; MS/MS: Tandem mass spectrometer; MS3: Tandem