Abstract—The goal of this paper is to present the data results from the live implementation of a Geofencing Security Strategy Model that mitigates the threats to the information security of businesses which use Wireless Networks. The Geofencing Security Strategy Model is made up of Location Based Service Trust Model and a Security Strategy Trust Model. The results suggest that the Geofencing Security Strategy Model enhances the ability of a business to control the access of its wireless network users; by limiting the geographic range from which they can log onto the wireless network using a predefined parameter.
Index Terms—Location Based Service Model, Security Strategy Model, Geofencing as a Security Strategy Model, Data
I. INTRODUCTION
Our proposed model enables users of wireless networks within business environments to communicate securely using location based service technology. Our approach to developing our Geofencing Security Strategy Model was two phased, in the first phase we developed a security strategy from a questionnaire distributed to 1000 small medium sized companies in order to collate data on security issues from their business environment, that affect their wireless networks from within the environment in which it is used. In addition we used the information from the respondents; validated by similar surveys done by the British government and Price Waterhouse Coopers an International Chartered Accounting Practice. We then created our threat model from the validated data and then we set about attacking the threat model with all known possible threats in order to develop a trust model, the aim of which was to assess the probability, the potential harm, the priority etc. of attacks, and from this point on try to minimize or eradicate the threats. The vast majority of research done within Location Based Services suggests that in order to obtain the location of a mobile unit then a procedure known as location estimation must be used. Some of the
Manuscript received (January 1, 2010). This work was supported in part by a grant from the Worshipful Company of Haberdashers UK and the free use of a Location Based Service Laboratory owned by AireTrak Ltd based At Huntingdon in the UK
A .C. Ijeh was with RSM Tennon, LLP, UK. He is now with the University of East London, 4 – 6 University Way, London, E16 2RD, UK (Corresponding authors phone: +44(0)208-223-7778; e-mail: [email protected])
D .S. Preston is with the University of East London, 4 – 6 University Way, London, E16 2RD, UK (e-mail: [email protected])
C .O. Imafidon is with the University of East London, 4 – 6 University Way, London, E16 2RD, UK (e-mail: [email protected])
T .B. Watmon is with the University of East London, 4 – 6 University Way, London, E16 2RD, UK (e-mail: [email protected])
J. Arreymbi is with the University of East London, 4 – 6 University Way, London, E16 2RD, UK (email: [email protected])
A. O. Uwaechie is with Zenith Bank PLC (email: [email protected])
common methods for indoor positioning include the use of algorithms, angle of arrival, timing-based algorithms and signal strength. In the second phase we use the concept that suggests that location based service conditions set by predicates can be used to solve the security flaw in wireless networks. The focus is the presentation of the findings from mitigating the risks to wireless networks by mitigating the security flaw. The predicates we have used revolve around three known concepts; that of a) Position based conditions: Using the location of the user (e.g. to evaluate the exact location of the user) b) Movement based conditions: Using the mobility of the user (e.g. the velocity, acceleration or direction of the user) c) Interaction based condition. In order to develop an efficient Security Strategy Model (SSM) there is a need to understand both human and non human factors that stem from the usage of the system to which it is being designed to protect.
The next step is to collect the data from the wireless technologies in the proposed experiment. Data analysis in experimental research comes down to calculating "correlations" between variables, specifically, those manipulated (Independent) and those affected by the manipulation (dependent). Only experimental data can conclusively demonstrate causal relations between variables. Table I identifies the dependent and independent variables for risks to the Security Strategy Threat Model whilst Table II shows the Security Strategy Trust Model
In order to develop the Geofencing Security solution we mitigated the risk to radio wave leakage in wireless networks using a specially programmed technology that can locate a wireless device. The objective was for the wireless device to only function within a defined parameter. This is so that the parameter can be used to control the acts of the wireless device when it communicates with a designated server. Table III identifies the dependent and independent variables for risks to the Location Based Service Trust Model whist Table IV shows the Location Based Service Trust Model. Table V shows some specific predicates corresponding to the conditions of the kind identified. Other predicates can be added or removed as the need arises and technology progresses. Conditions are expressed as Boolean
The Small and Medium Enterprise (SMEs) Questionnaires Survey: The questionnaire was designed in order to determine the Information Security methods and practices used by Small and Medium Enterprise (SMEs) to provide data confidentiality, data Integrity and data availability for users of their wireless networks. This was because a Small Medium Enterprise was used to test the prototype and Security Strategy Model; section A and section B contain the questions asked
Data for Geofencing Security Strategy Model
SECTION A: EXECUTIVE LEVEL (Filled by Directors) 1.1 IT management information
To what extent does IT management use quality information to evaluate Information Technology (IT) performance? 1.2 IT performance management
To what extent is the performance of the IT function monitored?
2.1 Compliance with Legal Requirements
To what extent does the organisation ensure that each application system is in compliance with relevant statutory, regulatory and contractual requirements?
3.1 Security awareness and management
To what extent does the organisation place a high priority on the management of information security risks?
SECTION B: FUNCTIONAL LEVEL (Filled by Managers) 3.2 Setting up/removing user access to systems
To what extent are procedures for user administration (setting up new users and removing leavers) effective?
3.3 Security event logging and follow-up
To what extent are security incidents or events logged and reviewed?
3.4 Security patching (protecting versus viruses, hackers) To what extent are procedures in place to ensure that all servers and PCs have the correct security configuration and latest operating system updates?
3.5 Data Centre Security
To what extent are sound physical access controls enforced? 3.6 Desktop/Laptop security
To what extent are desktop/laptop devices secured? 4.1 Maintenance of existing systems
To what extent are changes to existing systems appropriately recorded?
4.2 Segregation of duties within IT (developer access to production)
To what extent is software programmer developer‘s access restricted to an appropriate number of staff that does not compromise segregations of duty?
4.3 Use of spreadsheets etc. by the business
To what extent is the use of ‗programmable functions‘ (e.g. the use of macro programmers in developing Excel spreadsheets) restricted to certain authorised personnel? 4.4 Definition of a strategy to ensure effective use of ERP solutions
To what extent has the ERP system strategy been defined?' 4.5 Support of ERP
To what extent are ERP solutions effectively supported? 5.1 Disaster recovery/Business Continuity Planning
To what extent are there effective business continuity and disaster recovery plans in place and tested?
5.2 Service Delivery and Problem Management
To what extent is there an effective process for managing day-to-day computer operations, recognising problems and fixing them quickly?
7.1 IT project management and benefits realisation To what extent are IT projects appropriately managed? 8.1 Third party management
To what extent are IT services provided by third parties (e.g. under outsourcing arrangements) controlled?
9.1 Data quality and data management
To what extent does the organisation have effective controls over the quality and use of its data?
9.2 Data Retention
To what extent does the organisation understand and comply with its requirements to implement effective controls over the retention of their data?
10.1 Software licensing
To what extent are software licensing and the use of licenses monitored?
10.2 Hardware Asset Management
To what extent are hardware assets monitored?
11.1 Implementing new technology and emerging technology To what extent does the organisation understand and monitor the impact of new trends and technologies on its business?
II.DATA DESIGN AND RESEARCH METHODOLOGY
The research approach of Phase One in this paper took the form of a qualitatively designed questionnaire, which was used in collating the awareness and perception of methods used by the SMEs management in the implementation of Information Security Trust Models within their organisation. Three stages of questionnaire design and implementation had to be completed in order to gather the necessary data for this research paper. The first was to interview the suppliers and end users of the location based technology used in developing Information Security Trust models. The second was to select a representative number of companies from an electronic published database called FAMEwhich contains information on 3.4 million companies, 2.8 million of which are in a detailed format for companies in the UK and Ireland. The third was the administration of a Likert-type questionnaire in which respondents answered 23 unique items relevant to their job specifications (3 on IT policy) and (20 on managing the confidentiality, integrity and availability of network data). So the research follows a case study methodology on Information Security provided by the 106 small medium enterprises in England (UK) that were used. Previous researchers that had used this methodology [1, 2, 3, 4 and 5] strengthened our assumption that this was the right method for obtaining the underlying reasons of the respondent‘s perceptions from the questionnaire. The research approach of Phase Two was designed to create our Geofencing Security Trust Model as a result of the challenges that wireless networks face from the leakage of radio waves which they use to transmit their data. The project used Airetrak‘s Huntingdon laboratory as its test bed so as to prove that Geofencing can be used as a security access measure for securing wireless networks. In this research paper the authors were not in any way trying to prove that Geofencing works as it has been applied in so many industries both in the Europe and USA. The aim of creating the Geofencing Security Trust Model was to demonstrate that it could be applied in such a way that it would prevent war driving and other forms of hacking; which affect wireless networks. In the project which was an experimental research, the aim was to provide intervention to practical problems using a theoretical framework. Thereafter an application of the theoretical framework was implemented to test its ability to provide a practical solution using a host organisation for proof of concept
To overcome the problem of dependence on the measurement scale we need to convert the covariance into a set of standard set of units; this process is known as standardisation. Because we measured the opinions of our respondents in the questionnaire using a Likert Scale We used a measurement into which any scale of measurement can be converted. The unit we used was the standard deviation. It follows that if we want to express the covariance in a standard unit of measurement we can simply divide by the standard deviation. The standardised covariance is known as the correlation coefficient and is defined by an equation in which is the first variable and y is the standard deviation of the second variable.
By standardising the covariance we end up with a value that has to lie between -1 and +1 (if we found that a correlation coefficient was less than -1 or more than +1 then it would mean that something had gone hideously wrong). Thankfully
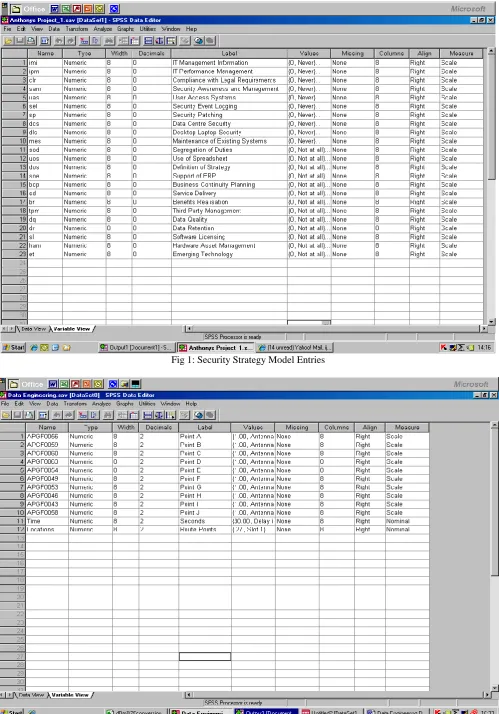
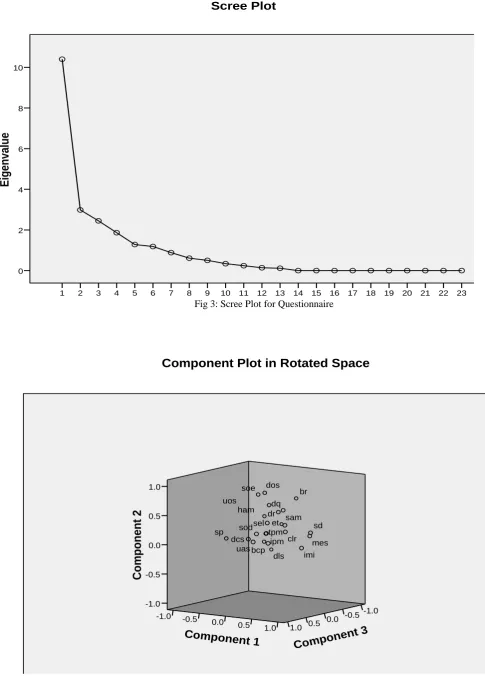
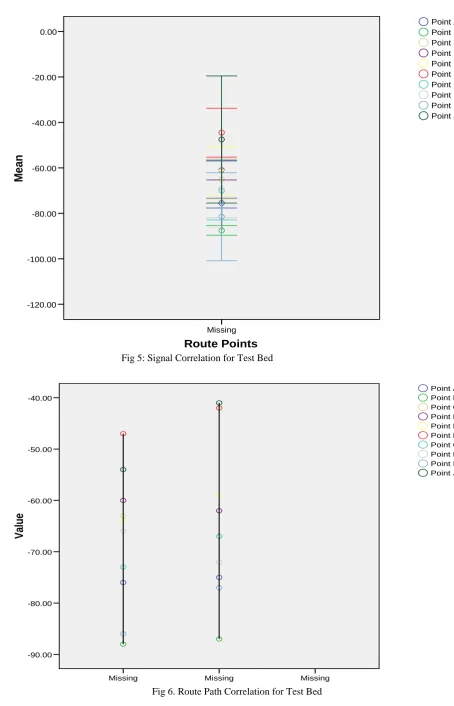
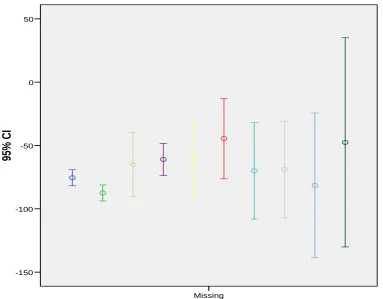
we didn‘t find any correlation coefficient was less than -1 or more than +1 in our data. From the Figure 1 and Figure 2; we can see that the data was entered and analysed using SPSS data editor. Figure 3 and 4 shows the Scree Plot and the Rotated Component Plot respectively. In the Scree Plot, the eigenvalues for successive factors can be displayed in a simple line plot. Cattell (1966) proposed that this scree plot can be used to graphically determine the optimal number of factors to retain. Principal Factors Analysis: The different aspects of the typical output from a principal components analysis show that our questionnaires respondent‘s responses were dependent on two components. First, there were some underlying common factors, such as the "Awareness" factor. Second, each answer also captures a unique aspect of ―Perception‖ that is not addressed by the other component. Fig 5: shows the Correlation between signals from the access point to the mobile device, Fig 6: shows the correlation between the Route points after extraction using the Principal Component Analysis, Fig 7: shows the Confidence Interval Correlation using the route points
III. ANALYSIS
Fig 1: Security Strategy Model Entries
Fig 2: Location Base Service Model Entries
Component Number
23 22 21 20 19 18 17 16 15 14 13 12 11 10 9 8 7 6 5 4 3 2 1
E
ig
enva
lu
e
10
8
6
4
2
0
[image:5.595.69.555.84.761.2]Scree Plot
Fig 3: Scree Plot for Questionnaire
uas bcp
sam sod
clr dcs
imi sel
dq
ipm mes sd dr
dos soe uos
sp tpm
br
ham
dls et
Com
ponen
t 3
1.0 0.50.0 -0.5 -1.0
C
om
po
nen
t 2
1.0
0.5
0.0
-0.5
-1.0
Component 1
1.00.5 0.0 -0.5 -1.0
Component Plot in Rotated Space
Route Points
Missing
M
ean
0.00
-20.00
-40.00
-60.00
-80.00
-100.00
-120.00
Error bars: 95% CI
[image:6.595.60.515.55.762.2]Point J Point I Point H Point G Point F Point E Point D Point C Point B Point A
Fig 5: Signal Correlation for Test Bed
Route Points
Missing Missing
Missing
V
alu
e
-40.00
-50.00
-60.00
-70.00
-80.00
-90.00
[image:6.595.74.443.416.742.2]Point J Point I Point H Point G Point F Point E Point D Point C Point B Point A
Fig 6. Route Path Correlation for Test Bed
Table V: Communalities
Initial Extraction
IT Management Information 1.000 .922
IT Performance Management 1.000 .821
Compliance with Legal Requirements 1.000 .871
Security Awareness and Management 1.000 .906
User Access Systems 1.000 .898
Security Event Logging 1.000 .906
Security Patching 1.000 .915
Data Centre Security 1.000 .916
Desktop Laptop Security 1.000 .964
Maintenance of Existing Systems 1.000 .945
Segregation of Duties 1.000 .715
Use of Spreadsheet 1.000 .870
Definition of Strategy 1.000 .957
Support of ERP 1.000 .918
Business Continuity Planning 1.000 .937
Service Delivery 1.000 .930
Benefits Realisation 1.000 .881
Third Party Management 1.000 .660
Data Quality 1.000 .949
Data Retention 1.000 .894
Software Licensing 1.000 .923
Hardware Asset Management
1.000 .667
Emerging Technology 1.000 .796
Extraction Method: Principal Component Analysis
Route Points
Missing
95%
C
I
50
0
-50
-100
-150
Point J Point I Point H Point G Point F Point E Point D Point C Point B Point A
[image:7.595.66.450.473.772.2]IV. SUMMARY
After we have found the line on which the variance is maximal, there remains some variability around this line. In principal components analysis, after the first factor has been extracted, that is, after the first line has been drawn through the data, we continue and define another line that maximizes the remaining variability, and so on as in Fig 6. In this manner, consecutive factors are extracted. Because each consecutive factor is defined to maximize the variability that is not captured by the preceding factor, consecutive factors are independent of each other. Put another way, consecutive factors are uncorrelated or orthogonal to each other. Table V shows that the extraction of the data was reliable. This paper attempts to fill in the gap in contemporary literature based on research which explores the rationale that governs the implementation of Information Security Trust Models. In doing so, we identify the various security related perceptions held by executive and functional personnel and the degree to which these perceptions are similar.This paper also tests the theoretical framework using a proof of concept approach and the results suggest that the framework can be used to protect wireless networks. It has been argued in the past that there is a lack of empirically based research to effectively analyse the security perceptions used to implement IT security within organisations; this paper presents the results of a three-stage novel framework on an empirical case study focused on 106 SMEs in England (UK). Empirical evidence gathered from a pilot survey so far shows that personnel from different organisations have different perspectives towards network security. In particular, they indicate that the differences in perceptions were on areas such as the Ethics, challenges to effectively protecting the OSI Physical Layer 1 and the Quality of Service.
REFERENCES
[1] Jahankhani, H and Nkhoma, M.Z. (2005), ―Information security risk assessment practice‖, IEE International Conference on Global e-Security (ICGeS-05), 22-24 April, 23-25 May London, pp. 119 – 131
[2] Mouratidis, H; Jahankhani, H; Nkhoma, M.Z (2008), ―Management versus security specialists: an empirical study on security related perceptions‖, Emerald Journal; Information Management and Computer Security, Vol. 16 No. 2, 2008, Emerald Group Publishing Limited pp. 187 – 205
[3] Ijeh A.C; Brimicombe, A.J; Preston, D.S; Imafidon, C.O (2009) ―Geofencing in a Security Strategy Model‖ ICGS3‘09 (formerly ICGeS) Conference Proceedings 1st to the 2nd of September 2009
[4] Ijeh A.C; Brimicombe, A.J; Preston, D.S; Imafidon, C.O; Williams G (2009) ―Security Strategy Models (SSM)‖ In the proceedings of the 4th Annual‘ Advances in Computing Technology Conference (AC&T) 27 January 2009, pp 126-131. University of East London
[5] Ijeh A.C; Brimicombe, A.J; Preston, D.S; Imafidon, C.O; Uwaechie, A.O; (2009) ―Using Geofencing to Overcome Security Challenges in Wireless Networks: Proof of Concept‖ In proceedings of the Information Society 12th international multi-conference 12-16 October 2009, Ljubljana, Slovenia
http://is.ijs.si/is/is2009/zborniki/Zbornik_A.pdf