ISSN Online: 2153-1188 ISSN Print: 2153-117X
DOI: 10.4236/msa.2019.103016 Mar. 12, 2019 197 Materials Sciences and Applications
Study of Dielectric and Thermal Conductivity
Characteristics of Polyimide Composite
Meehye Oh, Yeoseong Yoon, Eunjin Jang, Dongjoon Moon
Environmental Materials R&D Center, Korea Automotive Technology Institute, Cheonan, South Korea
Abstract
The graphene is used to enhance the thermal conductivity, but it is difficult to obtain uniform dispersion and low dielectric property. We fabricate the po-lyimide composite with high thermal conductivity and low dielectric proper-ty. It changes the filler contents, and examines curing time and dispersion. The dispersion characteristics were quantified by absorbance measurement. The graphene 0.1 wt% and BN 0.5 wt% polyimide composites show a thermal conductivity of 6.6 W/m·K by LFA (Laser Flash Analysis) and a dielectric constant of 4.6@10 GHz by SPDR (Split Post Dielectric Resonators).
Keywords
Dielectric Property, Thermal Conductivity, Polyimide Composite, Flexible PCB
1. Introduction
Polyimide has high heat resistance characteristics. Polyimide is the main materi-al for flexible printed circuit board. It has a high operating temperature system. If the ambient temperature rises, both transfer rate and durability deteriorate ra-pidly [1]. So, the use of thermal conductive materials is important.
Currently, the electric devices require a high transfer rate at high frequency. The faster transfer rate can be achieved by lowering permittivity. Therefore, po-lyimide requires low dielectric properties.
Generally, graphene was used to enhance the thermal conductivity, but it is difficult to obtain uniform dispersion and low dielectric property [2].
We fabricated the polyimide composite with high thermal conductivity and low dielectric property. It changed the filler various contents, and curing time and dispersion condition.
How to cite this paper: Oh, M., Yoon, Y., Jang, E. and Moon, D. (2019) Study of Dielectric and Thermal Conductivity Cha-racteristics of Polyimide Composite. Mate-rials Sciences and Applications, 10, 197-204.
https://doi.org/10.4236/msa.2019.103016
Received: October 26, 2018 Accepted: March 9, 2019 Published: March 12, 2019
Copyright © 2019 by author(s) and Scientific Research Publishing Inc. This work is licensed under the Creative Commons Attribution International License (CC BY 4.0).
DOI: 10.4236/msa.2019.103016 198 Materials Sciences and Applications
2. Methods
We used polyimide varnish (SKCKOLONPI Co.), graphene (XG science Co.) and BN (3 M cooling filler). Graphene and BN in solvent were dispersed using ultrasonic at 300 W for 3 min. And then mixed with polyimide varnish using plantary mixer (THINKY Co.) at 2000 rpm during 4 min (involved degasing time). Thin film was prepared by the knife coating using micro gauge device with adjustable applicator.
We observed dispersion stability of fillers in Dimethylformamide (DMF). The solutions were left for maximum 4 days. When the solution was not separated, the condition was determined. When it was applied 300 W ultrasonicwave for 3 min, the dispersion stability was good. The composite film was prepared by mixing PI varnish and graphene solution using the planetary mixer at 2000 rpm for 2 min. The solvent was removed at 100˚C for 5 min in a convection oven. And then, it was cured for 20 minutes at 200˚C. The curing time was long, be-cause the catalyst was not used. The filler contents in composite are graphene 0.1 wt%, graphene(G) 0.1-BN(B) 0.1 wt%, G 0.1-B 0.3 wt%, G 0.1-B 0.5 wt%, G 0.1-B 0.7 wt%, G 0.1-B 0.9 wt%. Figure 1 shows diagram of the materials mix-ing, film making and curing process.
[image:2.595.211.536.426.703.2]The curing behavior was predicted using LT-451 Dielectric Cure Monitor. The dispersion measured by UV-vis, and thermal conductivity using laser flash & hot disc. And then, the dielectric property measured using SPDR network analyzer at 1 - 10 GHz.
DOI: 10.4236/msa.2019.103016 199 Materials Sciences and Applications
3. Results and Discussion
3.1. Curing Behavior
If the physical viscosity of curable polymer increases, the ionic viscosity increas-es. Increasing ionic viscosity is indicated by ionic current.
Figure 2 shows the PI and PI-graphene composite curing behavior with tem-perature. Depending on the curing temperature and holding time, the volatility of the solvent and the degree of curing of PAA, which can influence the film performance, are different.
During the volatilization of the solvent, bubbles may be generated on the sur-face or inside in the film to degrade performance. Therefore, the temperature and hold time must be optimized in the step-by-step curing program.
[image:3.595.61.535.346.694.2]At a curing temperature of 100˚C, the viscosity of PI began to increase after 80min and PI-graphene composite after 15 min. The viscosity of PI-graphene composites is constant after about 12 min. At 200˚C of curing temperature, PI showed a large viscosity change after 5 min and becoming constant after around 15 min. In the case of PI-graphene composites, the curing started after 3 min and viscosity value is becoming constant within 10 min. Compared curing time
DOI: 10.4236/msa.2019.103016 200 Materials Sciences and Applications with PI and PI-graphene composites, it was more than 10 min at 200˚C and more than 30 min at 100˚C. The curing time difference is due to graphene has higher thermal conductivity effect than the polymer material. It is guessed that the volatile of the solvent on the graphene interface and the improved thermal conductivity of the material. I could have expected that the better the thermal conductivity of the composite material, the lower curing temperature and the shorter time.
3.2. Dispersion
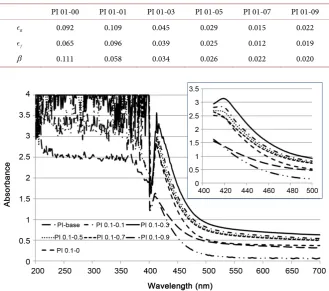
[image:4.595.212.541.437.702.2]The absorbance of the film was measured by UV-vis. High absorbance, the bet-ter the filler dispersion in the film. We used Horn type ultrasonic homogenizer as output 300 W in 20% of maximum power. The solution with graphene was dispersed in various ultrasonic time 1, 3, 5, 10, 15 min. After the 3 min or longer, the dispersion remained more than 48 hrs and that minimum time selected. Figure 3 shows the ultrasonic dispersion solution with time variation.
The dispersion degree measurement using the UV-vis was mainly performed as mainly used measuring the dispersion degree of CNT. The graphene is slightly different from the structure of CNT (CarbonNanoTube) but it is possible to measure the dispersion using UV-vis. It is difficult to quantify the degree of dis-persion of highly concentrated solutions using UV-vis. A solution with a high degree of dispersion and low concentration are easy to measure the UV-vis spectrum. However, when the dispersion is poor, the UV-vis spectrum has high noise and low reliability due to particle agglomeration.
From Beer-Lambert’s law, Equation (1) can be expressed for components [3] [4].
* *
R R f f
A= ⋅ ⋅ = ⋅ ⋅ + ⋅ ⋅ t c t c t c (1)
where:
A: absorbance, R
: molar abs. coefficient of resin, t: thickness,
*
R
c : concentration of resin,
f
: molar abs. coefficient of filler,
*
f
c : concentration of filler.
The products of the molar extinction coefficient and the concentration of components are a and b.
*, *
R R f f
[image:4.595.206.540.629.695.2]a= ⋅ c b= ⋅ c , (2)
DOI: 10.4236/msa.2019.103016 201 Materials Sciences and Applications From this, effective concentration factor is
(
)
f
A t a b c
− =
⋅ . In this case, β represents a value of 0 to 1. When β is 1, it is completely dispersion [3].
The absorbance of the composite material, which is not affected by each component, can be judged to start at about 440 nm. Therefore, the β value at 440 nm was calculated and shown in Table 1. As shown in Table 1, β value is low. β showed a low value of 1 or less, according to the calculation results. The higher the degree of dispersion, β is closer to 1, but in this study, the val-ue is 0.1 or less.
The non-polar graphene in the DMF, polar protic solvent, is easier to aggre-gate. Therefore, it is considered that it is necessary to use a dispersing additive or to increase the external energy so that the substitution reaction can be facilitated. The coefficients calculated from Figure 4 are shown in Table 1.
3.3. Thermal Conductivity & Dielectric Properties
[image:5.595.208.538.416.707.2]Graphene increases not only the thermal conductivity of composites, but also the dielectric constant. Boron nitride was additionally used to lower the dielectric constant while maintaining the high thermal conductivity. The thermal conduc-tivity of 3 wt% graphene polyimide composite is about 6 W/m·K and dielectric constant (Dk) is about 2.2. In general, the permittivity of polyimide is 3.4.
Table 1. The value of constituent materials dispersion coefficient of polyimide composite film.
PI 01-00 PI 01-01 PI 01-03 PI 01-05 PI 01-07 PI 01-09
R
0.092 0.109 0.045 0.029 0.015 0.022
f
0.065 0.096 0.039 0.025 0.012 0.019 β 0.111 0.058 0.034 0.026 0.022 0.020
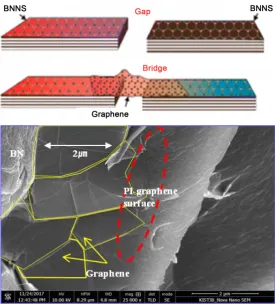
DOI: 10.4236/msa.2019.103016 202 Materials Sciences and Applications However, the low the permittivity, the higher the transmission speed of the mo-bile device. Therefore, the dielectric constant of flexible printed circuit board is required to be 5 or less. Graphene composites have excellent in-plane thermal conductivity, but thru-plane thermal conductivity is low. The graphene and BN were combined to complement the thermal conductivity and permittivity. We predicted that graphene could make connections between BN particles. The PI composite was compounded with multi-filler to fill the gap between graphenes. The network of thermal path was formed by the difference in shape and size of graphene and BN. Figure 5 is a SEM image of fillers in PI composite.
As shown in Table 2, we could obtain a thermal conductivity of about 6 W/m·K and a dielectric constant of about 4 in composite materials. However, if the dispersive is better, the thermal conductivity improvement and the dielectric constant reduction effect will be further increased.
DMF and graphene are factors that increase the permittivity of polyimide composites. However, in the process of manufacturing the polyimide film, the solvent, DMF, is volatilized. In the curing process of the polyimide film, the temperature condition was optimized so as not to affect the dielectric constant by sufficiently volatilizing the DMF to leave no residue.
As shown in Table 2, the dielectric loss (Df) is extremely low. Dielectric loss is
[image:6.595.236.513.389.694.2]caused by electric conduction and polarization due to the impurities contained
DOI: 10.4236/msa.2019.103016 203 Materials Sciences and Applications Table 2. Properties of polyimide-graphene composites.
Thick. (μm)
Thermal conductivity (Laser Flash Analysis) Permittivity
TCa TDb HCc D
k Df
PI 0.1-00 22.70 8.185 11.708 1.032
PI 0.1-01 11.95 4.575 6.472 1.014 4.338 0.017 PI 0.1-03 13.58 3.344 4.704 1.035 4.773 0.018 PI 0.1-05 14.98 6.674 9.878 1.03 4.646 0.018 PI 0.1-07 13.97 - - - 4.914 0.022 PI 0.1-09 13.70 7.564 11.098 0.99 5.381 0.026 aTC: Thermal Conductivity (W/m·K), bTD: Thermal Diffusivity (mm2/s), cHC: Heat Capacity (J/g/K).
in the material. Therefore, it can be predicted that the graphene acts as a func-tional filler that enhances thermal conductivity rather than acting as an impuri-ty.
4. Conclusions
From this study, the followings were obtained. In order to improve the proper-ties of the polyimide composite, graphene and BN filler were compounded. The dispersion characteristics were quantified as β value from absorbance measure-ment. The optimal conditions were determined as a function of ultrasonic time and filler concentration.
The graphene 0.1 wt% and BN 0.5 wt% polyimide composites showed a ther-mal conductivity of 6.6 W/m∙K by LFA and a dielectric constant of 4.6 by SPDR @10 GHz. The heat transfer effect was enhanced by the network between fillers. However, it is necessary to continuously observe the tendency of dielectric con-stant and loss.
Acknowledgements
This paper is the result of industrial core technology development project by supported by Ministry of Commerce, Industry and Energy jointly and
SKCKOLONPI Co.
Conflicts of Interest
The authors declare no conflicts of interest regarding the publication of this pa-per.
References
[1] Kim, J., Kwon, J., Lee, D., et al. (2016) Heat Dissipation Properties of Polyimide Nanocomposite Films. Korean Journal of Chemical Engineering, 33, 3245-3250.
https://doi.org/10.1007/s11814-016-0158-7
Ko-DOI: 10.4236/msa.2019.103016 204 Materials Sciences and Applications rean Journal of Chemical Engineering, 33, 1938-1941.
https://doi.org/10.1007/s11814-016-0034-5
[3] Lee, S.-B., Jeong, B.-H., et al. (2011) Quantitative Dispersion Evaluation of Carbon Nanotubes Reinforced Polymer Nano-Composites. Polymer(Korea), 35, 60-65. [4] Rahimpour, A. (2011) Preparation and Modification of Nano-Porous Polyimide
(PI) Membranes by UV Photo-Grafting Process: Ultrafiltration and Nanofiltration Performance. Korean Journal of Chemical Engineering, 28, 261-266.