A COMPARATIVE STUDY TO EVALUATE THE EFFECT OF CLEANING SOLUTIONS ON SURFACE
CHARACTERIZATION OF SALIVA CONTAMINATED LITHIUM DISILICATE CERAMIC USING
SCANNING ELECTRON MICROSCOPE. AN IN
*Mageshwari, M.
Bangalore
ARTICLE INFO ABSTRACT
Objectives:
contaminated lithium disilicate ceramic.
Methods:
were conditioned according to manufacturer’s instructions. Scanning electron microscope was used at 1000x and 25000x magnification for qualitative examination. Specimen
(n=15), Group I treated with Ivoclean, Group II treated with 30% Sodium Silicate. Following which the specimens were contaminated with saliva and treated with cleaning solution. Specimens were examined using Scanning electron m
Results and Interpretation:
specimens after saliva contamination and cleaning solutions was better with increased surface irregularities in Group II treate
Ivoclean solution. EDX representative images showed high levels of Si on the ceramic surface after treating with cleaning solutions in Group II when compared to Group I. Deposition of a
silica facilitated an effective bond.
Conclusion:
treatment with cleaning solution of Ivoclean and 30% Sodium silicate was comparable but the surface was more
retention for enhanced bonding.
Copyright©2017, Mageshwari et al. This is an open access article distributed under the Creative Commons Att distribution, and reproduction in any medium, provided the original work is properly cited.
INTRODUCTION
Ceramics has characteristics capable of representing the natural structures present in a tooth and is indicated in a
majority of restorative treatments.Dental ceramic restorations
are extensively used, because they are durable, esthetically appealing, and provide excellent biocompatibility. This preference is directly related to the success of ceramic resin bond that contributes to the restoration longevi
AbdallaPrata et al., 2011) Today, the next generation of
lithium disilicates (IPS e.max Press, IPS e.max CAD, Ivoclar
Vivadent AG, Schaan, Liechtenstein) has multiple
translucencies and opacities and utilizes full press or milling fabrication techniques provided a monoblock approach to final restorations that can then be surface stained and glazed. These monolithic restorations were roughly five times str
traditional feldspathic porcelains. The greatest advantage of this material is extremely low fracture rates based on research
*Corresponding author: Mageshwari, M.
Bangalore Institute of Dental Science, India.
ISSN: 0975-833X
Article History:
Received 13th March, 2017
Received in revised form
20th April, 2017
Accepted 23rd May, 2017
Published online 30th June, 2017
Citation: Mageshwari, M. et al. 2017. “A comparative study to evaluate the effect of cleaning solutions on surface characterization of saliva contaminated
lithium disilicate ceramic using scanning electron microscope. an in
Available online at http://www.journal
Key words:
Lithium disilicate, HF,
Saliva, Ivoclean,
30% Sodium silicate.
RESEARCH ARTICLE
COMPARATIVE STUDY TO EVALUATE THE EFFECT OF CLEANING SOLUTIONS ON SURFACE
CHARACTERIZATION OF SALIVA CONTAMINATED LITHIUM DISILICATE CERAMIC USING
SCANNING ELECTRON MICROSCOPE. AN IN-VITRO STUDY
*Mageshwari, M., Dr. Rahul, G. R. and Dr. Karunakar Shetty
Bangalore Institute of Dental Science, India
ABSTRACT
Objectives: To compare and evaluate the effect of cleaning solutions on surface morphology of saliva
contaminated lithium disilicate ceramic.
Methods: 30 lithium disilicate ceramic discs of IPS e.max were prepared. The substrate surfaces
were conditioned according to manufacturer’s instructions. Scanning electron microscope was used at 1000x and 25000x magnification for qualitative examination. Specimen
(n=15), Group I treated with Ivoclean, Group II treated with 30% Sodium Silicate. Following which the specimens were contaminated with saliva and treated with cleaning solution. Specimens were examined using Scanning electron microscope for qualitative examination.
Results and Interpretation: SEM image analysis showed that the surface appearance of the
specimens after saliva contamination and cleaning solutions was better with increased surface irregularities in Group II treated with 30% Sodium silicate rather than Group I specimens treated with Ivoclean solution. EDX representative images showed high levels of Si on the ceramic surface after treating with cleaning solutions in Group II when compared to Group I. Deposition of a
silica facilitated an effective bond.
Conclusion: The surface appearance of lithium disilicate ceramic after saliva contamination and
treatment with cleaning solution of Ivoclean and 30% Sodium silicate was comparable but the surface was more irregular and porous in Group II treated with sodium silicate suggestive of micromechanical retention for enhanced bonding.
is an open access article distributed under the Creative Commons Attribution License, which distribution, and reproduction in any medium, provided the original work is properly cited.
Ceramics has characteristics capable of representing the natural structures present in a tooth and is indicated in a Dental ceramic restorations are extensively used, because they are durable, esthetically appealing, and provide excellent biocompatibility. This preference is directly related to the success of ceramic resin bond that contributes to the restoration longevity. (Renato Today, the next generation of lithium disilicates (IPS e.max Press, IPS e.max CAD, Ivoclar
) has multiple
translucencies and opacities and utilizes full press or milling fabrication techniques provided a monoblock approach to final restorations that can then be surface stained and glazed. These monolithic restorations were roughly five times stronger than traditional feldspathic porcelains. The greatest advantage of this material is extremely low fracture rates based on research
analysis. Lithium disilicate is a well
categorized based on its chemical composition and application. The IPS e.max lithium disilicate, in particular, is composed of quartz, lithium dioxide, phosphor oxide, alumina, potassium oxide, and other components. This composition created a thermal shock resistant glass ceramic because of the low
thermal expansion that occurred during processing.
Restorations were fabricated from this type of resistant glass ceramic with either lost-wax hot press
modern CAD/CAD milling procedures.
2010) A peculiar characteristic of reinforced ceramic by li
thium disilicate, is the quality to be acid sensitive, in other words, it suffers morphological changes in front of acid treatment with hydrofluoric acid in different concentrations. This phenomenon occurs due to the mi
characteristics of the material. The main crystalline phase consists of elongated lithium disilicate crystals. The second crystalline phase consists of lithium orthophosphate. A glass matrix surrounds both crystalli
Vidotti et al., 2013) The success of ceramic restorations
required the achievement of adequate adhesion between the
International Journal of Current Research
Vol. 9, Issue, 06, pp.53160-53172, June, 2017
comparative study to evaluate the effect of cleaning solutions on surface characterization of saliva contaminated
lithium disilicate ceramic using scanning electron microscope. an in-vitro study”, International Journal of Current Research
Available online at http://www.journalcra.com
z
COMPARATIVE STUDY TO EVALUATE THE EFFECT OF CLEANING SOLUTIONS ON SURFACE
CHARACTERIZATION OF SALIVA CONTAMINATED LITHIUM DISILICATE CERAMIC USING
VITRO STUDY
and Dr. Karunakar Shetty
compare and evaluate the effect of cleaning solutions on surface morphology of saliva
30 lithium disilicate ceramic discs of IPS e.max were prepared. The substrate surfaces were conditioned according to manufacturer’s instructions. Scanning electron microscope was used at 1000x and 25000x magnification for qualitative examination. Specimens were divided into 2 Groups (n=15), Group I treated with Ivoclean, Group II treated with 30% Sodium Silicate. Following which the specimens were contaminated with saliva and treated with cleaning solution. Specimens were
icroscope for qualitative examination.
SEM image analysis showed that the surface appearance of the specimens after saliva contamination and cleaning solutions was better with increased surface d with 30% Sodium silicate rather than Group I specimens treated with Ivoclean solution. EDX representative images showed high levels of Si on the ceramic surface after treating with cleaning solutions in Group II when compared to Group I. Deposition of a thin film of
The surface appearance of lithium disilicate ceramic after saliva contamination and treatment with cleaning solution of Ivoclean and 30% Sodium silicate was comparable but the surface irregular and porous in Group II treated with sodium silicate suggestive of micromechanical
ribution License, which permits unrestricted use,
analysis. Lithium disilicate is a well-known glass ceramic categorized based on its chemical composition and application. The IPS e.max lithium disilicate, in particular, is composed of quartz, lithium dioxide, phosphor oxide, alumina, potassium other components. This composition created a thermal shock resistant glass ceramic because of the low
thermal expansion that occurred during processing.
Restorations were fabricated from this type of resistant glass wax hot pressing techniques or modern CAD/CAD milling procedures. (Robert G. Ritter, A peculiar characteristic of reinforced ceramic by li-thium disilicate, is the quality to be acid sensitive, in other words, it suffers morphological changes in front of acid atment with hydrofluoric acid in different concentrations. This phenomenon occurs due to the micro-structural characteristics of the material. The main crystalline phase consists of elongated lithium disilicate crystals. The second sts of lithium orthophosphate. A glass matrix surrounds both crystalline phases. (Hugo-Alberto The success of ceramic restorations required the achievement of adequate adhesion between the
INTERNATIONAL JOURNAL OF CURRENT RESEARCH
comparative study to evaluate the effect of cleaning solutions on surface characterization of saliva contaminated
ceramic and tooth substrate. The selection of an appropriate adhesive system played a crucial role in the achievement of clinical success. It is recommended that lithium disilicate are pretreated with hydrofluoric acid and silane coupling agents in
order to improve bonding performance. (Fumi Yoshida et al.,
2015)
Saliva contamination is one of the main reasons for decreased bond strength of restorations to tooth substrate. However, it was almost impossible to avoid during the try-in procedure. Therefore, attempts were made to eliminate any inorganic or organic contaminants prior to adhesive cementation. (Yousef E.
Aboush, 1998; Yang et al., 2008; KarstenKlosa et al., 2009)
Previously, many cleaning methods were tested. In 1988,
Nicholls et al., studied glass ceramic surface contamination
with saliva. Phosphoric acid and acetone was used as surface cleaning method and compared. Cleaning with phosphoric acid showed higher bond strength than cleaning with acetone after porcelain restoration was contaminated by saliva. In 1998, Aboush recommended cleaning porcelain surface with phosphoric acid after porcelain surface was contaminated by
saliva. In 2009, Klosa et al. showed that 5% hydrofluoric acid
provided higher bond strengths than the other methods when it was used to clean saliva contaminated lithium disilicate ceramic. Several cleaning solutions has been used for cleaning restorative surfaces such as water, alcohol, acetone, hydrofluoric acid and phosphoric acid. The composition of the cleaning agent should not cause any damages to the restoration surface and provide adhesive securing of dental restorative materials. In addition, it should be applied simply, washed off easily, and it shouldn’t have any negative effects on the fit of
restoration. Millstein et al., suggested that alkaline cleaning
agent was suitable for optimizing the adhesive bond.Sodium
silicate, a compound that was commonly used as cleaning agent with medium alkalinity of pH 11-12.5 exhibited good detergency and saponification. (Jitti Doungsri and Mansuang
Arksornnukit, 2013) Recently "Ivoclean" (Ivoclar Vivadent,
Leischtenstein) has been introduced as non-abrasive cleaning agent that cleans contaminated universal restoration surfaces without damaging the bonding surface of restoration and providing good bond strength. However, there was no adequate
supportive research. (Akın Aladag et al., 2014; Ryo Ishii et al.,
2015; Barbara Lapinska et al., 2015)Literature investigations
indicated that not many studies have been done on the surface morphology of saliva contaminated lithium disilicate specimens treated with different cleaning solutions. The objective of this study was to compare and evaluate the influence of 15% Zirconium oxide (Ivoclean) and 30% sodium silicate solutions on the surface characterization of lithium disilicate before and after saliva contamination.
MATERIALS AND METHODS
Specimen preparation
Thirty specimens were prepared from lithium disilicate ceramics (IPS e.max press; Ivoclar Vivadent AG, Schaan, Liechtenstein) by using lost wax hot pressing technique. They were fabricated in disc shape (diameter: 10 mm, thickness: 3 mm). All of them were wet-polished with 600 grit silicon carbide paper. The specimen surface was conditioned according to the manufacturer’s instructions as follows. Lithium disilicate ceramics were cleaned for 10 minutes in distilled water with ultrasonic cleaner (Sidilu Ultrasonics) then were brought into contact with 5% hydrofluoric acid (IPS
Ceramic Etching gel; Ivoclar Vivadent AG, Schaan, Liechtenstein) for 20 seconds, rinsed for 15 seconds with distilled water, air dried and stored in a sterile container. The specimens were observed under scanning electron microscope at 1k (fig 1a) and 25k (fig 1b) magnification for surface morphology and EDX (fig 1c) obtained for each specimen.
Saliva contamination
Saliva was collected from a healthy person who was refrained from eating and drinking one and half hours prior to the collection procedure. The volunteer was asked to rinse the mouth with 15ml of distilled water to wash out exfoliated cells. Volunteer was asked to sit in an upright position with the head slightly inclined forward so that saliva was collected in the floor of the mouth. Saliva samples were collected from one volunteer after inducing salivation by chewing a piece of paraffin wax and asking the volunteer to spit into a sterile container. For saliva contamination, the specimens were immersed in saliva for one minute. The contaminated specimens were rinsed with deionized water for 15 seconds and air dried for 15 seconds.
Cleaning methods
After contamination 30 specimens were designated into 2 groups (n=15) according to different techniques. The specimens were cleaned and tested according to the cleaning methods.
Ivoclean: applied the cleaning paste (Ivoclean; Ivoclar
Vivadent AG, Schaan, Liechtenstein) for 20 seconds then rinsed with deionized water for 15 seconds and air dried for 15 seconds (Manufacturer’s instruction).
30% Sodium silicate solution: applied the cleaning solution
for 20 seconds then rinsed with deionized water for 15 seconds and air dried for 15 seconds.
SEM Analysis
In order to perform a qualitative micro morphologic examination of ceramic surfaces, all specimens were adhered to the metallic stub by using double sided adhesive carbon tapes and numbered for easy recognition of the sample during SEM examination. As the samples were non conductive in nature for SEM analysis, they were sputter-coated with gold by using gold sputtering unit for 20 sec. The coated samples were then pumped into the Scanning electron microscope. Each sample was examined at 1k (fig 2a,2b) and 25k (fig 3a,3b) magnifications at 5kv and the images obtained were stored. EDX (fig 4a,4b) was obtained for each sample and the data was collected.
Statistical analysis
Student unpaired t-test was used to compare mean wt% and at% of Si, K, O between group 1and group 2. Student paired t-test was used to compare mean wt% and at% of Si, K, O among group 1 and group 2, before and after saliva contamination and cleaning solution.
RESULTS
SEM Analysis: Analysis of the ceramic surface treatments by
scanning electron microscopy (SEM) provided valuable
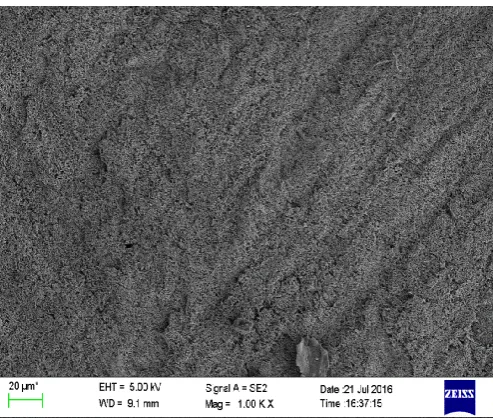
information concerning the resulting topography. SEM photographs of ceramic surface before treatment with a magnification of 1000x of all ceramic surfaces treated with HF showed a smooth surface (fig 1a) and at 25000x magnification (fig 1b) it showed more irregular and porous surface. After saliva contamination and treating with cleaning solution Ivoclean in group I showed a smooth surface under a magnification of 1000x and crater like irregulaties with multiple pits and clogging of the pores formed by the crystalline phase under magnification of 25000x, whereas in group 2 treated with 30% sodium silicate the surface topography remained unchanged similar to specimen treated before contamination.
Energy Dispersive X-ray Spectroscopy (EDX)
The mean weight and atomic percentage are shown in table I,II,III and IV. The high resolutions scans identified decreased deposition of Silica, Potassium and increased Oxygen on the clean lithium disilicate disks. Deposition of a thin film of silica facilitated bonding because of the chemical affinity between the thin film of silica and organoresinous components of luting cements. After contamination with saliva and cleaning with Ivoclean cleaning solution in Group I and 30% sodium silicate cleaning solution in Group II showed increased Silica deposition in Group II, suggesting for improved bonding with luting cement .
Graph interpretation
Graph 1
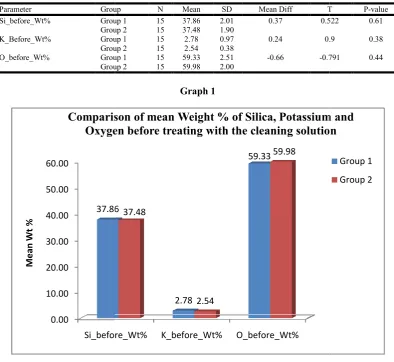
The mean weight % of silica, potassium and oxygen was not significantly different among group 1 and group 2 before treating with cleaning solution. The mean wt % of silica in group 1 was 37.86± 2.01 and 37.48 ±1.90 in group 2 and there was no statistically significant difference (p=0.61), similarly the mean wt % of potassium in group 1 was 2.78 ± 0.97 and group 2 was 2.54 ±0.38 and it was not significantly different (p=0.38). There was no significant difference in mean wt % of oxygen between group 1 (59.33 ±2.51) and group 2 (59.98 ±2.00), (p=0.44).
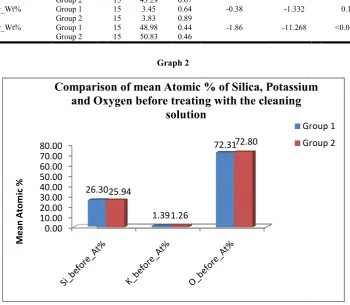
Graph 2
There was significant difference in mean wt % of silica and oxygen between group 1 and group 2 after treating with cleaning solution whereas there was no significant difference in mean wt % of potassium between group 1 and 2. The mean wt % of silica in group 1 (40.06± 0.71) was significantly lower from group 2 (43.29 ±0.67) (p<0.001), similarly the mean wt % of oxygen in group 1 was 48.98 ± 0.44 was lower compared to group 2 (50.83±0.43) and it was significantly significant (p=0.001), whereas there was no significant difference in mean wt % of potassium between group 1 (3.45 ±0.64) and group 2 ( 3.83 ±0.89), (p=0.19).
Graph 3
The mean atomic % of silica, potassium and oxygen was not significantly different among group 1 and group 2 before treating with cleaning solution. The mean atomic % of silica in group 1 was 26.30± 1.73 and 25.94 ±1.58 in group 2 and there was no statistically significant difference (p=0.56), similarly the mean atomic % of potassium in group 1 was 1.39 ± 0.50
and group 2 was 1.26 ±0.20 and it was not significantly different (p=0.37). There was no significant difference in mean atomic % of oxygen between group 1 (72.31 ±1.99) and group 2 (72.80 ±1.64), (p=0.47).
Graph 4
There was significant difference in mean atomic % of silica between group 1 and group 2 after treating with cleaning solution whereas there was no significant difference in mean wt % of potassium and oxygen between group 1 and 2. The mean atomic % of silica in group 1 (30.62± 0.30) was significantly lower from group 2 (31.43 ±0.40) (p<0.001), whereas there was no significant difference in mean wt % of potassium between group 1 (1.90 ±0.35) and group 2 ( 2.00 ±0.47), (p=0.52). Similarly the mean atomic % of oxygen in group 1 was 61.57 ± 16.02 and group 2 was 64.76 ±0.40 and it was not significantly different (p=0.45).
Graph 5
There was significant difference in mean wt % of silica, potassium and oxygen before and after treating with cleaning solution in group 1. The mean wt % of silica was significantly lower before using cleaning solution (37.86 ± 2.01) when compared to after using cleaning solution (40.06 ± 0.71) p=0.001, similarly the mean wt % of potassium (2.78 ± 0.97) and oxygen (59.33 ± 2.51) was significantly lower before treating with cleaning solution when compared to after treatment with cleaning solution (3.45 ± 0.64) and (48.98 ±0.44), p=0.001 respectively.
Graph 6
There was significant difference in mean atomic % of silica, potassium and oxygen before and after treating with cleaning solution in group 1. The mean atomic % of silica was significantly lower before using cleaning solution (26.30 ± 1.73) when compared to after using cleaning solution (30.62±0.30) p=0.001, similarly the mean atomic % of potassium (1.39± 0.97) was significantly lower before treating with cleaning solution when compared to after treatment with cleaning solution (1.90 ± 0.35) whereas the mean atomic % of oxygen was significantly higher before treating with cleaning solution (72.31 ± 1.99) when compared to after treatment (61.57±16.02) p= 0.02.
Graph 7
There was significant difference in mean wt % of silica, potassium and oxygen before and after treating with cleaning solution in group 2. The mean wt % of silica was significantly lower before using cleaning solution (37.48 ± 1.90) when compared to after using cleaning solution (43.29±0.67) p=0.001, similarly the mean wt % of potassium (2.54± 0.38) was significantly lower before treating with cleaning solution when compared to after treatment with cleaning solution (3.83 ± 0.89) p=0.001, whereas the mean atomic % of oxygen was significantly higher before treating with cleaning solution (59.98 ± 2.00) when compared to after treatment (50.83±0.46) p= 0.001.
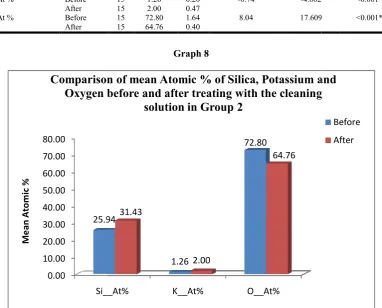
Graph 8
There was significant difference in mean atomic % of silica, potassium and oxygen before and after treating with cleaning
solution in group 2. The mean atomic % of silica was significantly higher before using cleaning solution (25.94 ± 1.58) when compared to after using cleaning solution (31.43±0.40) p=0.001, similarly the mean atomic % of oxygen (72.80± 1.64) was significantly higher before treating with
cleaning solution when compared to after treatment with cleaning solution (64.76 ± 0.40), p=0.001, whereas the mean atomic % of potassium was significantly lower before treating with cleaning solution (1.26 ± 0.20) when compared to after treatment (2.00±0.47) p= 0.001.
[image:4.595.50.551.123.309.2]Figure 1. Specimen Before Contamination (A) Under 1k Magnification (B) Under 25k Magnification
Figure 1 (C). EDX before contamination
Element Weight% Atomic%
O K 62.28 74.60
Si K 35.98 24.55
K K 1.74 0.85
Totals 100.00
Spectrum processing :
Peak possibly omitted : 1.020 keV
Processing option : All elements analyzed (Normalised) Number of iterations = 4
Standard :
O SiO2 1-Jun-1999 12:00 AM Si SiO2 1-Jun-1999 12:00 AM
K MAD-10 Feldspar 1-Jun-1999 12:00 AM
[image:4.595.337.553.342.511.2]Figure 2A. Group i specimen at 1k magnification after treating with ivoclean
Figure 2B. Group ii specimen at 1k magnification after treating with 30% sodium silicate
[image:5.595.41.287.304.503.2]Figure 3A. Group I specimen at 25k magnification after treating with ivoclean
Figure 3B. Group ii specimen at 25k magnification after treating with 30% sodium silicate
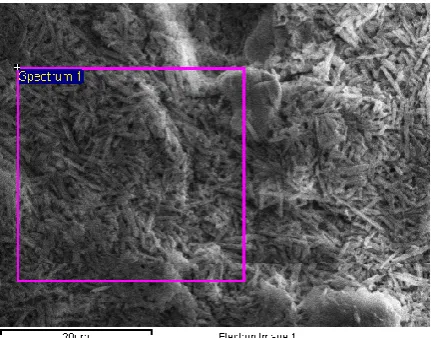
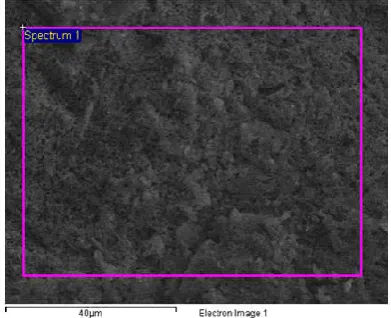
[image:5.595.315.554.308.485.2]Figure 4A. EDX-after contamination with saliva and ivoclean cleaning solution for group i
[image:6.595.151.438.697.768.2]Figure 4B. EDX-after contamination with saliva and 30% sodium silicate cleaning solution for group ii
Table I. Comparison of mean Weight % of Silica, Potassium and Oxygen before and after treating with the cleaning solution in Group 1 using student paired t test
Parameter Group N Mean SD Mean Diff T P-value
Si_Wt % Before 15 37.86 2.01 -2.20 -3.985 0.001*
After 15 40.06 0.71
K_Wt % Before 15 2.78 0.97 -0.68 -3.129 0.007*
After 15 3.45 0.64
O_Wt % Before 15 59.33 2.51 10.35 16.030 <0.001*
After 15 48.98 0.44
Table II. Comparison of mean Atomic % of Silica, Potassium and Oxygen before and
Parameter Group
Si_At % Before
After
K_At % Before
After
O_At % Before
After
Parameter Group
Si_Wt % Before
After
K_Wt % Before
After
O_Wt % Before
[image:7.595.157.435.302.373.2]After
Table IV. Comparison of mean Atomic % of Silica, Potassium and Oxygen before and after
Parameter Group
Si_At % Before
After
K_At % Before
After
O_At % Before
[image:7.595.100.495.416.778.2]After
Table 1. Comparison of mean Weight % of Silica, Potassium and Oxygen before treating with the cleaning solution using student
Parameter Group
Si_before_Wt% Group 1
Group 2
K_Before_Wt% Group 1
Group 2
O_before_Wt% Group 1
Group 2
0.00 10.00 20.00 30.00 40.00 50.00 60.00
Si_before_Wt% 37.86
Me
an
W
t
%
Comparison of mean Weight % of Silica, Potassium and
Oxygen before treating with the cleaning solution
53166 International Journal of Current Research,
Comparison of mean Atomic % of Silica, Potassium and Oxygen before and after treating with the cleaning solution in Group 1 using student paired t test
Group N Mean SD Mean Diff T P-value
Before 15 26.30 1.73 -4.32 -9.349 <0.001*
After 15 30.62 0.30
Before 15 1.39 0.50 -0.51 -4.513 <0.001*
After 15 1.90 0.35
Before 15 72.31 1.99 10.74 2.583 0.02*
After 15 61.57 16.02
Group 2 using student paired t test
Group N Mean SD Mean Diff T P-value
Before 15 37.48 1.90 -5.81 -12.106 <0.001*
After 15 43.29 0.67
Before 15 2.54 0.38 -1.30 -4.260 0.001*
After 15 3.83 0.89
Before 15 59.98 2.00 9.15 15.810 <0.001*
After 15 50.83 0.46
Comparison of mean Atomic % of Silica, Potassium and Oxygen before and after treating with the cleaning solution in Group 2 using student paired t test
Group N Mean SD Mean Diff T P-value
Before 15 25.94 1.58 -5.49 -13.579 <0.001*
After 15 31.43 0.40
Before 15 1.26 0.20 -0.74 -4.602 <0.001*
After 15 2.00 0.47
Before 15 72.80 1.64 8.04 17.609 <0.001*
After 15 64.76 0.40
Comparison of mean Weight % of Silica, Potassium and Oxygen before treating with the cleaning solution using student unpaired t test
Group N Mean SD Mean Diff T
Group 1 15 37.86 2.01 0.37 0.522
Group 2 15 37.48 1.90
Group 1 15 2.78 0.97 0.24 0.9
Group 2 15 2.54 0.38
Group 1 15 59.33 2.51 -0.66 -0.791
Group 2 15 59.98 2.00
Graph 1
Si_before_Wt% K_before_Wt% O_before_Wt%
37.86
2.78
59.33
37.48
2.54
59.98
Comparison of mean Weight % of Silica, Potassium and
Oxygen before treating with the cleaning solution
International Journal of Current Research, Vol. 9, Issue, 06, pp.53160-53172, June, 201
after treating with the cleaning solution in
value <0.001*
0.001*
value <0.001*
0.001*
<0.001*
treating with the cleaning solution in
Comparison of mean Weight % of Silica, Potassium and Oxygen before treating with the cleaning solution using student
T P-value
0.522 0.61
0.9 0.38
0.791 0.44
Comparison of mean Weight % of Silica, Potassium and
Oxygen before treating with the cleaning solution
Group 1
Group 2
Table 2. Comparison of mean Weight % of Silica, Potassium and Oxygen After treating with the cleaning solution
Parameter Group
Si_After_Wt% Group 1
Group 2
K_After_Wt% Group 1
Group 2
O_After_Wt% Group 1
Group 2
Table 3. Comparison of mean Atomic % of Silica, Potassium and Oxygen before treating with the cleaning solution using student
Parameter Group
Si_before_At% Group 1
Group 2
K_Before_At% Group 1
Group 2
O_before_At% Group 1
Group 2
0.00 10.00 20.00 30.00 40.00 50.00 60.00 70.00 80.00
26.30
Me
an
Atom
ic
%
Comparison of mean Atomic % of Silica, Potassium
and Oxygen before treating with the cleaning
0.00 10.00 20.00 30.00 40.00 50.00 60.00 70.00 80.00
Si_before_At% 26.30
Me
an
Atom
ic
%
Comparison of mean Atomic % of Silica, Potassium
and Oxygen before treating with the cleaning solution
53167 Mageshwari et al. A comparative study to evaluate the effect of cleaning solutions on surface characterization of saliva contaminated lithium disilicate ceramic using
Comparison of mean Weight % of Silica, Potassium and Oxygen After treating with the cleaning solution unpaired t test
N Mean SD Mean Diff t
15 40.06 0.71 -3.24 -12.867
15 43.29 0.67
15 3.45 0.64 -0.38 -1.332
15 3.83 0.89
15 48.98 0.44 -1.86 -11.268
15 50.83 0.46
Graph 2
Comparison of mean Atomic % of Silica, Potassium and Oxygen before treating with the cleaning solution using student unpaired t test
N Mean SD Mean Diff t
15 26.30 1.73 0.36 0.597
15 25.94 1.58
15 1.39 0.50 0.13 0.918
15 1.26 0.20
15 72.31 1.99 -0.49 -0.736
15 72.80 1.64
Graph 3
26.30
1.39
72.31
25.94
1.26
72.80
Comparison of mean Atomic % of Silica, Potassium
and Oxygen before treating with the cleaning
solution
Group 1
Group 2
Si_before_At% K_before_At% O_before_At%
26.30
1.39
72.31
25.94
1.26
72.80
Comparison of mean Atomic % of Silica, Potassium
and Oxygen before treating with the cleaning solution
Group 1
Group 2
comparative study to evaluate the effect of cleaning solutions on surface characterization of saliva contaminated lithium disilicate ceramic using scanning electron microscope. An in-vitro study
Comparison of mean Weight % of Silica, Potassium and Oxygen After treating with the cleaning solution using student
P-value <0.001*
0.19
<0.001*
Comparison of mean Atomic % of Silica, Potassium and Oxygen before treating with the cleaning solution using student
P-value 0.56
0.37
0.47
Comparison of mean Atomic % of Silica, Potassium
Group 1
Group 2
Comparison of mean Atomic % of Silica, Potassium
and Oxygen before treating with the cleaning solution
Group 1
Group 2
[image:8.595.100.487.467.792.2]Table 4. Comparison of mean Atomic % of Silica, Potassium and Oxygen After treating with the cleaning solution using student
Parameter Group
Si_After_At% Group 1
Group 2
K_After_At% Group 1
Group 2
O_After_At% Group 1
Group 2
Table 5. Comparison of mean Weight % of Silica, Potassium and Oxygen before and after treating with the cleaning solution in
Parameter Group
Si_Wt % Before
After
K_Wt % Before
After
O_Wt % Before
After
0.00 10.00 20.00 30.00 40.00 50.00 60.00 70.00
Si_after_At% 30.62
Me
an
Atom
ic
%
Comparison of mean Atomic % of Silica, Potassium
and Oxygen After treating with the cleaning solution
0.00 10.00 20.00 30.00 40.00 50.00 60.00
Si__Wt% 37.86
Me
an
Wt
%
Comparison of mean Weight % of Silica, Potassium
and Oxygen before and after treating with the
53168 International Journal of Current Research,
Comparison of mean Atomic % of Silica, Potassium and Oxygen After treating with the cleaning solution using student unpaired t test
N Mean SD Mean Diff T
15 30.62 0.30 -0.81 -6.215
15 31.43 0.40
15 1.90 0.35 -0.10 -0.656
15 2.00 0.47
15 61.57 16.02 -3.18 -0.769
15 64.76 0.40
Graph 4
Comparison of mean Weight % of Silica, Potassium and Oxygen before and after treating with the cleaning solution in Group 1 using student paired t test
N Mean SD Mean Diff T
15 37.86 2.01 -2.20 -3.985
15 40.06 0.71
15 2.78 0.97 -0.68 -3.129
15 3.45 0.64
15 59.33 2.51 10.35 16.030
15 48.98 0.44
Graph 5
Si_after_At% K_after_At% O_after_At%
30.62
1.90
61.57
31.43
2.00
64.76
Comparison of mean Atomic % of Silica, Potassium
and Oxygen After treating with the cleaning solution
Si__Wt% K__Wt% O__Wt%
37.86
2.78
59.33
40.06
3.45
48.98
Comparison of mean Weight % of Silica, Potassium
and Oxygen before and after treating with the
cleaning solution in Group 1
International Journal of Current Research, Vol. 9, Issue, 06, pp.53160-53172, June, 201
Comparison of mean Atomic % of Silica, Potassium and Oxygen After treating with the cleaning solution using student
P-value <0.001*
0.52
0.45
Comparison of mean Weight % of Silica, Potassium and Oxygen before and after treating with the cleaning solution in
P-value 0.001*
0.007*
16.030 <0.001*
Comparison of mean Atomic % of Silica, Potassium
and Oxygen After treating with the cleaning solution
Group 1
Group 2
Comparison of mean Weight % of Silica, Potassium
Before
After
Table 6. Comparison of mean Atomic % of Silica, Potassium and Oxygen before and after treating with
Parameter Group
Si_At % Before
After
K_At % Before
After
O_At % Before
After
Table 7. Comparison of mean Weight % of Silica, Potassium and Oxygen before and after treating with the cleaning solution in
Parameter Group
Si_Wt % Before
After
K_Wt % Before
After
O_Wt % Before
After
0.00 10.00 20.00 30.00 40.00 50.00 60.00 70.00 80.00
Si__Wt% 26.30
Me
an
Atom
ic
%
Comparison of mean Atomic % of Silica, Potassium
and Oxygen before and after treating with the cleaning
0.00 10.00 20.00 30.00 40.00 50.00 60.00
Si__Wt% 37.48
Me
an
Wt
%
Comparison of mean Weight % of Silica, Potassium
and Oxygen before and after treating with the
53169 Mageshwari et al. A comparative study to evaluate the effect of cleaning solutions on surface characterization of saliva contaminated lithium disilicate ceramic using scanning electron microscope. An in
Comparison of mean Atomic % of Silica, Potassium and Oxygen before and after treating with Group 1 using student paired t test
N Mean SD Mean Diff T
15 26.30 1.73 -4.32 -9.349
15 30.62 0.30
15 1.39 0.50 -0.51 -4.513
15 1.90 0.35
15 72.31 1.99 10.74 2.583
15 61.57 16.02
Graph 6
Comparison of mean Weight % of Silica, Potassium and Oxygen before and after treating with the cleaning solution in Group 2 using student paired t test
N Mean SD Mean Diff T
15 37.48 1.90 -5.81 -12.106
15 43.29 0.67
15 2.54 0.38 -1.30 -4.260
15 3.83 0.89
15 59.98 2.00 9.15 15.810
15 50.83 0.46
Graph 7
Si__Wt% K__Wt% O__Wt%
26.30
1.39
72.31
30.62
1.90
61.57
Comparison of mean Atomic % of Silica, Potassium
and Oxygen before and after treating with the cleaning
solution in Group 1
Si__Wt% K__Wt% O__Wt%
37.48
2.54
59.98
43.29
3.83
50.83
Comparison of mean Weight % of Silica, Potassium
and Oxygen before and after treating with the
cleaning solution in Group 2
comparative study to evaluate the effect of cleaning solutions on surface characterization of saliva contaminated lithium ceramic using scanning electron microscope. An in-vitro study
Comparison of mean Atomic % of Silica, Potassium and Oxygen before and after treating with the cleaning solution in
P-value <0.001*
<0.001*
0.02*
Comparison of mean Weight % of Silica, Potassium and Oxygen before and after treating with the cleaning solution in
P-value <0.001*
0.001*
<0.001*
Comparison of mean Atomic % of Silica, Potassium
and Oxygen before and after treating with the cleaning
Before
After
Comparison of mean Weight % of Silica, Potassium
Before
After
DISCUSSION
Cleanliness of the bonding surfaces had an influence on the success of the durable bond strength. Therefore, removal of the saliva contaminants that occurred during the try in procedures from ceramic inner surfaces before adhesion played an important role in the longevity of the restorations.
Aladag et al., 2014) Effective bonding required physical and
chemical alterations of the ceramic surface to obtain satisfactory levels of wettability of the adhesive agent.
(Aljomar JoseVechiatoFilho et al., 2014)In this study, surface
treatment of lithium disilicate ceramic was performed by making contact with 5% hydrofluoric acid for 20 seconds. As HF offers hazardous effects to health, the ceramic specimens were etched in a laboratory cupboard under ventilatio wearing acid resistant gloves, coat cover with plastic apron and face shield. The etching gel was rinsed in a polyethylene cup for 30 seconds and the diluted solution was neutralized using the neutralizing powder calcium carbonate (CaCO
sodium carbonate (Na2CO3) for 5 min. (Lucas Villa Zogheib
al., 2011) Hydrofluoric acid reacted with glass matrix of
lithium disilicate ceramic. This glass matrix was selectively removed and the crystalline structure was exposed. As a result, the surface of ceramic was roughened. The roughness of ceramic surface increased surface energy which increased the opportunity of contamination and the difficulty of removing contamination. (Jitti Doungsri and Mansuang
2013)SEM images of the specimens treated
[image:11.595.108.491.125.433.2]showed a smooth surface under a magnification of 1k and 25k (fig 1a, 1b) In the present study, HF etching increased ceramic
Table 8. Comparison of mean Atomic % of Silica, Potassium and Oxygen before and after treating with the cleaning solution in
Parameter Group
Si_At % Before
After
K_At % Before
After
O_At % Before
After 0.00 10.00 20.00 30.00 40.00 50.00 60.00 70.00 80.00 Si__At% 25.94 Me an Atom ic %
Comparison of mean Atomic % of Silica, Potassium and
Oxygen before and after treating with the cleaning
53170 International Journal of Current Research,
Cleanliness of the bonding surfaces had an influence on the success of the durable bond strength. Therefore, removal of the saliva contaminants that occurred during the try in procedures from ceramic inner surfaces before adhesion played an in the longevity of the restorations. (Akın Effective bonding required physical and chemical alterations of the ceramic surface to obtain satisfactory levels of wettability of the adhesive agent. In this study, surface treatment of lithium disilicate ceramic was performed by making contact with 5% hydrofluoric acid for 20 seconds. As HF offers hazardous effects to health, the ceramic specimens were etched in a laboratory cupboard under ventilation, wearing acid resistant gloves, coat cover with plastic apron and face shield. The etching gel was rinsed in a polyethylene cup for 30 seconds and the diluted solution was neutralized using
the neutralizing powder calcium carbonate (CaCO3) and
Lucas Villa Zogheib et
Hydrofluoric acid reacted with glass matrix of lithium disilicate ceramic. This glass matrix was selectively removed and the crystalline structure was exposed. As a result, c was roughened. The roughness of ceramic surface increased surface energy which increased the opportunity of contamination and the difficulty of removing Mansuang Arksornnukit, SEM images of the specimens treated with HF solution showed a smooth surface under a magnification of 1k and 25k (fig 1a, 1b) In the present study, HF etching increased ceramic
roughness by dissolving crystalline phase and increasing micro-mechanical retention in all experimental specimens, within the etching time recommended by the manufacturer.
Saliva contamination could be cleaned with several regimens; however, limited literature has been found about the most effective method to remove the remnant
of the various types of ceramics. The universal paste used in this study is an alkaline suspension of zirconium dioxide and sodium hydroxide particles in water, and it has been reported to absorb the phosphate contaminants in the m
clean surface. Ivoclean undergoes a equilibrium reaction, in which formation of bond to large amount of one reactant is more probable than to any other reactant that is less frequent. Due to the size and concentration of the particles in th medium, phosphate contaminants are much more likely to bond to them than to the surface of the ceramic restoration. Ivoclean absorbed the phosphate contaminants like a sponge and clogged the pores formed by crystalline phase. It was effective to decontaminate protein and oil substance.
Dounsgiri (2013) proved that Ivoclean cleaned saliva contaminated lithium disilicate ceramic, had shear bond strength higher than specimens treated only with water and Hydroflouric acid. Although, it had lo
than sodium silicate solution cleaning, it was not statistically significant difference. It might be claimed that Ivoclean was effective in removing saliva contamination.
composition was used in particular to remove saliva contamination, such as phosphorus
(JittiDoungsri and MansuangArksornnukit
Comparison of mean Atomic % of Silica, Potassium and Oxygen before and after treating with the cleaning solution in Group 2 using student paired t test
N Mean SD Mean Diff T
15 25.94 1.58 -5.49 -13.579
15 31.43 0.40
15 1.26 0.20 -0.74 -4.602
15 2.00 0.47
15 72.80 1.64 8.04 17.609
15 64.76 0.40
Graph 8
Si__At% K__At% O__At%
25.94 1.26 72.80 31.43 2.00 64.76
Comparison of mean Atomic % of Silica, Potassium and
Oxygen before and after treating with the cleaning
solution in Group 2
International Journal of Current Research, Vol. 9, Issue, 06, pp.53160-53172, June, 2017
roughness by dissolving crystalline phase and increasing retention in all experimental specimens, within the etching time recommended by the manufacturer.
Saliva contamination could be cleaned with several regimens; however, limited literature has been found about the most effective method to remove the remnants from the inner surface of the various types of ceramics. The universal paste used in this study is an alkaline suspension of zirconium dioxide and sodium hydroxide particles in water, and it has been reported to absorb the phosphate contaminants in the media, leaving a clean surface. Ivoclean undergoes a equilibrium reaction, in which formation of bond to large amount of one reactant is more probable than to any other reactant that is less frequent. Due to the size and concentration of the particles in the medium, phosphate contaminants are much more likely to bond to them than to the surface of the ceramic restoration. Ivoclean absorbed the phosphate contaminants like a sponge and clogged the pores formed by crystalline phase. It was effective inate protein and oil substance. A study by Jitti proved that Ivoclean cleaned saliva contaminated lithium disilicate ceramic, had shear bond strength higher than specimens treated only with water and Hydroflouric acid. Although, it had low shear bond strength than sodium silicate solution cleaning, it was not statistically significant difference. It might be claimed that Ivoclean was effective in removing saliva contamination. Ivoclean’s composition was used in particular to remove saliva contamination, such as phosphorus-containing saliva proteins.
MansuangArksornnukit, 2013)
Comparison of mean Atomic % of Silica, Potassium and Oxygen before and after treating with the cleaning solution in
P-value
13.579 <0.001*
<0.001*
17.609 <0.001*
Comparison of mean Atomic % of Silica, Potassium and
Oxygen before and after treating with the cleaning
Before
After
Sodium silicate solution was chosen as a possible alternative method because it was an alkaline cleaning agent. This study used 30% sodium silicate solution because the cleaning composition according to the invention with liquid carrier medium was most preferably around 70-90 wt%, relative to the total weight of composition. (Jitti Doungsri and Mansuang Arksornnukit, 2013) Sodium silicate solution cleaning showed the unaltered surface after saliva contamination of lithium disilicate ceramic, when compared to significant changes seen on Ivoclean treated lithium disilicate ceramic using SEM. Therefore, sodium silicate was found to be effective decontaminated saliva from lithium disilicate ceramic. After saliva contamination and treating with cleaning solution in Group I treated with Ivoclean, SEM images showed a smooth surface under magnification of 1000x and clogging of the porous crystalline phase under magnification of 25000x as shown in (fig 2A, 3A), whereas in Group 2 treated with 30% Sodium Silicate solution the surface topography remained unchanged similar to specimen treated before contamination as shown in (fig 2B,3B). The present study confirmed that differences in surface pattern after contamination and using cleaning solutions affected the retention of high strength core
ceramics. (AlessioCasucci et al., 2011) In particular, 30%
Sodium Silicate resulted in significantly highly irregular surface. It has also been demonstrated through EDX analysis that saliva contamination and cleaning solution increased the Silica levels in Group II specimens, leading to an alteration in the composition of the surface.
EDX representative images showed high levels of Silica on the ceramic surface after treating with cleaning solutions. Hydrophilicity of the substrate material should be improved to reach surfaces with a higher bonding capacity. Silica molecules deposited on the ceramic surface might facilitate bonding because of the chemical affinity between the thin film of silica and the organoresinous components of the luting resins.
(Aljomar JoseVechiatoFilho et al., 2014)Lithium disilicate is
an acid sensitive material. The acid treatment with 5% HF, saliva contamination and treatment with cleaning solutions caused morphological changes in the surface, as observed in (fig 2B,3B) and is responsible for the improvement of the micro-mechanical retention of the materials such as resinous
cements. (Hugo-Alberto Vidotti et al., 2013) This study
evaluated the influence of cleaning solution after saliva contamination on the surface appearance of lithium disilicate ceramic, with a significant change in the appearance of the surface between Group I and Group II, and no significant difference was found in the EDX analyzed by SEM. Further in-vitro and in-vivo studies should be performed to evaluate the effectiveness of the tested surface treatments in combination with resin luting agents for cyclic load of bonded ceramic restorations.
Conclusion
Within the limitations of the present study and on the basis of the findings of this study and its statistical analysis, the following conclusions can be drawn.
1. The effect of cleaning solution on the surface
appearance of lithium disilicate ceramic after contamination with saliva was variable.
2. 30% sodium silicate solution was found to be more
effective in decontaminating the saliva contaminated lithium disilicate ceramic than Ivoclean.
3. Deposition of thin film of silica on the saliva
contaminated lithium disilicate ceramic facilitated bonding.
4. 30% Sodium silicate solution was the most effective
decontaminant.
REFERENCES
Akın Aladag, BaharElter, ErhanComlekoglu, BurcuKanat, Mehmet Sonugelen, AtillaKesercioglu & Mutlu Ozcan. 2014. Effect of Different Cleaning Regimens on the Adhesion of Resin to Saliva-Contaminated Ceramics.
Journal of Prosthodontics, 1-10.
AlessioCasucci, Francesca Monticelli, Cecilia Goracci, Claudia Mazzitelli, AmerigoCantoro, Federica Papacchini, Marco Ferrari. 2011. Effect of surface pre-treatments on the zirconia ceramic–resin cement microtensile bond
strength. Dental Materials, 27: 1024-30.
Aljomar JoseVechiatoFilho, Daniela Micheline dos Santos, Marcelo Coelho Goiato, Rodrigo Antonio de Medeiros, Amalia Moreno, Liliane da Rocha Bonatto, and ElidianeCipriano Rangel. 2014. Surface characterization of lithium disilicate ceramic after nonthermal plasma
treatment. J Prosthet Dent., 112:1156-1163.
BahadırErsu, BulemYuzugullu, A. RuyaYazici, SenayCanay. 2009. Surface roughness and bond strengths of glass-infiltrated alumina-ceramics prepared using various surface
treatments. Journal of Dentistry, 37: 848-856.
Barbara Lapinska, Monika Magdalena, LeszekKlimek. 2015.
Surface structure and chemical composition of
Hydroflouric acid-etched lithium disilicate ceramic after application of different cleaning methods of saliva
contamination removal. Dent. Med. Probl., 52(1): 71–77.
Daniela Micheline dos Santos, Emily VivianneFreitas da Silva, Aljomar José Vechiato-Filho, Paulo Francisco Cesar, ElidianeCipriano Rangel, NilsonCristino da Cruz, and Marcelo Coelho Goiato. 2016. Aging effect of atmospheric air on lithium disilicate ceramic after nonthermal plasma
treatment. J Prosthet Dent., 1-8.
Fumi Yoshida, AkimasaTsujimoto, Ryo Ishii, KieNojiriI, ToshikiTakamizawa, Masashi Miyazaki and Mark A. Latta. 2015. Influence of surface treatment of contaminated lithium disilicate and leucite glass ceramics on surface free
energy and bond strength of universal adhesives. Dental
Materials Journal, 34(6): 855–862.
Giuliano, C., D. Selaj, E. Manzon, D. Pasqualini, E. Berutti, N. Scotti. 2014. Bonding to zirconia and lithium-disilicate:
Analysis of different chemical treatments. Dental
Materials, 30S: e22.
Hugo-Alberto Vidotti, Rudan-Paraiso Garcia, Paulo-Cesar-Rodrigues Conti, Jefferson-Ricardo Pereira, Accácio-Lins-do Valle. 2013. Influence of low concentration acid treatment on lithium disilicate core/veneer ceramic bond
strength. J ClinExp Dent., 5(4):e157-62.
Iorizzo, G.M., F. Prete, B. Mazzanti, G. Timellini, R. Scotti, P. Baldissara. 2014. Effects of hydrofluoric acid etching on
lithium disilicate. Dent Mat., 30:e24http://dx.doi.org/10.
1016/j.dental.2014.08.048.
Jin-HoPhark, Sillas Duarte Jr, Harold Kahn, Markus B. Blatz,
AvishaiSadan. 2009. Influence of contamination and
cleaning on bond strength to modified zirconia. Dental
Materials, 25: 1541–1550.
JittiDoungsri and MansuangArksornnukit. 2013. Effect of Cleaning Solutions on Shear Bond Strength of Resin Cement to Saliva Contaminated Lithium Disilicate
Ceramic. International Graduate Research Conference, Dec 20, p.193-198
KarstenKlosa, Stefan Wolfart, Frank Lehmann, Hans-JurgenWenz, Matthias Kern. 2009. The Effect of Storage
Conditions, Contamination Modes and Cleaning
Procedures on the Resin Bond Strength to Lithium
Disilicate Ceramic. J Adhes Dent., 11: 127-135.
Lea Vuletic, Kristina Peros, StjepanSpalj, DunjaRogic, Ivan Alajbeg. 2014. Time-related Changes in pH, Buffering Capacity and Phosphate and Urea Concentration of
Stimulated Saliva. Oral Health Prev Dent., 1:45-53.
Lucas Villa Zogheib, Alvaro Della Bona,
EstevaoTomomitsuKimpara, John F. Mccabe. 2011. Effect of Hydrofluoric Acid Etching Duration on the Roughness and Flexural Strength of a LithiumDisilicate-Based Glass
Ceramic. Braz Dent J., 22(1): 45-50.
Markus B. Blatz, Edward J. Swift Jr. 2007. Adhesive
cementation of high-strength ceramic. Journal
Compilation, 19(5): 238-239.
Mithra N. Hegde, DivyaTahiliani, Shilpa Shetty1,
DarshanaDevadiga. 2014. Salivary alkaline phosphatase
and calcium in caries‑active type II diabetes mellitus
patients: An in vivo study. Journal of Contemporary
Clinical Dentistry, 5(4): 440-445.
Naves, LZ., CJ Soares, RR Moraes, LS Gonçalves, MAC Sinhoreti, L Correr-Sobrinho. 2010. Surface/Interface Morphology and Bond Strength to Glass Ceramic Etched
for different Periods. Operative Dentistry, 35(4): 420-427.
Nicola Mobilio, Alberto Fasiol, Francesco Mollica and Santo Catapano. 2015. Effect of Different Luting Agents on the Retention of Lithium Disilicate Ceramic Crowns.
Materials, 8: 1604-1611.
Quaas, A.C., B. Yang, M. Kern. 2007. Panavia F 2.0 bonding to contaminated zirconia ceramic after different cleaning
procedures. Dental materials, 23: 506–512.
Raquel Castillo de Oyagüe, Francesca Monticelli, Manuel Toledano, Estrella Osorio, Marco Ferrari, Raquel Osorio.
2009. Influence of surface treatments and resin cement
selection on bonding to densely-sintered zirconium-oxide
ceramic. Dental Materials, 25: 172–179.
Renato AbdallaPrata, ViniciusPires de Oliveira, Fernando Carlos Hueb de Meneze, Gilberto Antoˆ nio Borges, Osvaldo Scopin de Andrade, Luciano de Souza Goncalves. 2011. Effect of ‘Try-in’ paste removal method on bond
strength to lithium disilicate ceramic. Journal of Dentistry,
39: 863-870.
Robert G. Ritter. 2010. Multifunctional Uses of a Novel
Ceramic-Lithium Disilicate. Journal Compilation, 22(5):
332-341.
RoyaZandparsa, Nayrouz A. Talua, Matthew D. Finkelman, & Scott E. Schaus. 2014. An In Vitro Comparison of Shear Bond Strength of Zirconia to Enamel Using Different
Surface Treatments. Journal of Prosthodontics, 23:
117-123.
Ryo Ishii, AkimasaTsujimoto, ToshikiTakamizawa, Keishi Tsubota, Takayuki Suzuki, Yutaka Shimamuraand Masashi Miyazaki. 2015. Influence of surface treatment of contaminated zirconia on surface free energy and resin
cement bonding. Dental Materials Journal, 1-7.
Vittorio Cacciafesta, Maria Francesca Sfondrini, Lucia Baluga, Andrea Scribante and Catherine Klersy. 2003. Use of a self-etching primer in combination with a resin-modified glass ionomer: Effect of water and saliva
contamination on shear bond strength. Am J Orthod
Dentofacial Orthop., 124 :420-6.
Yang, B., S. Wolfart, M. Scharnberg, K. Ludwig, R. Adelung, and M. Kern. 2008. Influence of saliva Contamination on
Zirconia Ceramic Bonding. Dental materials, 24: 508–513.
Yang, B., S. Wolfart, M. Scharnberg, K. Ludwig, R. Adelung, and M. Kern. 2007. Influence of Contamination on
Zirconia Ceramic Bonding. J Dent Res., 86(8):749-753.
Yousef E. Aboush. 1998. Removing saliva contamination from
porcelain veneers before bonding. J Prosthet Dent., 80:
649-53.