Abstract—This paper investigated the application of design of experiment technique to optimized multi-panel lamination process in the flexible printed circuit production. Three significant factors affecting lamination process, which are, prebake time, lamination pressure and type of film, were identified with cause and effect matrix and failure mode and effect analysis. Full factorial design experiments were conducted. The results suggested that all factors, their two and three way interactions are significant. Optimal setting was identified with response optimizer. The optimum process setting was at 20 minute prebake time, 370 Klb. Lamination pressure and Sekisui film type. This new setting has resulted in defect reduction from 4.82% to 0.55%.
Index Terms—design of experiment, optimization, flexible printed circuit
I. INTRODUCTION
RINTED circuit board provides the electrical interconnections between microelectronic components such as semiconductor chips and capacitors mounted on the board. Printed circuit board is now considered high-technology product. Three-fourths of the world’s printed circuit boards are produced in Asia [1]. A flexible printed circuit (FPC) is an ultra-thin and flexible version of printed circuit board. It has wide range of applications, including roll-up displays, flexible solar cells and electronics paper [2]. With the ultra-thin structure and flexibility make it ideal solution for miniaturization which is an essential trend for electronic products.
A case study company is a manufacturer of FPC as a component of hard disk drive actuator located in the northern part of Thailand. FPC is a new product that has just started its manufacturing process yet the demand is exceptionally high and continues to grow rapidly. The company is experiencing high defect rate in the FPC production process. Figure 1 shows the percentage of defect for FPC product. It indicated that excessive adhesive squeeze out is a major defect type which contribute to 4.95% of the total defect.
Manuscript received July 16, 2012; revised August 14, 2012.
W. S. Laosiritaworn is with the Department of Industrial Engineering, Faculty of Engineering, Chiang Mai University, Chiang Mai, 50200 Thailand. (e-mail: [email protected]).
[image:1.595.300.571.176.272.2]P. Aoonchan was with the Department of Industrial Engineering, Faculty of Engineering, Chiang Mai University, Chiang Mai, 50200 Thailand.
Fig. 1. Percentage of defect for FPC product
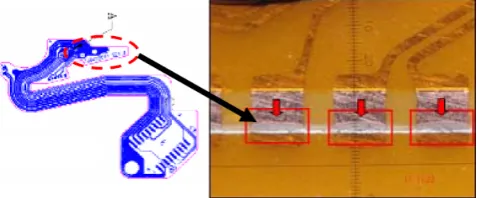
Excessive adhesive squeeze out defect (Figure 2) occurs in multi-panel lamination process. Factors affecting this process are for example prebake time, prebake temperature, pressure during lamination, temperature during lamination, type of film etc. Currently these factors are set by the experience of operator. There has been no study on the effect of the setting of these parameters on excessive adhesive squeeze out defect.
Fig. 2. FPC product and excessive adhesive squeeze out defect
Design of experiment (DoE) was first introduced by Fisher[3]. DoE is a s “process of planning the experiment so that appropriate data that can be analyzed by statistical methods will be collected, resulting in valid and objective conclusions”[4]. DoE can be used to investigate the effect of independent variables on dependent variables through structured experiment in order to maximize information gain with fewer experiments.
The use of DoE to improve electronic-parts production process has been reported. For instance Lee et al. [5] applied DoE and response surface method (RSM) to optimize the design of a small linear actuator. DoE was used to extract factors effecting design characteristic, such as output power and compactness. These design variables were optimized using RSM. Punnarungsri and Laosiritaworn [6] applied Taguchi designed of experiment to optimize hard-disk arm coil baking process. Effect of baking parameters including baking duration, baking temperature, position in the oven on coil baking defect were examined. Even though applications of DoE in industry are extensive, there has been no report of
Multi-Panel Lamination Process Optimization
with Design of Experiment
Wimalin S. Laosiritaworn and Pakorn Aoonchan
P
Handling defect, 1.62%
Inclusion, 1.03% Contamination, 0.84%
Other defect, 0.29%
Air bubble, 0.17% Alignment, 0.1%
Adhesive damage, 0.09%
[image:1.595.308.547.417.516.2]application of this technique on FPC product.
This paper investigated the effect of multi-panel lamination machines parameter setting on excessive adhesive squeeze out defect through design of experiment methodology. The objective of this research is to find optimal setting for the multi-panel lamination machine that reduce excessive adhesive squeeze out from 4.95% to less than 1 percent.
II. RESEARCH METHODOLOGY
A. Problem Identification
The preliminary data collection has identified excessive adhesive squeeze out as the major defect that contribute to 63,552 defects from the total production of 938,370 products in 5 weeks which equals to 4.95% defect rate. Excessive adhesive squeeze out defect was found in 3 processes which are; auto cover film layup, pre bake and multi-panel lamination. Therefore the three processes were investigated in detail.
Key input variables (KPIVs) and key output variable (KPOV) of the three process were examined, which results in the identification 47 factors that are related to excessive adhesive squeeze out defect. Number of factors was too many to conduct experimental design so cause and effect matrix was used to score those factors in order to identify critical factors. 12 critical factors were identified through cause and effect matrix. Number of factors was still too many so it was further refined by Failure Mode and Effect Analysis (FMEA). Finally the top 3 factors with highest risk score was selected which include prebake time, lamination pressure, and type of film.
B. Design of Experiment Setup
Full Factorial design, where all possible combinations of factor levels were investigated, was used in this research in order to study the effect of each factor as well as their interactions. As 3 factors were identified in the previous step, the 23 factorial designed was used.
C. Factor level Setting
1) Prebake time
Prebake is a preparation process for glue coated on the film to melt from solid state. Glue has to be melted to the right viscosity so that lamination process can be carried out properly. Prebake temperature is fixed at 225 °F for maximizing production capacity. As the prebake temperature is fixed and considering the type of glue used, the prebake time should be between 0 to 40 minutes. Therefore the level of this factor was set to low level at 0
minute, high level at 40 minutes and center point at 20 minutes.
2) Lamination pressure
Multi-panel lamination machine laminate workpiece at high temperature to allow permanently joint between glue, film and flexible printed circuit. Lamination temperature and time were fixed at 375 °F and 60 minutes for the capacity reason. As the setting of lamination temperature and time are fixed, appropriate lamination pressure should be between 310 to 430 kLb. As a result, this factor was set to low level at 310 kLb., High level at 430 kLb. And center point at 370 kLb.
3) Type of film
Type of film not only has an impact on the coating uniformity but also helps to prevent excessive glue from overflowing the edge of the circuit. At the moment, two type of film namely Dahlar and Sekisui were used in production so this factor was set to low level to be Dahlar and high level to be Sekisui with no center point.
Factors level setting is summarized in Table 1. The response of the experiment was excessing adhesive defect percentage.
As 23 factorial design was used with two factors at 3 levels, one factor at 2 level, 3 center point and 2 replicate, the total number of experiment was 22. Experiments were then carried out according to the design. Uncontrollable factors that could affect the experimental result were also taken into account. Therefore, all experiments were conducted using the same operator, materials from the same lot, the same machine, and the same quality inspector. Experimental results can be found in the next section
TABLEI FACTOR LEVEL SETTING
Factor Symbol
Level setting
Low (-) Center point
High (+)
Prebake time (minute) A 0 20 40
Lamination pressure(Klb) B 310 370 430
Type of film (type) C Dahlar None Sekisui
TABLEII
EXPERIMENTAL SETTING AND RESULTS
Std. Order Exp. Order Center point
A B C % defect
4 1 1 40 430 Dahlar 3.82
2 2 1 40 310 Dahlar 2.78
21 3 0 20 370 Dahlar 6.60
14 4 1 40 310 Sekisui 0.00
12 5 1 40 430 Dahlar 4.17
10 6 1 40 310 Dahlar 3.47
13 7 1 0 310 Sekisui 0.00
3 8 1 0 430 Dahlar 29.51
6 9 1 40 310 Sekisui 0.00
22 10 0 20 370 Sekisui 0.00
15 11 1 0 430 Sekisui 1.04
16 12 1 40 430 Sekisui 0.00
20 13 0 20 370 Sekisui 0.00
8 14 1 40 430 Sekisui 0.00
5 15 1 0 310 Sekisui 0.00
18 16 0 20 370 Sekisui 0.00
7 17 1 0 430 Sekisui 0.35
19 18 0 20 370 Dahlar 7.64
17 19 0 20 370 Dahlar 5.90
9 20 1 0 310 Dahlar 19.79
11 21 1 0 430 Dahlar 30.56
1 22 1 0 310 Dahlar 21.53
III. RESULTS AND DISCUSSION
Defect rate of each experimental setting is shown in Table 2. The lowest defect rate was found to be 0% for experiment number 4, 7, 9, 10, 12, 13, 14, 15 and 16. Whereas the highest defect rate was 30.56% for experiment number 21.
Minitab software was used for data analysis. Figure 3 shows normal plot of the standard effects. It can be concluded from this figure that factor A, B, C and AC interaction has significant impact on defect rate at 95% confidence.
Fig. 3. Normal plot of the standard effects.
Fig. 4. Analysis of variance
Analysis variance (ANOVA) results are shown in Figure 4. ANOVA is used to identify factors that are statistically affect response. In this case, 95% confidence was used so the factors that are statistically significant are the factors with P value lower than 0.05. Therefore A, B, C and AC interaction are significant. Figure 4 also showed R-sq value or the correlation coefficient. This number indicated how well the response is explained by input factors. In this case, R-sq value of the fitted model is 96.66% which is considered very high.
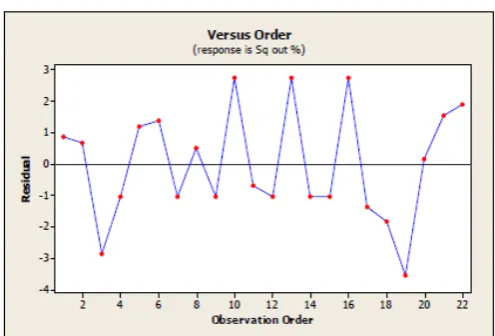
Residual analysis is used to check the validity of ANOVA assumption. The basic assumptions of ANOVA are that the observations are adequately described by the model, the errors are normally and independently distributed with mean zero and constant but unknown variance [4]. The results of residual analysis are shown in Figure 5 – Figure 7. Normal probability plot of the residuals (Figure 5.) suggested the residual has normal distribution as the plot form a straight line. Figure 6, the residual vs. fitted value plot suggested the non-constant variance of the residual, as
[image:3.595.298.552.109.629.2]the variance tends to be smaller towards the end, which violate ANOVA assumption. Figure 7 shows the plot of residual vs. observation order. It was found that residuals are independent from observation order.
[image:3.595.306.554.483.651.2]Fig. 5. Normal probability plot of residual.
Fig. 6. Residual vs. fitted value
Fig. 7. Residual vs. observation order
As the residual has non-constant variance, Box-Cox transformation [7] was applied. Box-Cox transformation can be used to reduce anomalies such as additivity, non-normality and heteroscedasticity [8].
1
t
y
Y
λ
λ
−
=
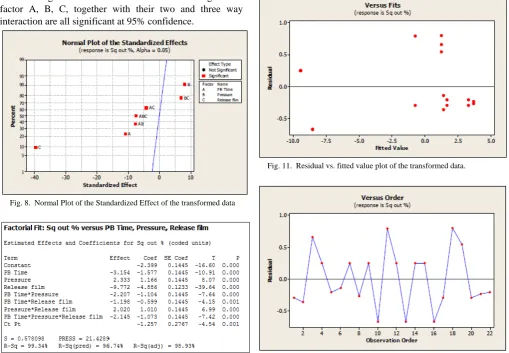
(1)shown in Figure 8. It can be concluded from this figure that factor A, B, C, together with their two and three way interaction are all significant at 95% confidence.
Fig. 8. Normal Plot of the Standardized Effect of the transformed data
Fig. 9. Analysis of variance of the transformed data
Figure 9 is the ANOVA of the transformed data. It confirmed that significant factors to defect rate are factor A, B, C and all of their two and three way interaction. R-Sq value of 99.34% is considered very high which means that response value is well explained by input factors.
[image:4.595.47.557.60.413.2]Residual analysis of the transformed data is shown in Figure. 10-12. Figure 10 indicates that the transformed data has normal distribution as the plot form a straight line. Figure 11 shows that residuals are now have equal variance. Figure 12 indicates that residuals are independent from observation order.
Fig. 10. Normal probability plot of the transformed data.
Fig. 11. Residual vs. fitted value plot of the transformed data.
Fig. 12. Residual vs. fitted value plot of the transformed data.
After data transformation the model is good and residual has normal distribution and equal variance, hence the model can be used to fit regression equation. As all factors, their two and three way interaction are all significant, regression equation has to be constructed with all these terms. The equation to predict defect rate is as follow;
Yt=-14.8198 + 0.261433A+ 0.0378331B-
17.1292C - 9.19704E-04AB + 0.300767AC + 0.0347089BC - 8.93846E-04ABC - 1.25726
(2)
[image:4.595.48.295.576.740.2]
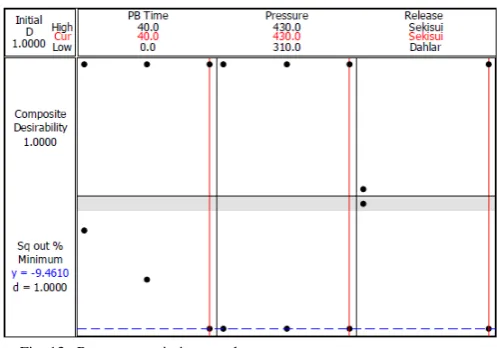
Fig. 13. Response optimizer result
[image:5.595.48.297.330.494.2]However setting prebake time to 40 minute and lamination pressure at 430 Klb has the risk of producing air bubble defect. Therefore response analyzer was carried out again (Figure 14), this time optimum setting was found at prebake time 20 minute, lamination pressure 370 Klb with Sekisui film. The predicted Y was -0.85420 which converted to 1.087% defect rate which is acceptable.
Fig. 14. Response optimizer result with consideration of air bubble defect.
Optimum setting identified from response optimizer was tested in the actual production to prove if defect rate actually gone down. Data from 9 weeks were collected and summarized in Table 3.
Table 3 is a weekly production report. Before improvement, defect rate was at 4.82% average. After improvement, defect rate was significantly reduced to the average of 0.55%. As a result, the objective of this research is met. This defect reduction results in the reduction of defect cost of approximately 404,247 Baht.
IV. CONCLUSION
This research applied design of experiment technique to reduce excessive adhesive squeeze out defect by improving multi-panel lamination process setting. Cause of excessive adhesive squeezed out from 3 processes; auto cover film layup, pre bake and multi-panel lamination were examined. 47 key factors were identified. Through the use of cause and effect matrix and failure mode and effect analysis, 3 critical factors were selected for design of experiment implementation.
Full factorial design was used, which resulted in 22 experiments. Box-Cox data transformation was implemented with raw data as residual have unequal variance. All three factors and their two and three way interactions are found to be significant. Finally, optimized process setting identified by response optimizer was 20 minute prebake time, 370 Klb lamination pressure and Sekisui film type. This new setting results in the reduction of defect from 4.82% to 0.55%.
This research even though has met its objective, yet further improvement could be made. For instance, the impact of type of FPC, glue and film on excessive adhesive squeeze out defect should be studied. In order to launch new production process, these factors should be studied beforehand to prevent defect from occurring rather than finding the way to improve the process after the damage has already been done.
REFERENCES
[1] J. LaDou, “Prited circuit board industry” International Journal of Hygiene and Environmental Health, vol. 209, pp. 211-219, 2006. [2] B.I. Noh, J.W. Yoon, and S.B. Jung, “Fabrication and adhesion
strength of Cu/Ni-Cr/polyimide films for flexible printed circuits”
Microelectronic Engineering, vol. 88, pp.1024-1027, June. 2011. [3] R.A., Fisher, The Design of Expriments. Edinburgh: Oliver & Boyd,
1935.
[4] D.C. Montgomery, Design and Analysis of Experiments. New York: John Wiley & Sons, 2005.
[5] D.J. Lee, K.S. Wo, N.C. Park, and Y.P. Park. “Design and optimization of a linear actuator for subminiature optical storage device” IEEE Transctions of Magnatics, vol. 41, no. 2, pp.1055-1057, Feb. 2005.
[6] P.Punnarungsri and W. Laosiritaworn, “Coil baking parameters Optimization Using Taguchi methodology (Publised Conference Proceeding Style),” in Prc. 4th International Data Storage Technology Conference, Bangkok, 2011, pp. 284-289.
[7] G.E.P. Box and D. R. Cox, “An analysis of transformation” Journal of the Royal Statistical Society. Series B (Methodological), vol. 26, no. 2, pp. 211-252, 1964
[8] R.M. Sakia, “The Box-Cox transformation technique: a review” The Statistician, vol. 41, pp. 169-178, 1992
TABLEIII
ACTUAL DEFECT RATE BEFORE AND AFTER IMPROVEMENT Before/After
Improvement Week
Number of defect
Number of
production %defect
Before improvement
1 14,274 148,528 9.61 2 5,668 169,681 3.34 3 1,821 143,374 1.27 4 6,000 210,522 2.85 5 18,666 266,265 7.01
Before improvement average 4.82
After improvement
6 900 134,272 0.67 7 1,477 220,365 0.67 8 1,718 399,479 0.43
9 1,654 375,813 0.44