Corporate Visual Identity (CVI) on Social Media:
Exploring the Effects of Consistent CVI
Corporate Visual Identity (CVI) on Social Media:
Exploring the Effects of Consistent CVI
Ivo Krake (s1017756)
8
thof August 2014
Graduation article for the Master’s Degree Communication Studies,
University of Twente, Enschede
Abstract
Purpose -The purpose of this research article is providing insights into the role of consistency in CVI on social media platforms for academic literature and practitioners. The objectives of this article are identifying the current
use of consistency in CVI on social media platforms of organizations in the Netherlands and exploring the
effects of consistent CVI on social media users.
Design/methodology/approach - Study 1 uses a quantitative content analysis to measure the actual use of consistency in CVI on social media platforms of fifty top social media organizations in the Netherlands. A
coding scheme was developed for looking into the elements of CVI (e.g. logo, text, color, form elements and
photography) in the avatar and header of Facebook, Twitter, and LinkedIn.
Study 2 uses a 3 x 2 between subjects design to measure the effects of CVI (consistent, channel specific, and
inconsistent) and the Organization type (Electronics Company and Bank) on social media users’ appreciation of
the CVI, appreciation of the organization, brand awareness, and intention to commit to an organization on social
media. An online questionnaire was used to gather data for this experiment.
Findings - Results in Study 1 indicate that traditional elements of CVI are also applied on social media platforms, however there is a larger role for photography reserved in the header. This study found conclusive
evidence that organizations are currently implementing their CVI inconsistently on different social media
platforms. Results of experiment show that there were non-significant main effects of consistent CVI on all the
dependent variables. However, significant main effects of the Organization type were found and several
significant interactions were found on several sub constructs of the users’ appreciation of the CVI; appreciation
of the organization; and intention to commit to the organization on social media.
Research limitations - The methods that are used provide an insight of the actual use of CVI on three social media platforms by organizations in the Netherlands. Results in other countries, at another time, and on other
social media platforms may vary. The experimental design in this study used fictional organizations and
measured intentions; a study on existing organizations and actual behavior may provide different results.
Practical implications - This study provides information about the actual use and effects of consistent CVI on social media platforms. Online marketing, social media practitioners, and graphic designers could benefit from
this research by using its practical implications for strategically positioning a corporate brand in a social media
context.
Originality/value – The originality of this study lies in linking actual use of consistency in CVI and its possible effects on people in a social media environment. This study addresses to the relatively little research that has
been done on CVI and social media.
CVI on Social Media 4
Introduction
In the today’s modern environment, we are overwhelmed with visual cues; as a result our Western society is
becoming more and more visually oriented. All of these visual impressions compete for the attention of
organization’s stakeholders, together with other information it results in perceptions of an organization or brand.
Visual impressions are based on logos, colors, typography, graphics and photography and sometimes additional
symbols. These elements are often presented in buildings and stores, packaging, mailings, television and all kind
of printed and online media (Van den Bosch, 2005).
The use of visual cues has an effect on the way organizations are perceived and they help us to recognize and
choose between products or brands (D’Souza, 2000; Doyle & Bottomley, 2002). In addition, consumers are
becoming increasingly interested in the organization behind the brand (Blumenthal & Bergstrom, 2003; Sever,
2003). According to Van den Bosch (2005) the objective of a corporate visual identity (CVI) could be first, to
announce the existence of the organization, and second, to create and support a corporate identity.
Organizations are increasingly recognizing they can promote their organization, brands and products to project
a single and powerful identity. This view of communication involves more than advertising and marketing
domains. It also involves corporate identity, visual identity and visual identification systems that are used to
position organizations (Balmer, 1995).
The social media revolution of the last decade has changed the communication landscape and has influenced
our communications tremendously. The growing importance of applications such as Facebook, Twitter and
others in peoples’ lives has influenced the communication habits in our daily lives. In relation to marketing
communication, this means that brand related communications and exposure to marketing campaigns are
increasingly shifted from traditional media to social media. People are changed from passive listeners to active
influencers (Kozinets, Hemetsberger, & Schau, 2008) and thereby, some power over brands shifted directly to
consumers (Constantinides & Fountain, 2008). In addition, people rely more than ever on their social networks
when making decisions (Hinz, Skiera, Barrot & Becker, 2011). The relatively new marketing communications
through social media presents new challenges and opportunities for organizations.
Balmer and Soenen (1997) highlighted that there is a shortage of empirical studies on CVI. This shortage in
empirical studies on CVI still persists today, and specifically empirical studies that explore the effects of CVI in
a digital environment, such as websites (Van den Bosch, 2005). Since academic research on branding in social
media is also relatively scarce, there is an important need in literature to explore the effects of corporate branding
in social media. In taking the perspective of visual branding on social media platforms this article’s goal is to
explore the role of consistency in CVI across different social media platforms. First, a content analysis of fifty
top social media organization in the Netherlands is conducted to map the use of consistent CVI on social media.
Second, an experiment is executed to measure the effects of consistent CVI on social media users. All in all, the
combination of the two studies will provide practitioners and academic literature a comprehensive picture of the
CVI on Social Media 5
Literature Review
Corporate Visual Identity (CVI) is the English equivalent of the Dutch term “huisstijl” (Van den Bosch, de Jong
& Elving. 2004). Since, most academic literature is written on CVI, this designation will be used in this article.
CVI is increasingly getting more attention among communication professionals; however, in academic literature
on corporate communication and public relations little research has been done. Thus, most literature has been
written by practitioners. In current academic research, CVI is often served as a more or less obvious tool that
may help to contribute to an organization’s strategy. The issues of designing, managing and the impact of an
effective CVI are rarely been studied (Van den Bosch, 2005).
CVI
CVI is an underlying construct of the more comprehensive corporate identity. Birkigt and Stadler (1986) and
Van Riel (1995) bring forward three factors that influence corporate identity, namely behavior, communication
and symbolism. CVI is characterized as the main representative of symbolism. A possible explanation for the
relatively small amount of studies on CVI as a research topic may lie in in the distinction between the strategic
and the visual school of corporate identity (Hatch & Schultz, 2000; Van den Bosch, 2004). The strategic school
is formed by the (overlapping) disciplines of corporate communication, public relations and reputation
management; the visual school on the other hand consists of graphic design disciplines. It may be difficult for the
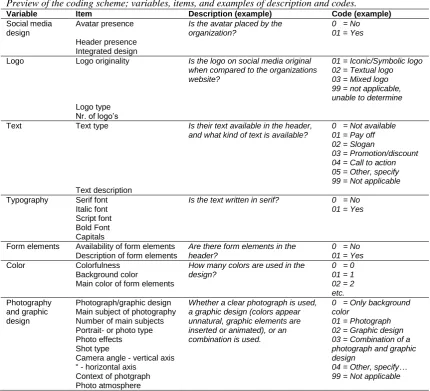
two schools to collaborate. According to Van den Bosch et al. (2004), the research area of CVI can be divided
into three levels: the strategic, the operational, and the design level (see Fig. 1).
Figure 1. Levels of CVI research. Reprinted from: Bosch, van den, A. L. M., Jong, de, M. D. T., & Elving, W. J. L. (2004). Managing corporate visual identity: use and effects of organizational measures
to support a consistent self-presentation. Public Relations Review 30(2), 225-234.
The strategic level focuses on the organization’s objectives of their visual identity. More specifically in
corporate branding, the way they present themselves and distinguish from competitors. Important academic
research in this level has been done to determine the choice between a standardized and a localized corporate
visual identity for global organizations (Melewar & Saunders, 1998, 1999; Melewar, Saunders & Balmer, 2000).
The operational level focuses on the development and management of CVI, often regulated in corporate visual
identity systems (CVIS) (Van den Bosch, 2004). Organizations are challenged to transform corporate identity in
[image:5.595.114.386.446.549.2]CVI on Social Media 6
consist of changes and adjustments and still preserving consistency in CVI and manageable CVIS.
The design level focuses on the functionality and effectiveness of specific CVI elements. Prior academic
research mainly focused on logos (Green & Loveluck, 1994; Haase & Theios, 1996; Henderson & Cote, 1998;
Van Riel & Van den Ban, 2001), color (Madden, Hewett & Roth, 2000) or slogans (Dowling & Kabanoff, 1996).
According to Van den Bosch et al. (2004), every level has its methodological component as well. On the
strategic level, a variety of methods has been developed to research the corporate identity of organizations (Van
Rekom, 1998; Van Rekom & Van Riel, 2000; Van Riel & Balmer, 1997). On the operational level, several
methods have been developed for exploring the visual identity of organizations (Melewar, 2001). Furthermore,
the design level focuses mostly on the pretesting of visual designs (Gabrielsen, Kristensen & Hansen, 2000). The
operational level seems to be most unexplored in prior academic research on corporate visual identity. Most
studies focus on the management of CVI and CVI systems. For example, Melewar & Saunders (1998)
investigated the CVI of multinational organizations and the standardizations of CVI and found positive effects of
standardization in projecting the organizations visual identity. Melewar et al. (2000) researched the relationship
between corporate branding strategy and the degree of standardization of name, logo, typography, color and
slogan. These studies mainly focused on the relationship between the strategic and operational level of CVI.
However, the processes and management concerns of designing and maintaining a consistent CVI in a digital
environment haven’t been studied at all.
CVI elements. Dowling (1994) put forward that a visual identity includes four elements, identified
as corporate name, logos and symbols, color, and typeface. Furthermore, Dowling (1994) also mentioned that
visual identity is important, although “it is not nearly as important as what your organization does, the products and services it offers, or what and how it communicates with stakeholders”. Melewar and Saunders (1998)
addressed CVI as the focus of the organizations identity and image, with the name, logotype, typography, color
and slogan being the five elements.
The logo has been found to be a key element of CVI for representing the organization to internal- and external
stakeholders (Byrom & Lehman, 2007). Logos help organizations to be identified by consumers and distinguish
them from other competitors (Hem & Iversen, 2004). Furthermore, the logo has the potential to express
organizational characteristics (Van Riel & Van den Ban, 2001). Henderson and Cote (1998) bring forward that
there is a lack of research in the design effects on consumers’ appreciation of logos. There are many types of
logos, varying from very abstract logos, unrelated to word marks, which are written in a distinct form (Murphy,
1990). A good logo should be recognizable, held meaning and evoke positive affect for organization’s
stakeholders (Vartorella, 1990). According to Adir, Adir and Pascau (2012), the logo type can be classified into
three main types, namely the iconic/symbolic logo, textual logo, and a mixed logo.
Color is an attribute to the visual experience of CVI (Gage, 1999). Hines and Bruce (2007) suggest that
customers respond firstly to the color, since it includes strong cultural associations and because color often
covers most of the surface. Berlin and Kay (1969) found 11 colors that could be perceptually marked and are
divided in chromatic (red, yellow, green, blue, pink, orange, brown, and purple) and achromatic colors (black,
CVI on Social Media 7
Typography or fonts are often divided into two categories serif fonts and sans serif fonts. Furthermore,
different text styles such as a bold or italic font are used in typography. To ad power to the message it is
sometimes written in capitals. Most literature on typography focuses on readability of fonts, however Childers
and Jass (2002) found that the impressions of the font are also used to form impressions about the brand.
Van den Bosch (2005) widens Dowling’s (1994), and Melewar and Saunders (1998) identification of the
elements of CVI and suggests that, in general, CVI may include a logo, color palette, typefaces (fonts), layout,
photography and illustrations, advertising styles and even signs and symbols. Rowley (2004) suggests that
building a corporate identity starts with sharing brand values which are communicated through a number of
elements on websites, being the logo, graphics, text, color, and shapes. When relating these elements to a social
media environment, we could assume that these elements also apply on social media platforms and are therefore
relevant for this article.
CVI and Identity, Image and Reputation. Corporate branding and communication are
often seen as activities to build a corporate reputation (Bickerton, 2000; Schultz, Hatch and Larsen, 2000;
Einwiller and Will, 2002). The most basic function of visual identity is to direct the consumer to the source of
origin of goods and services. However, the visual identity services a higher purpose, it helps organizations to
maintain and strengthen customer relations by contributing to the formation of associations that will produce a
positive image and reputation of the organization (Allessandri, 2013). Consumers can choose products and
services from among many brands and organizations. Therefore the reputation of an organization is found to be a
key factor in creating a competitive advantage (Kapferer, 1994; Kay, 1993).
Over the last decade, the concept of corporate reputation has been widely discussed in academic studies
(Markwick and Fill, 1997; Greyser, 1999; Dowling, 2002). Organization’s behavior is found to be the strongest
influence on reputation and defined as “the way an organization acts, as perceived by its stakeholders” (Dutton
and Dukerich, 1991; Hatch and Schultz, 1997, 2003). However, little research addresses the role of CVI in
identity, image, and reputation of organizations. Specifically, in a digital environment such as social media,
where organizations are also trying to build relationships with their customers. Van den Bosch (2005) addresses
that further studies on identity, image and reputation could explore the relationship between CVI and the
impression of organizations across applications such as websites. This article will focus on CVI and the
impression of organizations on social media platforms.
Social media
There are different definitions for social media, but most researchers rely on Kaplan and Haenlein (2010, p. 61),
who define social media as: “a group of internet based applications that builds on the ideological and
technological foundations of Web 2.0, and it allows the creation and exchange of user-generated content.”
Facebook alone, the largest social media platform, has over 802 million daily active users and 1.28 billion
monthly active users as of March 31, 2014 (Facebook, 2014). Furthermore, the development micro-blogs such as
Twitter, made sure that more than 145 million Twitter-users send an average of 90 million ‘tweets’ per day
CVI on Social Media 8
There is an ongoing debate over the issue of branding in social media. Several practitioners and researchers
enthusiastically encourage organizations to be present on social media and take advantage of it to survive
(Kaplan & Haenlein, 2010). On the other hand, a number of researchers call organizations “uninvited crashers”
of social media, inferring that social media are for people and not for brands (Fournier & Avery, 2011, p. 193).
There are literally hundreds of different social media platforms such as social networking sites, text messaging,
photo sharing, (micro) blogs, wiki’s and discussion forums (Harris, 2009). Each social media platform has its
own characteristics and several of them are widely adopted in our society. This article will focus on the ‘Big
Five’ social media platforms in the Netherlands, identified by Newcom Research & Consultancy (2014). The “Big Five” social media platforms are listed on the basis of amount of users. In 2013, about 7.9 million
people used Facebook; 7.1 million people used YouTube; the business social network LinkedIn was used by 4
million people; 3.3 million people were active on Twitter; and approximately 2 million people used Google+. In
addition, the same research showed that 65% of all social media users are committed to an organization’s page
on social media (Newcom Research & Consultancy, 2014).
Social media use by organizations. Baird & Paranis (2011) found that nearly 70% of
executives address that if they do not engage in social media, their organization will get out of touch. Pondres
(2011) studied social media use by organizations in the Netherlands and found that many organizations don’t
invest in social media because of a lack of knowledge. Nonetheless, half of the organizations that do use social
media developed a social media strategy to effectively use social media. In addition, Pondres (2013) performed
another study on the social media use of organizations; this study highlighted the most commonly used social
media platforms by organizations, as presented in Figure 2. Pondres’ (2013) findings indicate that Facebook
(87%), Twitter (78%), and LinkedIn (75%) are most often used by organizations in the Netherlands.
According to Baird & Parasnis (2011), organizations use these social media platforms for a diversity of
reasons, for example: to communicate with customers (74%); for customer service (65%); and for promotions
(60%). Overall, customer engagement is found to be the main reason for organizations to use social media.
(Lorenzo-Romero et al., 2012).
[image:8.595.114.446.570.709.2]
CVI on Social Media 9
Large retailers were found to use social media as a tool for brand building and small retailers use social media
mostly for customer service. According to Social Media Monitor (2013), branding is the most important reason
for major brands and organizations to implement and use social media, followed by communication and public
relations.
Brand awareness on social media. Two of the main purposes in branding are the labeling a
product or organization by a brand name through marketing means and making consumers aware of the brand.
The created brand awareness is defined as “the strength of the resulting brand node or trace in memory, as
reflected by consumers and the ability to identify the brand under different conditions” (Keller, 2008, p. 87). In
other words brand awareness refers to the strength of a brand in consumers’ minds. Brand awareness could be
created by anything that causes the consumer to experience the brand, such as: advertising, promotion, publicity,
public relations, etc. Social media represents a way to expose users to the brand or organization and thereby
create brand awareness. Prior literature suggests that brand awareness exists of two components, being
recognition and recall (Keller, 1993). This article will adopt concept of brand awareness and apply it in a social
media environment.
Social media brand page communities. Muniz and O’Guinn (2001, p. 412) define brand
community as “a specialized, non-geographically bound community, based on a structured set of social relations among admirers of a brand.” The context of such a community is lies in consumption of a good or service. Brand
communities are dynamic phenomena with dynamic effects and interactions among their elements
(McAlexander et al., 2002; Schau et al., 2009).
According to prior social media and brand community literature, people have their own motivations to join
social media and a brand communities. One important psychological need to join social media is to feel socially
connected (Sarason, 1974). Shopping, researching and entertainment are other purposes to join and contribute to
social media (Zhou, Chenting & Zhou, 2011). People also join brand communities to fulfill their need to be
identified with groups they wish to associate with (Schembri, Merrilees, & Kristiansen, 2010).
Benefits of brand communities are facilitating information sharing, capturing the history and culture of a
brand, offer customer service, and positively influencing brand loyalty (Muniz & O’Guinn, 2001). In addition,
Dholakia and Durham (2010) showed in their study that brand community fans generate more positive
word-of-mouth (WOM); are more emotionally attached; and tend to visit the store more often. Altogether, organizations
mainly use social media to engage with customers or for community management (Baird & Parasnis, 2011;
Lorenzo-Romero et al., 2012; Social Media Monitor, 2013).
Despite the importance of online branding and the high adoption rate of social media, very few specific academic studies (Hsu & Tsou, 2011) have been done in this research area. Prior academic research on
marketing and branding in social media mainly focuses on the descriptives and characteristics of social media
(Edelman, 2010; Hanna, Rohm & Crittenden, 2011; Kaplan & Haenlein, 2010). So there is important need for
CVI on Social Media 10
Consistency
Visual appearance has been found to have a major effect on how users appreciate websites (Van der Geest &
Loorbach, 2005). Research on visual consistency has revealed that color and grid/navigation were key factors
used to create consistency on websites (Van der Geest & Loorbach, 2005). The literature about evaluating
consistency in websites, suggests two approaches: expert-focused and user-focused. Most research on
consistency in websites used expert-focused approaches. In this article an user-focused approach will be used to
look into the effects of consistent CVI on social media platforms.
Organizations might also recognize the need to project a consistent identity that reaches consumers in a memorable way. Therefore CVI management is needed to ensure this consistency (Van den Bosch et al., 2004).
The realization of the importance of consistency in visuals and marketing communications by marketing and
graphic design practitioners led to academic research in this area. Several researchers confirm there should be
consistency in formal corporate communication (Bernstein, 1986; Schultz, Hatch, & Larsen, 2000).
With any branding effort, consistency over a long time period results in cumulative benefit to the
organizations. Consistent brands are likely to gain enhanced impact and visibility (Aaker, 1996). In addition,
consistent and heavy advertising can change an organizations’ image. Although change is sometimes necessary,
the goal of consistency of meaning and messages through time is to provide a position, identity, and cost
efficiencies, all of them to result in a competitive advantage (Aaker, 1996).
Integrated marketing communication (IMC) literature is increasingly concerned with consistency (De
Chernatony, Cottam, & Segal-Horn, 2006). According to several researches consistency also needs to extend to
all IMC (Duncan & Moriaty, 1997; Kendall, 1999). Social media are a part of IMC, thus we could assume that
consistency on social media platforms is desirable. While to majority of prior ICM literature focuses on the
internally managed aspects of consistency, Chernatony and Segal-Horn (2003) addresses that successful service
organizations gain consistent perceptions among consumers. In addition, Kapfererer (1997) addresses that
successful organizations succeed in consistency across all stakeholders, not only consumers. Stuart and Jones
(2004) put forward that due the nature of the Internet, there is a particular thread to the consistency of corporate
brands.
Van den Bosch (2005, p. 82) defined consistency in CVI as “the extent to which the various CVI elements were
actually employed as intended.” However, this study will focus on consistency in CVI on different social media
platforms, and therefore consistency in CVI on social media will be defined as: “the extent to which the various
CVI elements conform across different social media platforms.”
Every social media platform has its own characteristics and possibilities to display an organization’s visual
identity. Since, prior academic literature addresses beneficial effects of consistency in CVI, this study will focus
on consistent CVI on social media platforms. Thereby, two questions will form the basis in the addressing of this
article:
CVI on Social Media 11
Studies
In this research article two studies are reported, in the first study a content analysis is conducted to examine the
actual use of consistency in CVI on social media platforms by top social media organizations in the Netherlands.
In the second study an experiment was designed to measure the effects of consistent CVI on social media users.
Study 1
Elaborating on the findings as discussed in the literature review, the following research question will form the
basis of study 1: Are organizations applying a consistent CVI on social media platforms?’
Method
This study used a quantitative content analysis (QCA), defined by Nuendorf (2002) as: “a summarizing,
quantitative analysis of messages (or other objects) that relies on a scientific method and is not limited to the
types of variables that may be measured or the context in which the messages are created or presented.” The
content analysis in this study especially focused on the avatar and header on the social media platforms, since
these are commonly used to present CVI. Other visual elements, such as posts and messages were not included
in this study. For example, the avatar and header on Facebook are marked in red and presented in Figure 3.
Figure 3. Avatar and header on the social media platform Facebook.
Pre-research. Prior to this study, several pre-researches were conducted. First, a list of top social media organizations in the Netherlands was gathered from the Social Media Monitor 6. This annual list is established
by a reputable social media research organization in the Netherlands, known as ‘Social Embassy’ (Social Media
Monitor, 2013). Second, these organizations were examined by looking into the use of the “Big Five”social
media platforms that commonly used social media platforms by organizations as suggested by Pondres (2013).
In order to determine a conclusive list, the top three social media platforms that were used by these organizations
were used in this study. The pre-research resulted in a list of fifty organizations who were using the three social
CVI on Social Media 12
Another pre-research was performed discuss the role of the elements of CVI and the role of consistency on
social media platforms. Eight expert-interviews were conducted to obtain insights and discuss a first version of
the coding scheme. The insights gathered in these expert-interviews were used for adjustments of the coding
scheme to particularly fit a social media context.
Coding scheme. Prior academic literature was used to develop a comprehensive set of variables,
focusing on logo, text, typography, form elements, color, and photography. Logo items were adopted from Adîr,
Adîr and Pascu (2012). Berlin and Kay (1969) suggested 11 colors which were also adopted in this study.
Photography items were adopted from Kane (1999) who studied photography in the avatar on Myspace and
adjusted to fit the purpose of this study. The remainder of the variables and items were self-created. Table 1
presents a preview of the variables and items that have been used in the coding scheme, it also gives an example
of the description and codes for the first item of each first variable. The final coding scheme is presented in
[image:12.595.100.531.325.716.2]Appendix A.
Table 1.
Preview of the coding scheme; variables, items, and examples of description and codes.
Variable Item Description (example) Code (example)
Social media design
Avatar presence
Header presence Integrated design
Is the avatar placed by the organization?
0 = No 01 = Yes
Logo Logo originality
Logo type Nr. of logo’s
Is the logo on social media original when compared to the organizations website?
01 = Iconic/Symbolic logo 02 = Textual logo 03 = Mixed logo 99 = not applicable, unable to determine
Text Text type
Text description
Is their text available in the header, and what kind of text is available?
0 = Not available 01 = Pay off 02 = Slogan
03 = Promotion/discount 04 = Call to action 05 = Other, specify 99 = Not applicable
Typography Serif font Italic font Script font Bold Font Capitals
Is the text written in serif? 0 = No 01 = Yes
Form elements Availability of form elements Description of form elements
Are there form elements in the header?
0 = No 01 = Yes
Color Colorfulness
Background color
Main color of form elements
How many colors are used in the design?
0 = 0 01 = 1 02 = 2 etc. Photography
and graphic design
Photograph/graphic design Main subject of photography Number of main subjects Portrait- or photo type Photo effects Shot type
Camera angle - vertical axis “ - horizontal axis
Context of photgraph Photo atmosphere
Whether a clear photograph is used, a graphic design (colors appear unnatural, graphic elements are inserted or animated), or an combination is used.
0 = Only background color
01 = Photograph 02 = Graphic design 03 = Combination of a photograph and graphic design
CVI on Social Media 13
Corpus. Eventually, fifty organizations (see Appendix B) were included in the content analysis in this study. To form the corpus of this content analysis, screenshots were taken from the organizations’ social media
pages on Facebook, Twitter, and LinkedIn. Additionally, the screenshots were taken at once, on the 20th of
February 2014. The total corpus of this content analysis consisted of 150 screenshots.
Results
Data were analyzed by using SPSS 20 software. General results show that every organizations placed a logo or
image in the avatar on Facebook, Twitter and LinkedIn. However, nearly 30% of the organizations did not place
anything in their header on Twitter (n =16) and LinkedIn (n = 14). The organizations that did not place something in the header were only analyzed for the avatar and excluded from further analyses. A small amount
of organizations integrated their avatar and header into one design, specifically, 7% of the organizations used an
integrated design on Facebook and Twitter; and 0% on LinkedIn. There was a significant difference between the
integration of the avatar and header on Facebook, Twitter and LinkedIn, χ2 = (2, n=120) = 6,527, p = .038. Thus, the integration of avatar and header was significantly higher on Facebook and Twitter.
Avatar. Various variables were used o explore the avatar, consisting of logo originality, logo type and background color. To confirm logo originality, logos on the social media pages were compared to the logo of the
[image:13.595.100.525.499.632.2]organization’s website. Most organizations used their original logo, especially on LinkedIn (n = 42; 84%). Nearly half of the organizations used a bastardization of their original logo on Facebook (n = 22) and Twitter (n = 25). Looking into logo type, more than half of the organizations used a mixed logo on either Facebook (n = 32), Twitter (n = 29), and LinkedIn (n = 42). An overview of the frequencies of avatar related variables is presented in Table 2.
Table 2.
Logo originality and logo type on Facebook, Twitter, and LinkedIn.
Facebook Twitter LinkedIn
Variable Items N (%) N (%) N (%)
Logo originality Original logo Bastardization in color Bastardization (only) symbol Bastardization (only) brand name
Photographed logo (on product, building etc) Specific part or letter
Person (photographed) 28 4 7 1 2 5 3 56% 8% 14% 2% 4% 10% 6% 25 4 8 1 5 5 2 50% 8% 16% 2% 10% 10% 4% 42 3 1 2 2 0 0 84% 6% 2% 4% 4% 0% 0% Logo type Iconic/symbolic logo
Textual logo Mixed logo
Not applicable, unable to determine
10 7 32 1 20% 14% 64% 2% 12 8 29 1 24% 16% 58% 2% 2 6 42 0 4% 12% 84% 0%
Total 50 100% 50 100% 50 100%
Results on the background color of the avatar show that most organizations use a white background color on
CVI on Social Media 14
Table 3.
Background color of the avatar on Facebook, Twitter, and LinkedIn.
Facebook Twitter LinkedIn
Variable Items N (%) N (%) N (%)
Background color Red Blue Yellow Green Pink Orange Purple Black White Other color
Unable to determine (multicolor) Unable to determine (photograph)
3 2 2 3 1 4 1 3 25 1 1 4 6% 4% 4% 4% 2% 2% 4% 4% 50% 1% 2% 8% 2 1 1 2 2 4 1 4 27 1 1 4 4% 2% 2% 4% 4% 8% 2% 8% 54% 2% 2% 8% 3 1 0 0 0 1 1 2 41 0 1 0 6% 2% 0% 0% 0% 2% 2% 2% 82% 0% 2% 0%
Total 50 100% 34 100% 36 100%
Header
The header offers an organization more opportunities for applying their CVI. The header was analyzed for: the
logo, text, color, form elements, and photography/graphic design.
Logo. Looking at the number of logos in the header, it appears that most organizations do not present their logo in the header on Facebook (n = 36, Twitter (n = 14), and LinkedIn (n = 19).See Table 4, for an overview of all the logo related frequencies.
Table 4.
Number of logos, logo originality, and logo type in the header on Facebook, Twitter, and LinkedIn. Facebook Twitter LinkedIn
Variable Items N (%) N (%) N (%)
Number of logos 1 2
No logo available
13 1 36 26% 26% 72% 4 2 28 11,8% 5,9% 82,4% 15 2 19 41,7% 5,6% 52,6% Logo originality
header
Original logo Bastardization in color Bastardization (only) symbol Bastardization (only) brand name
Photographed logo (on product, building etc.) Specific part or letter
No logo available
6 2 2 1 3 0 36 12,0% 4,0% 4,0% 2,0% 6,0% 0% 72% 2 0 1 0 3 0 28 5,9% 0% 2,9% 0% 8,8% 0% 82,4% 7 2 1 0 6 1 19 19,4% 5,6% 2,8% 0% 16,7% 2,8% 52,8% Logo type Iconic/symbolic logo
Textual logo Mixed logo No logo available
2 2 10 36 4% 4% 20% 72% 3 2 2 28 8,8% 4% 5,9% 82,4% 1 2 14 19 2,8% 5,6% 36,1% 52,8%
Total 50 100% 34 100% 36 100%
Text. Results in this study show that most organizations do not apply text in their header on either Facebook (n = 19; 38%), Twitter (n = 24; 70,6%), and LinkedIn (n = 26, 72,2%). However, organizations that do use text in their header often apply it on Facebook and most of them use a payoff (n = 11; 22%) or slogan (n = 8; 16%). More specific variables on the use of text show that most organizations use a bold font (n = 22; 44%) on Facebook. In addition, text is also often written in capitals (n = 15; 30%) on Facebook.
Furthermore, results on font color indicate that most organizations use white as their font color on either
[image:14.595.93.527.419.581.2]CVI on Social Media 15
Table 5.
Text type, font type and font color on Facebook, Twitter, and LinkedIn.
Facebook Twitter LinkedIn
Variable Items N (%) N (%) N (%)
Text type Pay off Slogan Promotion Call to action Other
No text available
11 8 7 3 2 19 22% 16% 14% 6% 4% 38% 1 3 3 3 0 24 2,9% 8,8% 8,8% 8,8% 0% 70,6% 1 6 3 0 0 26 2,8% 16,7% 8,3% 0% 0% 72,2% Italic font Non italic
Italic
No text available
31 0 19 62% 0% 38% 10 0 24 29,4% 0% 70,6% 10 0 26 27,8% 0% 72,2% Serif font Sans serif (no)
Serif font (yes) No text available
26 5 19 52% 10% 38% 6 4 24 17,6% 11,8% 70,6% 10 0 26 27,8% 0% 72,2% Script font Non-script
Script
No text available
31 0 19 62% 0% 38% 10 0 24 29,4% 0% 70,6% 10 0 26 27,8% 0% 72,2% Bold font No bold font
Bold font No text available
9 22 19 18% 44% 38% 6 4 24 17,6% 11,8% 70.6% 6 4 26 16,7% 11,1% 72,2% Capitals in font Not in capitals
Text is in capitals No text available
16 15 19 32% 30% 38% 8 2 24 23,5% 5,9% 70,6% 8 2 26 22,2% 5,6% 72,2% Font color Blue
Green Orange Black Gray White
No text available
2 1 3 5 1 19 19 4% 2% 6% 10% 2% 38% 38% 0 0 1 1 1 7 24 0% 0% 2,9% 2,9% 2% 20,6% 70,6% 4 1 1 0 0 4 26 11,1% 2,8% 2,8% 0% 0% 11,1% 72,2%
Total 50 100% 34 100% 36 100%
Color and form elements. Looking into color and form elements, results indicate that most
organizations used only a photograph in their header. However, several organization used additional colors in
their CVI on Facebook (n = 14), Twitter (n = 10), and LinkedIn (n = 6). Some organizations used additional forms or elements in their header design on Facebook (n = 14; 28%), Twitter (n = 5; 14.7%), and LinkedIn (n = 7; 19.5%). More specifically, it is notable that often textboxes are used in the header on LinkedIn (n = 5; 13.9%).
Photography and graphic design. Results on photography and graphic design show that most
organizations use only a photograph in the header (Facebook, n = 28; Twitter, n = 21; LinkedIn, n = 26). Results on the subject of the photography indicate that most organizations use their product or the customer as
the subject of the photography.
Furthermore, most organizations use a single portrait of the main subject, although, a group portrait is also
often used on Facebook (n = 18, 36%). In about half of the cases on Facebook, Twitter, and LinkedIn there is only one subject. Looking into the photo effects, results indicate that a color photograph is mostly used
(Facebook, n = 31; Twitter, n = 18; LinkedIn, n = 22).
Results on shot type put forward that a medium shot is mostly used on Facebook (n = 19) and Twitter (n = 10). However, a close up and a long shot of subject are also often used by organizations (see Table 6).
In more than half of the cases a straight camera angle on both the horizontal or vertical axis is used in the
CVI on Social Media 16
straight camera angle on the vertical axis on Twitter (n =18) andapproximately 70% on Facebook (n = 35) and LinkedIn (n = 25).
Results on the context of the photography show that most of the time the photograph on Facebook(
n = 15) andTwitter (n = 8) is taken in front of a neutral/colored background. However, the context of the photograph on LinkedIn suggest that nearly 60% of was taken in a public space or workplace. Finally, the atmosphere of the
photograph was analyzed, results on the photo atmosphere indicate that roughly as many photographs were taken
outside as inside. An overview of the frequencies of the variables of photograph and graphic design is presented
[image:16.595.100.531.242.698.2]in Table 6.
Table 6.
Photography variables and frequencies on Facebook, Twitter, and LinkedIn.
Facebook Twitter LinkedIn
Variable Items N (%) N (%) N (%)
Photograph/graphic design
Only photograph Only graphic design
Photography and graphic design
28 7 15 56% 14% 30% 21 7 6 61,8% 20,6% 17,6% 26 3 7 72,2% 8,3% 19,4% Main subject of
photography Product Service Employees Customer Office/building Promotions/discount Other subject
Not applicable, unable to determine
12 3 3 16 1 3 7 5 24% 6% 6% 32% 2% 6% 14% 10% 9 1 3 6 2 0 6 7 26,5% 2,9% 8,8% 17,6% 5,9% 0% 17,6% 20,6% 9 2 7 6 7 0 3 2 25% 5,6% 19,4% 16,7% 19,4% 0% 8,3% 5,6% Portrait type Single portrait
Group portrait Photo collage
Not applicable, unable to determine
18 18 5 9 36% 36% 10% 18% 15 8 4 7 44,1% 23,5% 11,8% 20,6% 22 8 2 4 61,1% 22,2% 5,6% 11,1% Number of subjects 1 subject
2 subjects 3 subjects 4 subjects 5 or more subjects
Not applicable, unable to determine
19 5 2 4 8 12 38% 10% 4% 8% 16% 24% 14 2 1 2 4 11 41,2% 5,9% 2,9% 5,9% 11,8% 32,4% 22 3 0 1 5 5 61,1% 8,3% 0% 2,8% 13,9% 13,9%
Photo effects Color photo
Black and white photo Graphically adjusted photo Not applicable, unable to determine
31 1 11 7 62% 2% 22% 14% 18 0 8 8 52,9% 0% 23,5% 23,5% 27 0 6 3 75% 0% 16,7% 8,3%
Shot type Close up
Medium shot Long shot
Not applicable, unable to determine
11 19 7 13 22% 38% 14% 26% 7 10 7 10 20,6% 29,4% 20,6% 29,4% 10 11 11 10 27,8% 30,6% 30,6% 29,4% Camera angle horizontal axis Straight Diagonal
Not applicable, unable to determine
29 9 12 58% 18% 24% 20 3 11 58,8% 8,8% 32,4% 25 7 4 69,4% 19,4% 11,1% Camera angle vertical
axis
Straight from the middle Beneath the middle Above the middle
Not applicable, unable to determine
35 1 2 12 70% 2% 4% 24% 18 3 3 10 52,9% 8,8% 8,8% 29,4% 25 3 4 4 69,4% 8,3% 11,1% 11,1% Context of photograph Home situation
Workplace situation Public space
In front of neutral/colored background Other
Not applicable, unable to determine
4 2 8 12 6 18 8% 4% 16% 24% 12% 36% 1 4 6 8 3 12 2,9% 11,8% 17,6% 23,5% 8,8% 35,3% 3 10 12 3 1 7 8,3% 27,8% 33,3% 8,3% 2,8% 19,4% Atmosphere of photograph Outside Inside
Not applicable, unable to determine
13 11 26 26% 22% 52% 8 5 21 23,5% 14,7% 61,8% 16 11 9 44,4% 30,6% 25%
CVI on Social Media 17
Consistency
To measure consistency in CVI between Facebook, Twitter and LinkedIn an inter-subject reliability analysis
has been conducted. Cohen’s Kappa was calculated between Facebook and Twitter; between Twitter and
LinkedIn; and between Facebook and LinkedIn. Finally, a three-way analysis has been conducted by using a two
way mixed reliability analysis and measuring absolute agreement in SPSS. All Cohen’s kappa coefficients
(between two platforms) and interclass correlation coefficients (three way) are presented in Table 7.
A statistical measure of inter-subject reliability, which Cohen’s Kappa is, generally ranges from 0 to 1.
Negative numbers are possible and values near or less than zero suggest that the agreement is attributable to
chance alone (Nuendorf, 2002). On the other hand, large numbers near 1.0 mean better reliability.
The results on reliability between the social media platforms show very low en sometimes negative Cohen’s
Kappa’s. These results indicate that there is little consistency in CVI between Facebook, Twitter, and LinkedIn.
Most consistency between Facebook, Twitter, and LinkedIn was found in the logo type (kappa = 0.75);
background color (kappa = 0.60 and 0.69); and context of the photograph (kappa = 0.64). Specifying the
consistency results per organization indicates that only one organization was found to be completely consistent
[image:17.595.101.525.234.553.2]in its CVI across Facebook, Twitter, and LinkedIn. Table 7.
Cohen’s Kappa’s (consistency scores) between Facebook, Twitter, and LinkedIn.
Variable Facebook-Twitter Twitter-LinkedIn Facebook-LinkedIn 3 way Kappa coefficient
N Kappa
coefficient
N Kappa
coefficient
N Interclass coefficient Avatar placing
Header placing Integrated design Logo originality (avatar) Logo originality (header) Logo type (avatar) Logo type (header) Number of logo’s (header) Text (header)
Serif font (header) Italic font (header) Script font (header) Bold font (header) Capitals font (header) Font color (header) Form elements (header) Colorfulness (header)
Color of form elements (header) Background color (avatar) Background color (header) Photo/graphic design (header) Main subject of photography (header) Photo type (header)
CVI on Social Media 18
Conclusions and discussion
Melewar and Saunders (1998) addressed CVI as the focus of the organizations identity and image, with the
name, logotype, typography, color and slogan being the five elements. Results of this study indicate the presence
of CVI traditional elements of CVI, such as logo, typography, color, slogan, but found that there as a large role
for (corporate) photography on social media.
Results on consistency indicate that only logo type and background color are found to be relatively consistent
on Facebook, Twitter, and LinkedIn. Byrom and Lehman (2007) suggest that, the logo is the key element of CVI
for representing organizations to internal- and external stakeholders, which may explain that is found to be
consistent on social media platforms.
More specifically, looking into the consistency of organizations. almost every organization was inconsistent in their CVI on Facebook, Twitter, and LinkedIn. Only the Electronics Company Phillips was found to be
completely consistent in their CVI on Facebook, Twitter, and LinkedIn. These findings are not in line with prior
academic literature, which suggest that organizations are also recognize the need to project a consistent visual
identity (Van den Bosch et al., 2004).
Reasons for this conclusion may lie in the fact that every social media platform has its own characteristics and
users. Organizations could be applying their CVI in the avatar and header to fit to a specific social media
platform and its’ users. The results in this content analysis indicate that certain organization are applying their
CVI in a way which fits a specific social media platform and its users. For example, the social media platform
Twitter is often used for customer service and this is reflected in organizations CVI on Twitter. Addressing to
this finding it is worth looking into what could be defined as ‘channel specificCVI’, instead of just looking into
consistent and inconsistent CVI. Therefore, channel specific CVI will be included in the experiment in study 2.
CVI on Social Media 19
Study 2
The results of study 1 suggest that although most of the organizations use the same CVI elements on their
social media pages, there is little consistency in CVI between the three different social media platforms. Study 1,
primarily focused on the performance of organizations in consistency of CVI. Study 2 builds on the findings of
study 1 and looks into the effects of consistent CVI on social media users. This study will not only focus on
consistent versus inconsistent CVI, but will also look into the effects of channel specific CVI. The experiment in
study 2 will explore the effects CVI on social media users’ appreciation of the CVI, appreciation of the
organization, brand awareness, and intention to commit to an organization on social media. These constructs
were adapted from prior academic literature or self-developed to fit the context of this study.
In order to explore the effects of consistent CVI on social media platforms on users, several research questions
need to be answered. The main research question and sub questions which will form the basis of this study are:
MRQ: What are the effects of consistent CVI on social media platforms’ users?
RQ1: What is the effect of consistent CVI on social media users’ appreciation of the CVI?
RQ2: What is the effect of consistent CVI on social media users’ appreciation of the organization?
RQ3: What is the effect of consistent CVI on social media users’ brand awareness?
RQ4: What is the effect of consistent CVI on social media users’ intention to commit to then
organization on social media?
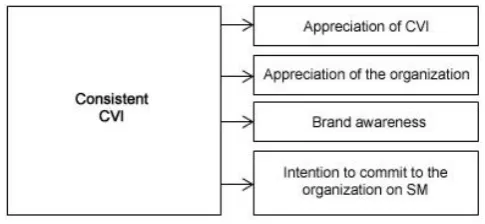
Since the research questions are now established, the research model for this study could be developed. The
research model is presented in Figure 4.
Figure 4. Research model for the possible effects of consistent CVI.
Method
Experimental design. To statistically test the research model, a 3 (CVI condition) x 2 (Organization type) between-subjects design was developed. The CVI condition consisted of consistent, channel specific, and
inconsistent CVI; the Organization type consisted of a fictional Electronics Company and a fictional Bank. This
[image:19.595.119.362.469.581.2]CVI on Social Media 20
appreciation of the CVI, appreciation of the organization, brand awareness, and intention to commit to the
organization on social media.
The data in this study were collected by using an online questionnaire in June 2014. The questionnaire was
placed on the internet and the link towards it was spread through Facebook, Twitter, LinkedIn and email. In
addition, to involve also people who use social media for profession, the link was placed in the “Dutch Facebook
Group” and “Dutch Twitter Group”, these groups consist of people who work with social media on a daily basis.
To obtain a large number of participants, snowball sampling, a chain-referral technique that builds up data
through existing social structures (Bhutta, 2012), was used. Participants were asked to fill in the questionnaire
and then spread it among their relatives, friends, and acquaintances.
Stimulus materials. The stimulus materials were developed for two fictional organizations (an
Electronics Company and a Bank) and in three CVI conditions (consistent, channel specific and inconsistent).
Stimulus materials were developed by taking screenshots of an existing organization on social media and then
adjusting it to the CVI conditions. The findings of study 1 served as support for the development of the stimulus
materials. In particualar, the avatar and header were designed, the brand name was altered into that of the
fictional organization, and everything else was blurred to avoid respondents were affected by other elements than
the avatar and header. To validate the stimulus materials, they were pre-tested by a fellow student and a
practitioner works with avatars and headers on a daily basis. Stimulus materials were pre-tested for consistency,
channel specificity, inconsistency and for its’ general impression of professionalism. An example of the stimulus
material for the fictional Bank in the consistent condition is presented in Figure 5, the remainder of the stimulus
materials are presented in Appendix D.
[image:20.595.78.524.455.547.2]
Figure 5. Stimulus material for the fictional Bank in the consistent condition.
Measurements. The dependent variables were measured by adapting and adjusting existing scales, used
in prior academic studies. Appreciation of the CVI was measured by 15 items divided into four sub constructs
(general judgment, innovativeness, reliability, and distinctiveness) as previously used by Bolhuis (2007). Bolhuis
(2007) composed a set of measurement items for appreciation of the CVI and appreciation of the organization by
deriving constructs from commonly used measurement scales (Aaker, 1997; Bartel, 2001; Chun, 2005; Davies &
Chun, 2002; Fombrun, 1996; Van Heerden & Puth, 1996). Furthermore, a single construct question was included
to rate the organization’s CVI in a score between 1 and 10.
CVI on Social Media 21
construct exists of 28 items divided into 7 sub constructs (general judgment, innovativeness, modernity, quality,
customer orientation, reliability, and distinctiveness). In addition, a single construct question was included to rate
the appreciation of the organization CVI in a score between 1 and 10. The measurement items for appreciation
of the CVI and appreciation of the organization usedbipolar adjective pairs and 5-point scales.
To measure brand awareness, four measurement items were adapted from Washburn & Plank (2002) and
added with one self-formed question. Brand awareness was measured by a 5-point Likert-scale ranging from (1)
“strongly agree” to (5) “strongly disagree”. In addition, a single construct question was included to determine if
participants would recognize the organization on social media, it used a 5-point semantic differential scale
ranging from (1) “I would not recognize…” to (2) “I would recognize…” the organization on social media.
Participants’ intention to commit to the organization on social media is measured by four items, that were
adapted from an intention scale from Dodds, Monroe, and Greal (1991) and adjusted to fit the context of this
study. Measurement items were and measured by a 5-point Likert-scale. Furthermore, a single construct question
was included, it used a 5-point semantic differential scale ranging from (1) “I would not follow to the
organization on social media” to (5) “I would follow the organization on social media”.
[image:21.595.101.526.360.539.2]Reliability analysis showed that all constructs were proven reliable (Cronbach’s Alpha ≥ 0.7), see Table 8.
Table 8.
Reliability analysis: means, standard deviations, number of items, and Cronbach’s α’s.
Construct Sub construct Nr. of
items
M SD Cronbach’s
α
Appreciation of CVI General judgment Innovativeness Credibility
Distinctiveness 4 4 3 3
3.53 3.46 3.56 2.71
0.65 0.85 0.66 1.03
0.72 0.86 0.75 0.84
Appreciation of the organization
General judgment Innovativeness Modernity Quality
Customer orientation Reliability
Distinctiveness
4 4 4 5 4 4 3
3.49 3.25 3.55 3.58 3.47 3.52 2.87
0.67 0.75 0.83 0.68 0.60 0.64 0.85
0.80 0.81 0.90 0.86 0.73 0.85 0.88
Brand awareness 5 3.29 0.75 0.82
Intention to commit to the organization on social media
4 1.79 0.80 0.93
Procedure. Respondents were asked to take part in this experiment and presented with the link towards the
online questionnaire. Respondents filled in the questionnaire in their own environment and on their own
electronic device (smartphone, tablet, laptop, and pc). Respondents were automatically and randomly assigned to
one of the six experimental conditions. First, general information about the experiment, the researcher, and the
ethical considerations was provided. Second, a task related instruction about the organization was presented.
Third, respondents were presented with the stimulus material and several questions about the stimulus material
were asked. Furthermore, respondents asked to answer some questions to determine the respondents’
demographics. At the end of the survey, respondents were debriefed about the goal of the study and thanked for
CVI on Social Media 22
Participants. In total, 347 people took part in this study. However, several of them did not finish the online survey. The data of 141 respondents were excluded since their questionnaires were not completed and
suitable for analyses. The final sample consisted of 206 respondents, 95 were men and 111 were women. Nearly
75% of the respondents were aged between 18 and 34 years old. Most of the participants 86% were highly
educated (HVE or higher).
Results
Data analyses were performed by using SPSS 20.0. The effect of CVI condition (consistent, channel specific,
and inconsistent) and Organization type (Electronics company and Bank) on the dependent variables were
statistically tested through a factorial between subjects analysis of variance (two-way ANOVA). The dataset
contained missing values which were excluded from further analyses, 206 valid surveys were taken into data
analysis.
First, the descriptives of appreciation of the CVI, appreciation of the organization, brand awareness, and
intention to commit to organization on social media are presented in tables. Second, to examine the effects of
CVI condition and Organization type further analyses are conducted in the General Linear Model (GLM),
factorial between subjects analyses of variance (two way- ANOVA) were conducted for each sub construct. In
order to correct for unequal sample sizes, Sum of squares (type 3) is used and Levene’s test were conducted.
Manipulation check. A manipulation check was conducted to determine whether respondents were
aware of the CVI manipulations. In other words, to ensure that the independent variables were perceived as
intended. A factorial between subjects analysis of variance (one-way ANOVA) with CVI condition as the
experimental condition resulted in a significant effect [F(2, 203) = 12.18, p < .001]. Additionally, a post hoc Lsd-test has been performed on the CVI conditions. There were significant results between consistent and
channel specific CVI condition (p < .001); and between channel specific and inconsistent CVI condition (p = .019). Surprisingly, results between the consistent and inconsistent CVI condition were non-significant. We
could assume participants were not always aware of the CVI condition in which they were placed, since there
were non-significant effects between these two conditions. Conclusively, these results indicate that all three CVI
manipulations did not significantly differ from each other, which does not match what could be expected.
However, further analysis could put forward significant effects of the different CVI conditions on social media
users’ appreciation of the CVI; appreciation of the organization; brand awareness; and intention to commit to the
organization on social media.
Appreciation of the CVI. Appreciation of CVI consisted of four sub constructs, general judgment, innovativeness, credibility, and distinctiveness. The average scores (M) of the respondents, together with the standard deviation (SD) and group size (n) are presented in Table 9. The main effects and interaction effects are presented per sub construct and effect sizes are also presented in Tables. Levene’s test analyses for each sub
CVI on Social Media 23
Table 9.
Descriptives of Appreciation of CVI by organization and CVI condition. Organization
Electronics comp. Bank Total Sub construct CVI Condition M SD n M SD n M SD n General Judgment Consistent Channel specific Inconsistent Total 3.49 3.64 3.45 3.52 0.85 0.64 0.61 0.70 34 33 37 104 3.39 3.66 3.54 3.54 0.67 0.52 0.61 0.59 29 36 37 102 3.45 3.65 3.50 3.53 0.77 0.58 0.59 0.65 63 69 74 206 Innovativeness Consistent
Channel specific Inconsistent Total 3.79 3.39 3.71 3.64 0.74 0.85 0.74 0.79 34 33 37 104 3.24 3.33 3.28 3.29 0.88 0.85 0.90 0.88 29 36 37 102 3.54 3.36 3.49 3.46 0.85 0.86 0.84 0.85 63 69 74 206 Credibility Consistent
Channel specific Inconsistent Total 3.52 3.65 3.50 3.55 0.86 0.43 0.61 0.65 34 33 37 104 3.70 3.34 3.70 3.56 0.50 0.78 0.65 0.68 29 36 37 102 3.60 3.49 3.60 3.56 0.71 0.65 0.63 0.66 63 69 74 206 Distinctiveness Consistent
Channel specific Inconsistent Total 2.92 2.75 2.99 2.91 0.90 1.00 0.87 0.92 34 33 37 104 2.34 2.59 2.53 2.50 0.88 0.77 0.88 0.84 29 36 37 102 2.68 2.67 2.76 2.71 0.93 0.89 0.90 0.91 63 69 74 206
First, there was a significant main effect of the Organization type on innovativeness, F(1, 200) = 8.95, p = .003, see Table 10. This result suggests that Electronics Company (M = 3.63, SD = 0.79) was significantly higher rated than the Bank (M = 3.28, SD = 0.83) on innovativeness in all three CVI conditions.
Second, there was a significant interaction between the CVI condition and the Organization type, on credibility,
F(2, 200) = 3.22, p = .04, see Table 11. The interaction effect of CVI condition and Organization type on credibility presented in Figure 6.
[image:23.595.100.433.382.441.2]The interaction effect shows that the Bank (M = 3.70, SD = 0.12) scored significantly higher than the Electronics Company (M = 3.52, SD = 0.11) in the consistent condition and also in the inconsistent condition (Bank: M = 3.70, SD = 0.11; Electronics Company: M = 3.51, SD = 0.11) on credibility. Surprisingly, results indicate an opposite effect for the channel specific condition, namely the Bank (M = 3.34, SD = 0.12) scored significantly lower than the Electronics Company (M = 3.65, SD = 0.11) in this condition.
Table 10.
ANOVA Summary for Innovativeness by CVI condition and Organization type
Source SS (type 3) df MS F 2
CVI condition Org. type CVI * Org. Error 0.93 6.21 2.21 138.91 2 1 2 200 0.464 6.21 1.11 0.69 0.67 8.95** 1.59
Note. R2 = .06, adj. R2 = -.040; * = p <.05; ** = p <.01.
Table 11.
ANOVA Summary for Credibility by CVI condition and Organization type
Source SS (type 3) df MS F 2
CVI condition Org. type CVI * Org. Error 0.58 0.03 2.80 86.97 2 1 2 200 0.29 0.03 1.40 0.435 0.66 0.08 3.22*
[image:23.595.103.427.547.610.2]