ORIGINAL RESEARCH
Sickle Cell Disease: Reference Values and
Interhemispheric Differences of Nonimaging
Transcranial Doppler Blood Flow Parameters
M. Arkuszewski J. Krejza R. Chen J.L. Kwiatkowski R. Ichord R. Zimmerman K. Ohene-Frempong L. Desiderio E.R. Melhem
BACKGROUND AND PURPOSE: TCD screening is widely used to identify children with SCD at high risk of stroke. Those with high mean flow velocities in major brain arteries have increased risk of stroke. Thus, our aim was to establish reference values of interhemispheric differences and ratios of blood flow Doppler parameters in the tICA, MCA, and ACA as determined by conventional TCD in children with sickle cell anemia.
MATERIALS AND METHODS: Reference limits of blood flow parameters were established on the basis of a consecutive cohort of 56 children (mean age, 100⫾40 months; range, 29 –180 months; 30 females) free of neurologic deficits and intracranial stenosis detectable by MRA, with blood flow velocities ⬍170 cm/s by conventional TCD. Reference limits were estimated by using tolerance intervals, within which are included with a probability of .90 of all possible data values from 95% of a population.
RESULTS: Average peak systolic velocities were significantly higher in the right hemisphere in the MCA and ACA (185 ⫾ 28 cm/s versus 179 ⫾ 27 and 152 ⫾ 30 cm/s versus 143 ⫾ 34 cm/s respectively). Reference limits for left-to-right differences in the mean flow velocities were the following:⫺43 to 33 cm/s for the MCA;⫺49 to 38 cm/s for the ACA, and⫺38 to 34 cm/s for the tICA, respectively. Respective reference limits for left-to-right velocity ratios were the following: 0.72 to 1.25 cm/s for the MCA; 0.62 to 1.39 cm/s for the ACA, and 0.69 to 1.27 cm/s for the tICA. Flow velocities in major arteries were inversely related to age and Hct or Hgb.
CONCLUSIONS:The study provides reference intervals of TCD flow velocities and their interhemi-spheric differences and ratios that may be helpful in identification of intracranial arterial stenosis in children with SCD undergoing sonographic screening for stroke prevention.
ABBREVIATIONS:ACA⫽anterior cerebral artery; CHOP⫽Children’s Hospital of Philadelphia;F⫽ Snedecor ratio; Hct⫽hematocrit level (%); Hgb⫽hemoglobin concentration (g/dL); ICA⫽internal carotid artery; MCA⫽middle cerebral artery; MRA⫽MR angiography; PI⫽pulsatility index;r⫽ Pearson correlation;R⫽Spearman correlation; SCD⫽ sickle cell disease; TCD⫽transcranial Doppler sonography; tICA⫽terminal segment of internal carotid artery; TOF⫽time-of-flight; VED⫽ end-diastolic velocity; VMN⫽mean time-averaged maximum velocity; VPS⫽peak systolic velocity
C
hildren with SCD are at high risk for developing stroke.1-3 The risk is highest in children with elevated blood flow velocity in the tICA or proximal MCA as measured with TCD.4 Chronic blood transfusions, if implemented in a timely fash-ion, in those with flow velocity⬎200 cm/s can reduce the risk of stroke by as much as 92%.1The use of a single TCD velocity alone to stratify risk of stroke is limited, as shown by the factthat 60% of patients with velocities in the high-risk range, who did not receive chronic transfusion therapy, remained stroke-free during the subsequent 40 months.2,5Also, a single flow-velocity measurement from an artery cannot differentiate arterial stenosis from hyperemia.6-8 Hyperemia is a sign of worsening global anemia,6,7thus existing intracranial stenosis inevitably must augment the risk of stroke. It is tempting to assume, therefore, that children with hyperemia may not have the same risk/benefit ratio from indefinite transfusions as those with arterial stenosis.
The Stroke Prevention Trial in Sickle Cell Anemia investi-gators suggested that unilateral high-flow velocity indicates stenosis, whereas bilateral high velocity represents bilateral stenosis, hyperemia, or both.1,9Substantial side-to-side dif-ferences in flow velocities in individual children without any arterial stenosis,10 however, indicate that extrapolation of average group symmetry in flow velocities to individual chil-dren with SCD may not be correct.
There is a potential to improve the sonography screening by using reference tolerance limits of interhemispheric differ-ences in flow velocities in major brain arteries. These tolerance limits can inform an investigator of the side-to-side differ-ences in blood flow Doppler parameters that can occur in
Received October 19, 2010; accepted after revision December 16.
From the Department of Radiology (M.A., J.K., R.C., L.D., E.R.M.), Division of Neuroradi-ology, University of Pennsylvania, Philadelphia, Pennsylvania; Department of Neurology (M.A.), Medical University of Silesia, Katowice, Poland; Department of Nuclear Medicine (J.K.), Medical University of Gdansk, Gdansk, Poland; Al-Imam Muhammad Ibn Saud Islamic University (J.K.), Riyadh, Saudi Arabia; and Departments of Hematology (J.L.K., K.O.-F.), Neurology (R.I.), Pediatrics (R.I.), and Radiology (R.Z.), Children’s Hospital of Philadelphia, Philadelphia, Pennsylvania.
This research was supported by the National Institutes of Health grant (5-R01 NS-046717, principal investigator: PI-Elias R. Melhem).
Paper previously presented in part of at: Annual Meeting of the American Society of Neuroradiology, May 15–20, 2010; Boston, Massachusetts.
Please address correspondence to: Jaroslaw Krejza, MD, PhD, Department of Radiology, Division of Neuroradiology, University of Pennsylvania, 3600 Market St, Science Building, Suite 370, Philadelphia, PA 19104; e-mail: [email protected]
Indicates open access to non-subscribers at www.ajnr.org
children with SCD without hyperemia or evidence of arterial stenosis. Thus, the goal of our study was to establish such reference tolerance limits for TCD parameters on the basis of data from children with SCD who were not on chronic trans-fusion therapy, who had no history of overt stroke, who were free of signs or symptoms of focal vascular-territory ischemic brain injury, and who did not have intracranial arterial steno-sis on MRA.
Materials and Methods
The institutional review board of the CHOP approved the protocol of this prospective study that was also compliant with the Health Insur-ance Portability and Accountability Act. Our cohort was recruited within the frame of the SCD Children Ongoing Radiologic Evaluation study sponsored by the National Institutes of Health. Written in-formed consent was given by subjects’ parents (with assent for sub-jects 7 years and older).
Study Group
The study group was drawn from the Comprehensive Sickle Cell Center at CHOP by using the following inclusion criteria: 1) homo-zygous for the sickle cell gene (SS), confirmed by DNA– based muta-tional analysis; 2) 4 –14 years of age; 3) absence of localizing
abnor-malities on neurologic examination indicating prior
vascular-territory ischemic injury; and 4) no history of stroke. Exclusion criteria were the following: 1) history of major head injury requiring a visit to an emergency department, 2) history of seizure disorder requiring anticonvulsant therapy, 3) chronic transfusion therapy, 4) occurrence of acute chest syndrome or other significant acute illness in the period between blood laboratory and sonographic studies, 5) history of prenatal or perinatal hypoxic-ischemic brain injury, 6) evidence of human immunodeficiency virus infection, 7) pregnancy, and 8) mean flow velocity⬎170 cm/s in any intra-cranial artery on a screening routine TCD examination at entry to the study.
Clinical Assessment
A pediatric neurologist performed screening neurologic assessment to determine whether the child met neurologic inclusion and sion criteria. The assessment included a history of pre-existing exclu-sionary neurologic diagnoses (major head injury, epilepsy, prenatal or perinatal hypoxic-ischemic brain injury, prior clinically overt stroke) and a standard comprehensive neurologic examination for localizing deficits consistent with prior cerebrovascular insult. All qualifying children subsequently underwent TCD, brain MR imag-ing, and MRA examinations. Hgb and Hct were obtained during well visits closest to the time of sonographic studies. If hematology data were unavailable within 30 days of the study, we used an average of Hgb and Hct values from the 3 closest well visits because children were at steady-state. Thirty-three (59%) children had hematologic studies performed within 30 days of TCD examination, and only 1 child had laboratory studies performed earlier than 1 year before the sonography study. The median time from Hct and Hgb measure-ments to sonographic studies was 23 days (range limits, 0 – 437 days).
TCD
TCD studies were performed independently of MRA by 1 of 3 sonog-raphers, each with⬎5 years of experience, by using a single-channel portable unit (Pioneer TC 8080; Nicolet Vascular, Madison, Wiscon-sin) equipped with a hand-held transducer operated in a range-gated
pulse-waved mode at 2 MHz. The studies were performed while the children were awake; no sedation was used. TCD studies were per-formed by using a standard approach through a temporal acoustic window. Blood flow Doppler signal intensity in the tICA, MCA, and ACA arteries was detected by using an adjustable operating depth at 2-mm increments and the sample volume size of 8 –10 mm in the axial and 5 mm in the lateral direction.11The V
MN, VPS, and VEDvelocities
were obtained by automatic tracing of the outline of Doppler wave-forms. PI was calculated by using the following formula: PI⫽(VPS⫺ VED)/VMN). For the analysis, we selected recordings based on the
highest recorded velocity value in the particular artery.
In 1 patient, the TCD examination was unsuccessful due to the patient’s agitation and anxiety.
MRA
To exclude children with intracranial arterial stenosis, we performed a TOF 3D gradient-echo sequence (TR/TE⫽28/3.28 ms, flip angle⫽ 25°; matrix⫽512⫻448) on a 3T scanner (Magnetom Trio; Siemens, Erlangen, Germany) covering the intracranial arteries in the axial plane. Raw data from TOF MRA were transferred to an on-line work-station for the generation of segmented 2D arterial reprojections by using a commercially available maximum intensity projection ray trace and multiplanar reconstruction algorithms. The segmented 2D reprojections and raw data of the intracranial part of the ICAs and branches of the circle of Willis were displayed on a 1024⫻1024 pixel-display workstation and evaluated independently by 2 pediatric neuroradiologists (E.R.M. with 15 and R.Z. with 25 years of experi-ence in angiography) unaware of the sonographic findings. Each eval-uated all studies, and discrepancies were resolved by consensus. No extracranial arterial narrowing was identified in any patients. The neuroradiologists excluded 7 children with intracranial arterial steno-sis and 4 with degraded MRAs due to motion artifacts.
Statistical Analyses
We used the statistical software SYSTAT 12 (SPSS Science, Chicago, Illinois), GraphPad free software (GraphPad, La Jolla, California; http://www.graphpad.com), and R statistical computing software (http://www.r-project.org/) to analyze data. Flow velocities were treated for outliers by using Grubbtstatistics at an␣level⬍.05.12
Outliers in blood flow parameters, if present, were not considered while checking for normality by using Lilliefors test, provided by SYSTAT. Because there were no outliers, the values of flow velocities from both hemispheres were first compared by using a paired 2-sided ttest and for PI by using the Wilcoxon test. A Pearson correlation coefficient (r) for normally distributed data and a Spearman rank correlation coefficient (R) for non-normally distributed data were used to quantify between-sides relationships of TCD parameters. Sex differences in age, hematology values, blood flow parameters, and interhemispheric differences and ratios were analyzed by using a 2-samplettest for unequal variances and by using the Mann-Whitney Utest for non-normally distributed data.
We used estimates of tolerance intervals, which have a probability of .90 of containing 95% of the population, to determine reference values of interhemispheric differences and ratios in Doppler param-eters.13Because Doppler velocities followed Gaussian distribution,
we calculated the Gaussian tolerance interval. If L1 and L2 are the lower and upper limits of the interval, then L1⫽⫺ks, L2⫽⫹ks, where values ofkwere taken from an article by Weissberg-Beatty,14
⫽mean,s⫽SD. For PI, interhemispheric differences, and ratios in
PEDIATRICS
ORIGINAL
Doppler parameters, we calculated nonparametric tolerance intervals based on the method of Wilks.15
Multivariable linear regression analysis was used to determine associations of blood flow Doppler parameters with age after ad-justment for Hgb or Hct. Using a distance-weighted least-squares smoothing method, we computed curves for the mean flow velocity and age relation. Also the age dependency curves were computed for Hct and Hgb.
A probability of⬍.05 was considered significant.
Results
Fifty-six children (mean age, 100⫾40 months; range limits, 29 –180 months; 30 females, 26 males) of 74 completed all studies and did not have arterial stenosis on MRA. There was no age difference between males and females. Mean values of hematologic variables were Hgb⫽8.2⫾1.2 g/dL and Hct⫽ 23.9 ⫾ 3.5% and were not different between males and females.
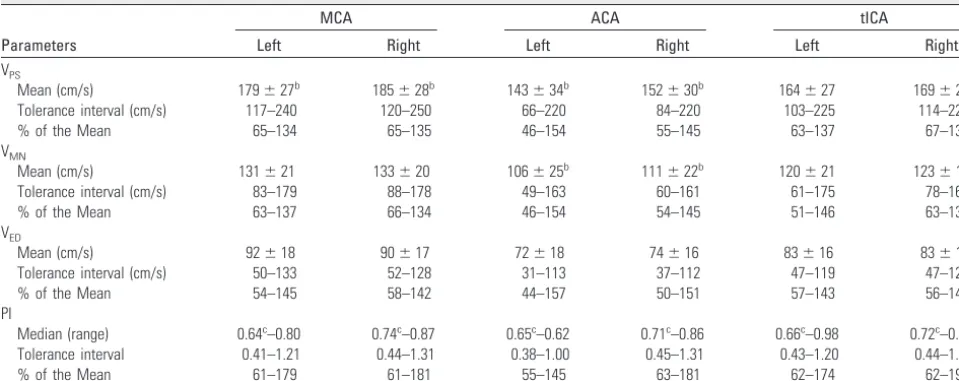
Tolerance Intervals for Blood Flow Doppler Parameters In 4 patients, we found TCD velocities slightly higher than 170 cm/s. The discrepancy between the entry TCD criterion and actual TCD values taken for analysis most likely occurred due to interval change in hemodynamic status between re-cruitment and TCD performed for the study. No outliers were found in values of Doppler blood flow velocities. The refer-ence ranges for all parameters were generally wide (Table 1). The upper reference limits of mean blood flow velocities in both MCAs were higher by 8 –9 cm/s above the threshold com-monly used to separate normal from conditional flow veloci-ties. In contrast, in both ACAs, the respective limits were lower by approximately 7–9 cm/s. Only limits for both tICAs were very close to the threshold.
Correlation coefficients for Doppler parameters between sides in the studied arteries were high and varied from 0.67 to 0.77, except for the PI from the ACA, where r was 0.55 (Table 2). No significant sex differences were found in any TCD parameter. With linear regression models, we found
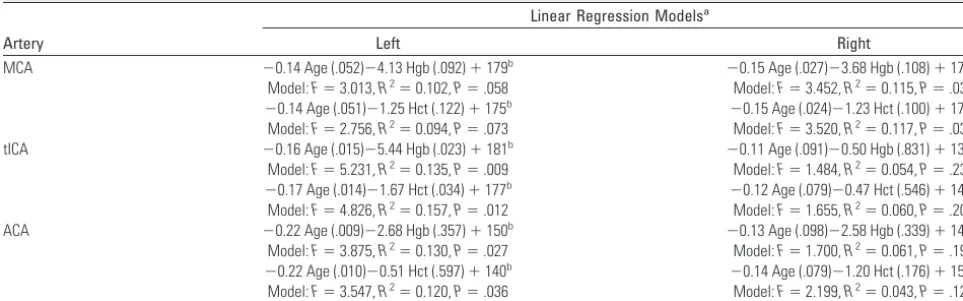
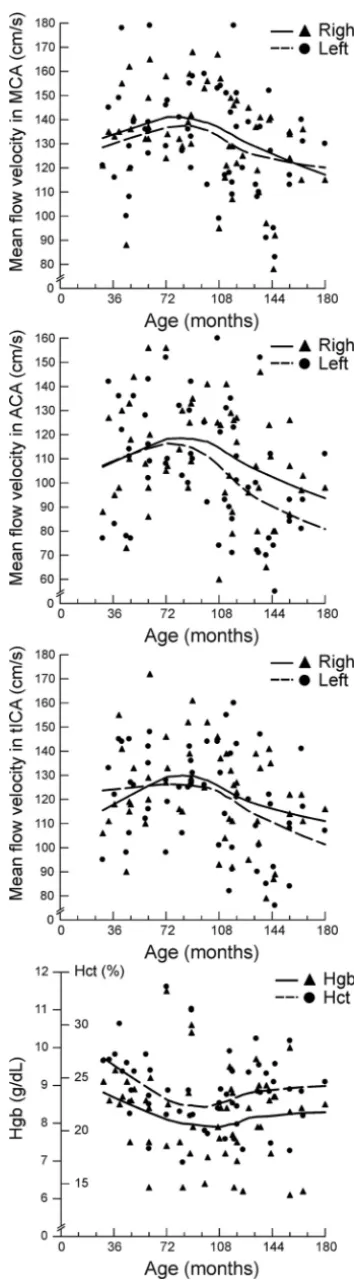
sig-nificant inverse relationships between blood flow velocities in major brain arteries with age, when controlling for Hct or Hgb (Table 3 and Fig 1). Although in some individual blood flow Doppler parameters, the age dependency did not reach statis-tical significance, the dependency pattern across arteries was consistent. The velocities decreased with age in children older than 84 –96 months.
Tolerance Intervals for Interhemispheric Differences in Blood Flow Doppler Parameters
Average VPSvalues were significantly higher on the right side compared with the left side in the MCA and ACA (Table 1). The difference in the tICA was similar; however, it did not reach statistical significance (t⫽1.96,P⫽.055). Average VMN and VED values were not different between sides, except for VMNin the ACA (Table 1). PI values were also significantly higher on the right side in all studied arteries (Table 1).
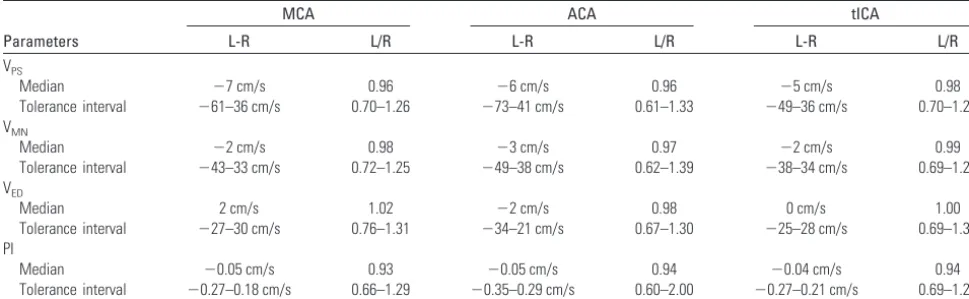
[image:3.594.53.533.68.258.2]Average peak systolic and mean blood flow velocities and also PIs in all arteries were lower on the left side than on the right side, resulting in a negative left-to-right difference (Tables 1 and 4). Only the left-to-right difference for VEDin the MCA was positive. The tolerance of reference intervals for absolute differences between sides in the mean flow velocities in the MCA varied from⫺43 to 33 cm/s (Table 4). Tolerance limits tend to be asymmetric; for instance in the MCA, the limit of mean peak systolic velocity right-to-left difference was 61 cm/s, whereas the velocity on the left side compared with the velocity on the right side was considered “normal” if the
Table 2: Correlation coefficients for blood flow Doppler parameters from right-sided MCA, ACA, and tICA with corresponding
parameters from left-sided arteries in 56 children with SCDa
Parameter MCA ACA tICA
VPS(R) 0.70 0.68 0.67
VMN(R) 0.76 0.71 0.67
VED(R) 0.73 0.77 0.68
PI (R) 0.68 0.55 0.71
a
[image:3.594.301.533.331.387.2]All correlations were significant,P⬍.001.
Table 1: Values of blood flow Doppler parameters with their tolerance interval limits given for MCA, ACA, and tICA obtained in 56 children with SCD
Parameters
MCA ACA tICA
Left Right Left Right Left Right
VPS
Mean (cm/s) 179⫾27b 185⫾28b 143⫾34b 152⫾30b 164⫾27 169⫾24
Tolerance interval (cm/s) 117–240 120–250 66–220 84–220 103–225 114–225
% of the Mean 65–134 65–135 46–154 55–145 63–137 67–133
VMN
Mean (cm/s) 131⫾21 133⫾20 106⫾25b 111⫾22b 120⫾21 123⫾19
Tolerance interval (cm/s) 83–179 88–178 49–163 60–161 61–175 78–167
% of the Mean 63–137 66–134 46–154 54–145 51–146 63–136
VED
Mean (cm/s) 92⫾18 90⫾17 72⫾18 74⫾16 83⫾16 83⫾16
Tolerance interval (cm/s) 50–133 52–128 31–113 37–112 47–119 47–120
% of the Mean 54–145 58–142 44–157 50–151 57–143 56–143
PI
Median (range) 0.64c–0.80 0.74c–0.87 0.65c–0.62 0.71c–0.86 0.66c–0.98 0.72c–0.96
Tolerance interval 0.41–1.21 0.44–1.31 0.38–1.00 0.45–1.31 0.43–1.20 0.44–1.40
% of the Mean 61–179 61–181 55–145 63–181 62–174 62–197
aLimits of tolerance intervals for each Doppler parameter are also provided as a percentage of the mean to better disclose the magnitude of limits. bStatistically significant between-sides difference where thePvalue is⬍.05 (ttest).
difference was not higher than 36 cm/s. Tolerance of reference limits for PIs showed the same asymmetric pattern in all studied arteries (Table 4).
The average interhemispheric index calculated on the basis of all velocity values for the MCA was 0.98, while averaged left-to-right limits of the tolerance interval of the index were 0.72–1.27. For instance, mean blood flow velocity on the right side, as high as 80% of the velocity on the left side, is consid-ered normal, while on the left side, velocity as high as 72% of the velocity on the right side is still normal. The tolerance interval for the tICA was similar, and for the ACA, it was wider. The average left/right interhemispheric ratios in PIs were slightly lower than 1.0; however, the tolerance interval for the left/right ratio in the ACA was wider than that for the MCA and tICA (Table 4). No significant sex differences were found in any of the left-to-right differences or ratios of all analyzed TCD parameters.
Discussion
Our study provides tolerance limits for TCD parameters and their interhemispheric differences in major brain arter-ies for children with SCD without arterial stenosis on MRA. Therefore, blood flow Doppler parameters and the inter-hemispheric differences within these limits in a child in whom TCD velocities are below 170 cm/s likely do not rep-resent arterial stenosis, while the differences over the upper tolerance limits may indicate the presence of stenosis. The latter suggestion needs to be verified in a separate study in a group of children with a larger sample of those with stenosis compared with ours. These limits also may help to distin-guish stenosis from hyperemia in children with TCD veloc-ities⬎170 cm/s, a concept that also deserves further study. Tolerance limits can have immediate practical utility be-cause they may allow more reliable selection of children who would most benefit from close TCD or MRA surveil-lance and treatment.16,17
Tolerance Intervals for Intracranial Flow Velocities We also provided TCD values of reference intervals for MCAs, tICAs, and ACAs. Upper limits of the mean TCD velocities in MCAs are higher by approximately 10 cm/s than the com-monly used threshold of 170 cm/s, which indicates probably
abnormal findings.4The upper reference limit for the ACA is, in contrast, lower by approximately 10 cm/s than the sug-gested threshold. Only the upper limit for the mean velocity in the tICA is almost the same as the commonly used threshold value of 170 cm/s. It is reasonable to suggest, therefore, that the upper limits of normal values are different for the MCA, ACA, and tICA. Our findings also suggest that the risk of stroke may vary depending on a TCD recording from a specific artery if the same velocity threshold is used to define the risk.
An inverse relationship between blood flow TCD velocities and age in most large brain arteries may suggest that the risk of stroke may not be determined accurately when one velocity threshold is used across the entire age span. In healthy chil-dren, flow velocities in the MCA and ICA are lower in older children,10,18probably as a result of proportional growth of both arteries along with body development.19The slope of age dependency however, is flatter in children with SCD. Such dissociation between blood flow velocity and age in children with SCD can be explained by the effect of hyperdynamic cir-culation associated with lower Hct and Hgb.5,6,20We also did find an inverse relationship between blood flow TCD veloci-ties and hematologic parameters. The right-side predomi-nance of higher velocity findings is similar to the right-side effects observed in elderly individuals and in those with hyper-tension.21,22It would be interesting to know if such a pattern occurs in healthy children.
As in healthy children, sex differences in Doppler parame-ters were not observed in our group.10,18Two other reports, however, did show these differences,23,24 which were ex-plained by sex differences in cerebrovascular resistance and vascular reactivity. In children with SCD, altered resistance and reactivity may counterbalance sex differences in Doppler parameters.25-27
High values of correlation coefficients for blood flow Doppler velocities between sides may suggest that TCD re-cordings are reliable indicators of a balanced hemodynamic status. This notion is rather unexpected, however, because of the large variability in arterial trajectory and its caliber, varia-tion in instant arterial blood flow and hemispheric metabolic activity, the distribution of microvascular changes, and indi-vidual variations in the circle of Willis. In our opinion, the TCD method does not capture an individual geometric
pat-Table 3: Associations of transcranial Doppler mean blood flow velocity in centimeters per second (dependent variable in all models) with age in months, when controlling for Hgb and Hct in 56 children with SCD as determined with multivariable linear regression analysis
Artery
Linear Regression Modelsa
Left Right
MCA ⫺0.14 Age (.052)⫺4.13 Hgb (.092)⫹179b ⫺0.15 Age (.027)⫺3.68 Hgb (.108)⫹178b
Model:F⫽3.013,R2⫽0.102,P⫽.058 Model:F⫽3.452,R2⫽0.115,P⫽.039
⫺0.14 Age (.051)⫺1.25 Hct (.122)⫹175b ⫺0.15 Age (.024)⫺1.23 Hct (.100)⫹177b
Model:F⫽2.756,R2⫽0.094,P⫽.073 Model:F⫽3.520,R2⫽0.117,P⫽.037
tICA ⫺0.16 Age (.015)⫺5.44 Hgb (.023)⫹181b ⫺0.11 Age (.091)⫺0.50 Hgb (.831)⫹138b
Model:F⫽5.231,R2⫽0.135,P⫽.009 Model:F⫽1.484,R2⫽0.054,P⫽.236
⫺0.17 Age (.014)⫺1.67 Hct (.034)⫹177b ⫺0.12 Age (.079)⫺0.47 Hct (.546)⫹146b
Model:F⫽4.826,R2⫽0.157,P⫽.012 Model:F⫽1.655,R2⫽0.060,P⫽.201
ACA ⫺0.22 Age (.009)⫺2.68 Hgb (.357)⫹150b ⫺0.13 Age (.098)⫺2.58 Hgb (.339)⫹145b
Model:F⫽3.875,R2⫽0.130,P⫽.027 Model:F⫽1.700,R2⫽0.061,P⫽.193
⫺0.22 Age (.010)⫺0.51 Hct (.597)⫹140b ⫺0.14 Age (.079)⫺1.20 Hct (.176)⫹153b
Model:F⫽3.547,R2⫽0.120,P⫽.036 Model:F⫽2.199,R2⫽0.043,P⫽.121 aPvalues for each independent variable are given in parentheses.
[image:4.594.52.534.69.219.2]tern because velocity measurements are not corrected for an error related to the angle between the artery and the sonogra-phy beam. Also the depth of insonation is not visually con-trolled because the arteries are not imaged with conventional TCD. Hence, the probability for erroneous sampling is high. In newer imaging TCD, both the angle of insonation and the depth of velocity sampling are well controlled; thus, the geometric pattern is taken into account.28Consequently, the between-sides correlation coefficients for imaging TCD veloc-ities are smaller compared with corresponding coefficients for conventional TCD.29Our finding of a lower correlation coefficient for PI further supports this line of argument, be-cause the PI, practically, does not depend on the vascular con-figuration of large arteries.30
Tolerance Intervals for Interhemispheric Differences Average side-to-side differences in hemodynamic parameters in adults were reported to be negligible; thus, substantial in-terhemispheric asymmetry is commonly interpreted as a sign of arterial narrowing.1,9,31-33 The statistical average group difference cannot be applied to an individual, in whom the exact configuration of the circle of Willis,34including the pres-ence, caliber, and course of each artery,35,36and the degree of interhemispheric anatomic,37-39physiologic,4-42and patho-physiologic differences are, a priori, unknown.31,35,43,44Large variability in side-to-side impedance indices and modest cor-relation coefficients for vessels that supposedly have no steno-sis and hemispheres that are “seeing” the same circulating oxygen content and Hgb indicate that there is not such a tight agreement between sides in blood flow redistributions in re-sponse to a chronic oxygen deficit.6-8,43
Also a minor arterial stenosis, which could have remained undetected on MRA, potentially contributed to the variability in our study because the analysis of the Hagen-Poiseuille equa-tion indicates that even small changes in the artery radius may result in extremely drastic changes in flow velocity.1 Such minor stenosis can have important significance in children with SCD in whom adaptation to altered blood rheology may not be well balanced. Hence, the reference tolerance limits of interhemispheric differences are important in interpretation of measurements of blood flow velocities used in screening children with SCD.
The use of side-to-side indices to detect stenosis can be beneficial because they are supposed to be resistant to bilateral physiologic changes.45 The use of interhemispheric indices improves the interobserver and intraobserver reproducibility of Doppler parameters by approximately 50%.45A strong as-sociation between the asymmetric MCA velocity pattern, taken as 15% side-to-side variations in healthy adults,32,33 and hemodynamically significant carotid disease or the pres-ence of underlying ischemic stroke was reported.31 Higher flow-velocity asymmetry was reported in healthy white chil-dren, almost similar to asymmetry observed in our group.10 The threshold of 15% of interhemispheric differences as a ref-erence tolerance limit, therefore, should no longer be applied to the individual child with SCD for differentiation of hyper-emia from arterial stenosis.
In children with SCD, hyperemic blood flow velocity and hence shear rate are an adaptation to increased blood viscosity. Differentiation of such hyperemic flow patterns from patho-Fig 1.Diagrams show the age distribution of mean blood flow velocity in the MCA, ACA,
[image:5.594.79.256.40.683.2]logic hyperemia is a matter of arbitrary judgment and is not only far from consensus but also needs more and better inves-tigational research data to build assumptions based on evi-dence. Nevertheless, we propose considering hyperemia when blood flow velocity in a particular artery exceeds 170 cm/s without the presence of narrowing. This suggestion is limited, however, because the universal velocity threshold value for all patients with SCD may not work very well for each individual because velocities depend on hematologic status.
The widths of reference intervals for interhemispheric differences and ratios are narrower for conventional TCD than for imaging TCD. This finding is expected because the variability of velocity measurements is higher for the TCD method, in which the cosine of the angle of insonation is taken into account in velocity calculations. The variability of the angle is related to both the trajectory of the insonated artery in the intracranial space and the position of the sonography probe on the outer surface of the squama of the temporal bone in the so-called “temporal acoustic window.” The “window” is particularly large in children compared with adults, so an op-erator can capture the artery from many different angles with the potential for a larger range of possible insonation errors.
Our number of subjects is relatively small compared with studied groups of healthy children. The National Committee for Clinical Laboratory Standards recommends that the sam-ple size should consist of at least 120 values.46,47The Commit-tee recognizes, however, that in a special category of individ-uals, 39 observations is the required minimum to compute a 95% reference interval at 2.5% and 97.5% of the points of the distribution.
Conclusions
This study provides reference limits of TCD blood flow veloc-ities and their interhemispheric differences and ratios that may be helpful in identification of intracranial arterial stenosis in low-risk children with SCD undergoing sonographic screening for stroke prevention.
Disclosures: Janet Kwiatkowski.Research Support (including provision of equipment or materials):NIH-NHLBI;Details:Grant support. Rebecca Ichord.Consultant:Berlin Heart;
Details:Member of Event Committee for ventricular assist device. Payment of approxi-mately $250 quarterly for time spent on adjudicating adverse events.
References
1. Adams RJ, McKie VC, Hsu L, et al.Prevention of a first stroke by transfusions in children with sickle cell anemia and abnormal results on transcranial Doppler ultrasonography.N Engl J Med1998;339:5–11
2. Adams RJ, McKie VC, Carl EM, et al.Long-term stroke risk in children with sickle cell disease screened with transcranial Doppler.Ann Neurol1997; 42:699 –704
3. Arkuszewski M, Melhem ER, Krejza J.Neuroimaging in assessment of risk of stroke in children with sickle cell disease.Adv Med Sci2010;55:115–29 4. Adams R, McKie V, Nichols F, et al.The use of transcranial ultrasonography to
predict stroke in sickle cell disease.N Engl J Med1992;326:605–10 5. Lee MT, Piomelli S, Granger S, et al.Stroke Prevention Trial in Sickle Cell
Anemia (STOP): extended follow-up and final results.Blood2006;108:847–52 6. Prohovnik I, Pavlakis SG, Piomelli S, et al.Cerebral hyperemia, stroke, and
transfusion in sickle cell disease.Neurology1989;39:344 – 48
7. Prohovnik I, Hurlet-Jensen A, Adams R, et al.Hemodynamic etiology of ele-vated flow velocity and stroke in sickle cell disease.J Cereb Blood Flow Metab
2009;29:803–10
8. Ausavarungnirun P, Sabio H, Kim J, et al.Dynamic vascular analysis shows a hyperemic flow pattern in sickle cell disease.J Neuroimaging2006;16:311–17 9. Adams RJ, Nichols FT, Figueroa R, et al.Transcranial Doppler correlation with
cerebral angiography in sickle cell disease.Stroke1992;23:1073–77 10. Schoning M, Staab M, Walter J, et al.Transcranial color duplex sonography in
childhood and adolescence: age dependence of flow velocities and waveform parameters.Stroke1993;24:1305– 09
11. Aaslid R, Markwalder TM, Nornes H.Noninvasive transcranial Doppler ultra-sound recording of flow velocity in basal cerebral arteries.J Neurosurg
1982;57:769 –74
12. Grubbs FE. Procedures for detecting outlying observations in samples.
Technometrics1969;11:1–21
13. Lumsden JH, Mullen K.On establishing reference values.Can J Comp Med
1978;42:293–301
14. Weissberg AB, Beatty GH.Tables of tolerance limit factors for the normal distribution.Technometrics1960;2:483–500
15. Wilks S.Determination of sample sizes for setting tolerance limits.Annals of Mathematical Statistics1941;12:91–96
16. Adams RJ, Brambilla DJ, Granger S, et al.Stroke and conversion to high risk in children screened with transcranial Doppler ultrasound during the STOP study.Blood2004;103:3689 –94
17. Hankins JS, Fortner GL, McCarville MB, et al.The natural history of condi-tional transcranial Doppler flow velocities in children with sickle cell anae-mia.Br J Haematol2008;142:94 –99
18. Schoning M, Hartig B.The development of hemodynamics in the extracranial carotid and vertebral arteries.Ultrasound Med Biol1998;24:655– 62 19. Seong J, Lieber BB, Wakhloo AK.Morphological age-dependent development
of the human carotid bifurcation.J Biomech2005;38:453– 65
20. Hayashi K, Handa H, Nagasawa S, et al.Stiffness and elastic behavior of human intracranial and extracranial arteries.J Biomech1980;13:175– 84
21. Krejza J, Arkuszewski M, Kasner S, et al.Carotid artery diameter in men and women and the relation to body and neck size.Stroke2006;37:1103– 05 22. Zbornikova V, Lassvik C.Duplex scanning in presumably normal persons of
different ages.Ultrasound Med Biol1986;12:371–78
23. Vavilala MS, Kincaid MS, Muangman SL, et al.Gender differences in cerebral blood flow velocity and autoregulation between the anterior and posterior circulations in healthy children.Pediatr Res2005;58:574 –78
[image:6.594.52.537.70.219.2]24. Tontisirin N, Muangman S, Suz P, et al.Early childhood gender differences
Table 4: Interhemispheric differences (values from the left minus values from the right) in centimeters per second and ratios (values from the left side divided by values from the right side) with TCD ultrasonography in 56 children with SCD
Parameters
MCA ACA tICA
L-R L/R L-R L/R L-R L/R
VPS
Median ⫺7 cm/s 0.96 ⫺6 cm/s 0.96 ⫺5 cm/s 0.98
Tolerance interval ⫺61–36 cm/s 0.70–1.26 ⫺73–41 cm/s 0.61–1.33 ⫺49–36 cm/s 0.70–1.21 VMN
Median ⫺2 cm/s 0.98 ⫺3 cm/s 0.97 ⫺2 cm/s 0.99
Tolerance interval ⫺43–33 cm/s 0.72–1.25 ⫺49–38 cm/s 0.62–1.39 ⫺38–34 cm/s 0.69–1.27 VED
Median 2 cm/s 1.02 ⫺2 cm/s 0.98 0 cm/s 1.00
Tolerance interval ⫺27–30 cm/s 0.76–1.31 ⫺34–21 cm/s 0.67–1.30 ⫺25–28 cm/s 0.69–1.36 PI
Median ⫺0.05 cm/s 0.93 ⫺0.05 cm/s 0.94 ⫺0.04 cm/s 0.94
in anterior and posterior cerebral blood flow velocity and autoregulation.
Pediatrics2007;119:E610 –15
25. Brown MM, Wade JP, Marshall J.Fundamental importance of arterial oxygen content in the regulation of cerebral blood flow in man.Brain1985;108:81–93 26. Reiter CD, Wang X, Tanus-Santos JE, et al.Cell-free hemoglobin limits nitric
oxide bioavailability in sickle-cell disease.Nat Med2002;8:1383– 89 27. Van Mil AH, Spilt A, Van Buchem MA, et al.Nitric oxide mediates
hypoxia-induced cerebral vasodilation in humans.J Appl Physiol2002;92:962– 66 28. Krejza J, Mariak Z, Melhem E, et al.A guide to the identification of major
cerebral arteries with transcranial color Doppler sonography.AJR Am J Roentgenol2000;174:1297–303
29. Pawlak MA, Krejza J, Rudzinski W, et al.Sickle cell disease: ratio of blood flow velocity of intracranial to extracranial cerebral arteries: initial experience.
Radiology2009;251:525–34
30. Forteza A, Krejza J, Koch S, et al.Ultrasound imaging of cerebrovascular dis-ease.In: Babikian VL, Wechsler L, Higashida RT, eds.Imaging Cerebrovascular Disease.Philadelphia: Butterworth-Heinemann; 2003:3–35
31. Brint SU, Al-Khalidi HR, Vatel B, et al.MCA flow asymmetry is a marker for cerebrovascular disease.Neurol Res1996;18:163– 67
32. Grolimund P, Seiler RW, Aaslid R, et al.Evaluation of cerebrovascular disease by combined extracranial and transcranial Doppler sonography: experience in 1,039 patients.Stroke1987;18:1018 –24
33. Sorteberg W, Langmoen IA, Lindegaard KF, et al.Side-to-side differences and day-to-day variations of transcranial Doppler parameters in normal subjects.
J Ultrasound Med1990;9:403– 09
34. Riggs HE, Rupp C.Variation in form of circle of Willis: the relation of the variations to collateral circulation—anatomic analysis.Arch Neurol1963;8: 8 –14
35. Krejza J, Mariak Z, Babikian VL.Importance of angle correction in the mea-surement of blood flow velocity with transcranial Doppler sonography.AJNR Am J Neuroradiol2001;22:1743– 47
36. Zurada A, St Gielecki J, Tubbs RS, et al.Three-dimensional morphometry of
the A1 segment of the anterior cerebral artery with neurosurgical relevance.
Neurosurgery2010;67:1768 – 82, discussion 1782
37. Chen R, Pawlak MA, Flynn TB, et al.Brain morphometry and intelligence quotient measurements in children with sickle cell disease.J Dev Behav Pediatr
2009;30:509 –17
38. Thoma RJ, Yeo RA, Gangestad SW, et al.Fluctuating asymmetry and the hu-man brain.Laterality2002;7:45–58
39. Watkins KE, Paus T, Lerch JP, et al.Structural asymmetries in the human brain: a voxel-based statistical analysis of 142 MRI scans.Cereb Cortex
2001;11:868 –77
40. Hendrikse J, van Raamt AF, van der Graaf Y, et al.Distribution of cerebral blood flow in the circle of Willis.Radiology2005;235:184 – 89
41. Vallortigara G.The evolutionary psychology of left and right: costs and bene-fits of lateralization.Dev Psychobiol2006;48:418 –27
42. Schaafsma SM, Riedstra BJ, Pfannkuche KA, et al.Epigenesis of behavioural lateralization in humans and other animals.Philos Trans R Soc Lond B Biol Sci
2009;364:915–27
43. Sette G, Baron JC, Mazoyer B, et al.Local brain haemodynamics and oxygen metabolism in cerebrovascular disease: positron emission tomography.Brain
1989;112(pt 4):931–51
44. van den Tweel XW, Nederveen AJ, Majoie CB, et al.Cerebral blood flow mea-surement in children with sickle cell disease using continuous arterial spin labeling at 3.0-Tesla MRI.Stroke2009;40:795– 800
45. Bay-Hansen J, Ravn T, Knudsen GM.Application of interhemispheric index for transcranial Doppler sonography velocity measurements and evaluation of recording time.Stroke1997;28:1009 –14
46. Horn PS, Pesce AJ.Reference intervals: an update.Clin Chim Acta2003; 334:5–23