Evaluating Various Quality Factors for Splitting Nodes in
Tree-Structured Spatial Indices
Esam Al-Nsour
Computer Science Department, King Abdulla II School for Information Technology “KASIT”
University of Jordan Amman, Jordan
Azzam Sleit
Computer Science Department, King Abdulla II School for Information Technology “KASIT”
University of Jordan Amman, Jordan
Mohammad Alshraideh
Computer Science Department, King Abdulla II School for Information Technology “KASIT”
University of Jordan Amman, Jordan
ABSTRACT
The massive increase of multi-dimensional (spatial) data collected, either in size or veracity, has demanded better spatial index techniques able to handle efficient storing and fast retrieval of spatial objects. No matter how big the data are, eventually it will reside on physical storage media arranged as a series of logical blocks with prefixed sizes resembling nodes in tree-structured spatial indices. Good node splitting strategy is essential since it affects; the final shape of the index, the overlap area between nodes, and the overall index performance. Better node splitting process results will be obtained if multiple splitting strategies (quality factors) were combined to govern the split decision, and it will eliminate the need for dynamic or static tree packing.
Three widely used quality factors; minimizing total overlap area, even distribution of objects, and squared nodes’ margins, along with a fourth factor named the “preferred-axis” were merged in one combined value to govern the split decision. Provided results, for the index creation tests and different sized window queries performance, indicate the superiority of the combined quality factors strategy in comparison of other unilateral usage of quality factors. Provided results showed that combined quality-factors strategy had outperformed different two strategies found in the literature in both index creation tests and index performance tests. The obtained results were achieved without the need for any dynamic or static tree packing.
General Terms
Algorithms, spatial indexes, node splitting, R trees.
Keywords
Splitting strategies, combined node splitting quality factors, Objects classification, Spatial big data.
1.
INTRODUCTION
The insisting need for proper storing and fast retrieval of spatial – multidimensional – objects made spatial data indices of great importance [1, 2]. Spatial data collected, which are increasing in size and veracity [3, 4], demanded better spatial index techniques able to handle efficient storing and fast retrieval of spatial objects [5, 6].
In the literature, different types of spatial indices were proposed that can deal with multidimensional data and preserve the objects’ spatial properties [7-9], one of the widely accepted among these is the R-tree spatial-data index [10] proposed by Guttman in 1980 [11]. R-tree index is a tree data structure that stores spatial objects using its minimum bounding rectangle (MBR) in leaf nodes which resemble disk pages. Tree nodes (Disk pages) have a limited storage
capacity; it can hold up to a certain amount of spatial objects (Data). If a leaf node becomes full and an additional object(s) need to be added to it, then this node should be split, splits may propagate up to the tree root.
Good node splitting strategy is fundamental; it affects the final shape of the index, the overlap area between nodes, and the overall performance of the index [12]. In the search for suitable splitting strategies, a vast amount of research was proposed in the literature. In general, they were designed to; reduce overlap area between tree nodes [11], getting more even distribution of objects among nodes [12], and having more squared nodes shapes [13]. These strategies are referred to as the node splitting quality factors. Up to our best knowledge, in all the research proposed only one quality factor is governing the tree nodes splitting process at a time. Even when a different quality factor is used for splitting different levels of the tree as the case of the R*-tree, or when an alternative quality factor is used to break ties in the adopted quality factor computed values. We haven’t encountered any situation where two or more quality factors values were combined, and its combination is governing the split process.
This work introduces: (1) A naming convention for node regions of two-dimensional nodes case. How spatial objects of a node are classified according to node’s regions. The use of objects classification as a quality factor (preferred-axis quality factor) to govern node splitting process, and performance tests of this quality factor. (2) A formula to combine four different quality factors; the three quality factors used in the literature and the preferred-axis quality factor, along with a percentage weight given for each quality factor to control its participation rate in the final result. Introduce the combination of weights assigned to the quality factors that produced the best results during index creation and query performance tests.
1.1.
Naming convention
In a node of any dimension, drawing lines at the center of each axis will produce distinct regions, four regions in the case of 2-d nodes, eight regions for 3-d nodes, and so on. Each region is given a unique name. For example, the four regions of a 2-d node naming convention are: The Higher-Left region (RHL), the Higher-Right region (RHR), the Lower-Left
region (RLL), and the Lower-Right region (RLR), all regions
meet at the node center (Xcen, Ycen). A graphical
Fig 1: Node’s regions naming convention for a 2-d node.
1.2.
Objects classification
Objects belonging to a node can be classified according to the node’s regions that they spanned in. In the case of a 2-d node any object is enclosed in a minimum bounding rectangle (MBR), the MBR has two points; the lowest point with (Xlow,
Ylow) coordinated, and the highest point with (Xhigh, Yhigh)
coordinated. There are only three possibilities for the object
located inside the node: an object is located in only one region, spanned in two regions, or spanned in four regions [9]. Supposing that the node is to be split at the center of one of its main axes along the other axis then the possible overlap imposed by each object according to its classification can be predicted. In general; any object which is resided entirely in only one region will not impose any overlap whatever the chosen split axis is. Objects that are spanned in two regions will just impose overlap if the chosen split axis is the one opposite to its longest side. Objects that are traversed in four regions will impose overlap on either axis selected, and for this case it can only predict which split axis will impose less overlap [15].
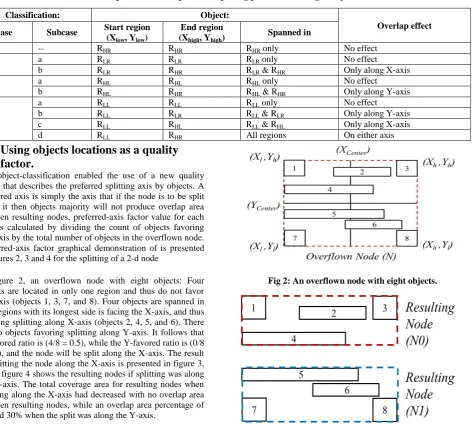
[image:2.595.75.549.317.743.2]Table 1 presents a summary of the classification cases (object start region), classification subcases (object end region), the object is spanned in which regions, along with the possible overlap effect according to objects locations [14].
Table 1. Possible produced overlap in node-splitting process according to objects locations
Classification: Object:
Overlap effect
Case Subcase Start region
(Xlow, Ylow)
End region (Xhigh, Yhigh)
Spanned in
1 -- RHR RHR RHR only No effect
2 a RLR RLR RLR only No effect
b RLR RHR RLR & RHR Only along X-axis
3 a RHL RHL RHL only No effect
b RHL RHR RHL & RHR Only along Y-axis
4
a RLL RLL RLL only No effect
b RLL RLR RLL & RLR Only along Y-axis
c RLL RHL RLL & RHL Only along X-axis
d RLL RHR All regions On either axis
1.3.
Using objects locations as a quality
factor.
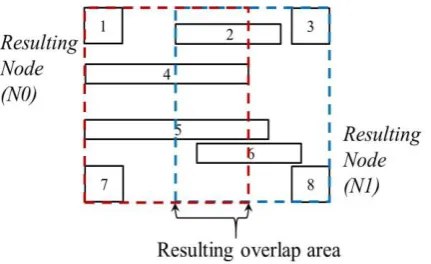
The object-classification enabled the use of a new quality factor that describes the preferred splitting axis by objects. A preferred axis is simply the axis that if the node is to be split along it then objects majority will not produce overlap area between resulting nodes, preferred-axis factor value for each axis is calculated by dividing the count of objects favoring that axis by the total number of objects in the overflown node. Preferred-axis factor graphical demonstration of is presented in figures 2, 3 and 4 for the splitting of a 2-d node
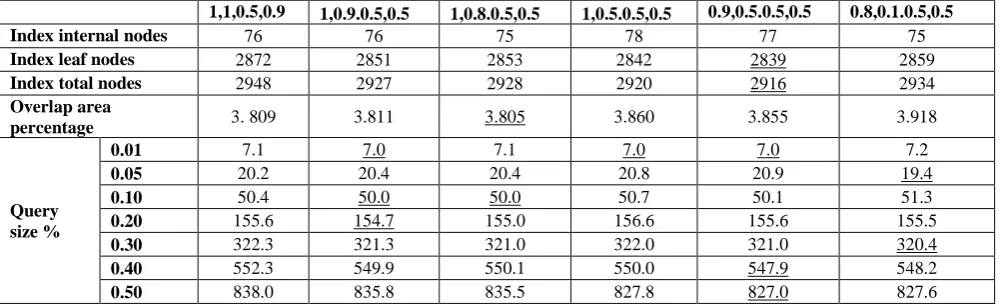
In figure 2, an overflown node with eight objects: Four objects are located in only one region and thus do not favor any axis (objects 1, 3, 7, and 8). Four objects are spanned in two regions with its longest side is facing the X-axis, and thus favoring splitting along X-axis (objects 2, 4, 5, and 6). There are no objects favoring splitting along Y-axis. It follows that X-favored ratio is (4/8 = 0.5), while the Y-favored ratio is (0/8 = 0.0), and the node will be split along the X-axis. The result of splitting the node along the X-axis is presented in figure 3, while figure 4 shows the resulting nodes if splitting was along the Y-axis. The total coverage area for resulting nodes when splitting along the X-axis had decreased with no overlap area between resulting nodes, while an overlap area percentage of around 30% when the split was along the Y-axis.
Fig 2: An overflown node with eight objects. Lower Left Region
(RLL) Higher Left Region
(RHL)
Higher Right Region (RHR)
Lower Right Region (RLR)
(Xh, Yh)
(XL, YL) (XL, Yh)
(Xh, YL) (XCentre)
(YCentre)
Fig 4: The two resulting nodes with the overlap area between resulting nodes when splitting along Y-axis.
To investigate the performance of the index built by the preferred-axis quality factor, tests were performed against two other algorithms; the original R-tree quadratic splitting algorithm (Quad), and the CBS linear algorithm. Each of the three algorithms was used to build an index using 100,000 uniformly distributed objects with different sizes. Maximum object size is 0.01 of the world space, generated by a C++ random generator, nodes maximum fill (Max fill) constraint was set to 50 objects, nodes minimum fill (Min fill) restriction was set to Max/4 objects.
Results of index creation tests by each algorithm are listed in table 2. The table shows that the new splitting quality factor has produced the least number of internal, leaf, and total index tree nodes. Furthermore, it has the least amount of overlap area percentage between resulting nodes when splitting (best results are underlined).
Table 2. Results of index creation tests by the Quad, CBS, and Preferred-axis algorithms using Uniform data file
with 100,000 MBRs, minimum fill = Max/4.
Index nodes
count Quad Alg. CBS Alg.
Preferred-axis Alg.
Internal 102 90 79
Leaf 3227 2902 2896
Total 3329 2992 2975
Overlap area % 6.95% 5.59% 3.93%
[image:3.595.312.545.107.190.2]For further investigating properties of the preferred-axis quality factor, performance tests were conducted over the indices produced by each algorithm with same settings using uniformly distributed window queries of different sizes; window sizes were (0.01, 0.05, 0.10, 0.20, 0.30, 0.40, 0.50) of the world size. For each window size, ten random-generated window queries of the same size were invoked, query results resemble the count of disk accesses needed to fulfill the query, and the average of these ten queries is recorded for each query size in table 3, along with the performance gain percentage. The table shows a performance gain percentage between 10% up to 20% for the preferred-axis quality factor algorithm against the Quad algorithm (1- (Preferred-axis / Quad)). A performance gain percentage between 2% up to 27% for the preferred-axis quality factor algorithm against the CBS algorithm (1- (Preferred-axis / CBS)). Figure 5 shows the performance gain percentage of the preferred-axis algorithm against the Quad algorithm and the CBS algorithm, performance gain is the highest at small query sizes and start to decrease during query size is increasing.
Table 3. Results of index performance tests by the Quad, CBS, and Preferred-axis algorithms using Uniform data file with 100,000 MBRs
Widow size Preferred-axis Alg. Quad Alg. Performance gain over
Quad Alg. CBS Alg.
Performance gain over CBS Alg.
0.01 6.5 8.1 19.75% 8.9 26.97%
0.05 21.2 24.3 12.76% 23.5 9.79%
0.10 51.5 60.4 14.74% 60.7 15.16%
0.20 156.5 180.9 13.49% 169.2 7.51%
0.30 331.8 373.4 11.14% 349.7 5.12%
0.40 559.0 628.7 11.09% 586.0 4.61%
0.50 845.9 947.5 10.72% 863.8 2.07%
2.
FORMULA TO COMBINE QUALITY
FACTORS
In the search for getting better results, the next step was to combine the Preferred-axis splitting quality factor with well-known three quality factors, namely: overlap area percentage, even distribution of objects, and squared margins. The four factors are to be used in one splitting algorithm altogether to determine the best split possible of an overflown node along one of its main axes. For each main axis, each quality factor
[image:3.595.49.550.460.569.2]Fig 5: The performance gain percentage of the preferred-axis algorithm against Quad algorithm and CBS
algorithm for different query sizes.
The notation (1, 1, 1, 1) is used to represent the order of weights given to quality factors (overlap, preferred-axis, even distribution, and squared margin), the weight value assigned
to each factor can range between 0% (0.0) and 100% (1.0). In the following tests; Uniform data file was used in creating the index, nodes maximum fill are set to 50 objects, and nodes minimum fill is Max/4 objects. Each window size recorded result is the average of 10 random generated window queries. First tests were conducted using only one quality factor weight set to 1 (100%) while all other three quality factors weights set to zero (0%) of the same size, results are shown in table 4, the best result for each row is underlined.
All Factors Normalized For X-axis =
((Normalized Value of Factor_1 for X-axis * Factor_1 Weight) +
(Normalized Value of Factor_2 for X-axis * Factor_2 Weight) +
(Normalized Value of Factor_3 for X-axis * Factor_3 Weight) +
(Normalized Value of Factor_4 for X-axis *
[image:4.595.46.549.337.510.2]Factor_4 Weight)) --- (1)
Table 4, Results of index creation and performance tests by the combined quality factors splitting algorithm when setting only one factor to 100%
1,0,0,0 0,1,0,0 0,0,1,0 0,0,0,1
Index nodes count
Internal 75 79 88 87
Leaf 2903 2896 2900 2904
Total 2978 2975 2988 2991
Overlap area % 3.86% 3.93% 5.32% 4.11%
Query size %
0.01 6.9 6.5 9.9 6.5
0.05 19.6 21.2 27.0 19.7
0.10 51.3 51.5 57.2 51.0
0.20 157.6 156.5 167.1 159.4
0.30 329.0 331.8 343.9 335.2
0.40
563.1 559.0 586.4 563.3
0.50
856.0 845.9 877.0 855.1
The best results were changing between the different combinations, although the combination (0, 0, 1, 0) didn’t get any best result, it got the second best result in leaf nodes count.
Next, tests were conducted using the same settings with only two quality factors weights set to 1 (100%) and the other two quality factors weights set to zero (0%), the results are shown in table 5. best result for each row is underlined.
Table 5, Results of index creation and performance tests by the combined quality factors splitting algorithm when setting only two factors weights to 100%.
1,1,0,0 1,0,1,0 1,0,0,1 0,1,1,0 0,1,0,1 0,0,1,1
Index internal nodes 77 80 75 85 72 78
Index leaf nodes 2895 2882 2880 2874 2883 2862
Index total nodes 2972 2962 2955 2959 2955 2940
Overlap area percentage 3.83 4.19 3.92 4.27 3.99 4.51
Query size %
0.01 7.0 6.8 6.6 7.8 6.6 6.9
0.05 20.3 21.3 20.2 21.3 20.8 20.6
0.10 53.0 54.0 50.1 56.0 50.8 50.9
0.20 158.5 159.8 155.5 159.4 153.9 157.6
0.30 330.1 328.1 322.4 331.0 322.6 328.2
[image:4.595.45.554.589.745.2]The combination (1,1,0,0) got the least overlap ratio, and the most of best results for the window query were for the combination (1,0,0,1).
Next, tests were conducted using the same settings while setting three quality factors weights to 1 (100%) and only one quality factor weight set to zero (0%), results are shown in table 6 including the last case where all four weights are set to 100%.
From the fourth, fifth, and sixth tables, it can noticed that in index creation tests; the least index internal nodes resulted from the combination (0,1,0,1), the least index leaf nodes and
[image:5.595.50.549.237.381.2]the least index total nodes resulted from the combination (0,1,1,1), and the least overlap ratio resulted from the combination (1,1,0,0). In index query performance tests, it is noticed that in small query sizes the best performance for the size 0.01 was for the combinations (0,0,0,1) and (0,1,0,0), for query size 0.05 the best performance was for the combination (1,0,0,0), for query size 0.20 the best performance was for the combination (0,1,0,1), and for all other query sizes (0.10, 0.30, 0.40, 0.50) the best performance was for the combination (1,1,0,1).
Table 6, Results of index creation and performance tests by the combined quality factors splitting algorithm when setting three factors weight to 100%.
1,1,1,0 1,0,1,1 1,1,0,1 0,1,1,1 1,1,1,1
Internal nodes 81 77 74 76 79
Leaf nodes 2886 2868 2868 2841 2849
Total nodes 2967 2945 2942 2917 2928
Overlap area % 3.91 3.99 3.88 4.11 3.89
Query size %
0.01 7.8 7.2 6.8 6.8 7.0
0.05 20.5 20.3 19.9 21.3 21.3
0.10 52.6 52.8 49.2 52.3 51.1
0.20 158.7 154.8 154.0 155.7 156.5
0.30 326.8 323.7 321.0 322.5 325.2
0.40 559.2 553.9 544.5 552.4 550.8
0.50 846.4 840.2 829.2 832.5 829.8
From the previous tests, it can be observed that each factor has a good influence on some cases and a bad influence on some other cases. For having the best results possible, unequal weights for the factors were applied; and several tests were conducted using weights ranging between 0% and 100%. After performing many experiments, better results are observed possible if using different weights for each factor.
[image:5.595.49.550.488.641.2]The quality factors weights combinations listed in table 7 as an example of weights combinations which had shown better results in one or more criteria used, the best results in most tests criteria were seen when the combination (0.9,0.5,0.5,0.5) was used.
Table 7, Results of index creation and performance tests by the combined quality factors splitting algorithm when setting three factors weight to 100%.
1,1,0.5,0.9 1,0.9.0.5,0.5 1,0.8.0.5,0.5 1,0.5.0.5,0.5 0.9,0.5.0.5,0.5 0.8,0.1.0.5,0.5
Index internal nodes 76 76 75 78 77 75
Index leaf nodes 2872 2851 2853 2842 2839 2859
Index total nodes 2948 2927 2928 2920 2916 2934
Overlap area
percentage 3. 809 3.811 3.805 3.860 3.855 3.918
Query size %
0.01 7.1 7.0 7.1 7.0 7.0 7.2
0.05 20.2 20.4 20.4 20.8 20.9 19.4
0.10 50.4 50.0 50.0 50.7 50.1 51.3
0.20 155.6 154.7 155.0 156.6 155.6 155.5
0.30 322.3 321.3 321.0 322.0 321.0 320.4
0.40 552.3 549.9 550.1 550.0 547.9 548.2
0.50 838.0 835.8 835.5 827.8 827.0 827.6
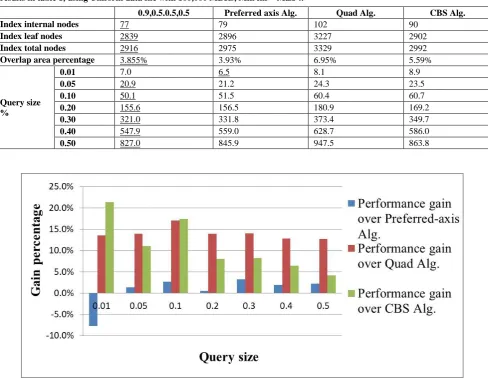
By comparing the (0.9,0.5.0.5,0.5) combination results with the results of table 2, it showed better improvement in almost all comparison criteria; the comparison is presented in table 8. In index creation tests, the combined quality factors algorithm has got the least count of index internal, leaf, and total nodes. Also, it has the least amount of overlap ratio between nods. In index performance tests; the better performance was achieved except for the query size 0.01 against the Preferred-axis algorithm which was decreased by 7.7%; this result can be attributed to the good performance of the Preferred-axis algorithm in very small sized window queries. For all other query sizes, the performance gain was improving especially
for large-sized queries, for example, the performance increase has doubled its value against the CBS algorithm for query size 0.5.
This improvement proofs that having multiple splitting quality factors working together will get better results in both index creation criteria and index overall performance tests.
Table 8, Results of index creation and performance tests by the combined quality factors splitting algorithm compared to results in table 1, using Uniform data file with 100,000 MBRs, Min fill = Max/4.
0.9,0.5.0.5,0.5 Preferred axis Alg. Quad Alg. CBS Alg.
Index internal nodes 77 79 102 90
Index leaf nodes 2839 2896 3227 2902
Index total nodes 2916 2975 3329 2992
Overlap area percentage 3.855% 3.93% 6.95% 5.59%
Query size %
0.01 7.0 6.5 8.1 8.9
0.05 20.9 21.2 24.3 23.5
0.10 50.1 51.5 60.4 60.7
0.20 155.6 156.5 180.9 169.2
0.30 321.0 331.8 373.4 349.7
0.40 547.9 559.0 628.7 586.0
0.50 827.0 845.9 947.5 863.8
Fig 6: The performance gain percentage of the combined quality factors algorithm using the combination (0.9,0.5.0.5,0.5) against preferred-axis algorithm, Quad algorithm, and CBS algorithm for different query sizes.
3.
CONCLUSION
Physical distribution of spatial objects inside node regions - its locations - is used to classify these objects, objects classification is implemented as a strategy (i.e., quality factor) to govern the node splitting process. Performance tests for this splitting quality factor against other well-known splitting strategies have proven its superiority in both index creation and data retrieval tests. Moreover, investigation was conducted for the possibility of getting better results if multiple quality factors were combined in a single value to govern the split decision, combining was made by normalizing each quality factor value into the range [0..1], and the sum of all normalized values was used to decide the split axis, tests showed improved results. Furthermore, investigation of the possibility of having better results if different weights were assigned for the quality factors to specify the amount of factor participation in the final value. Many tests were performed while varying each quality factor weight between 0% and 100%, the combination of weights that showed the best results were: 90% for area overlap, 50%
superiority of the combined quality factors strategy in comparison of unilateral usage of quality factors.
Future research will try to investigate the graphical representation of index nodes produced by spatial indexes to show how nodes are organized and distributed in the space visually, how nodes are shaped, and the intersection areas (overlap) between nodes.
4.
REFERENCES
[1] Zou Z, Wang Y, Cao K, Qu T, Wang Z. Semantic overlay network for large-scale spatial information indexing. Computers & geosciences. 2013 Aug 31;57:208-17
[2] A Sleit, M Al-Akhras, I Juma, M Ali, Applying ordinal association rules for cleansing data with missing values, Journal of American Science 5 (3), 52-62, 2009
[image:6.595.54.543.94.473.2]RECENT ADVANCES in APPLIED MATHEMATICS, 565-569, 2010.
[5] A Sleit, W AlMobaideen, AH Baarah, AH Abusitta, An efficient pattern matching algorithm, Journal of Applied Sciences 7 (18), 2691-2695, 2007
[6] W Almobaideen, R Al-Soub, A Sleit, MSDM: Maximally spatial disjoint multipath routing protocol for manet, Communications and Network 5 (04), 316, 2013 [7] Sahr, K. and White, D., 1998. Discrete global grid
systems. Computing Science and Statistics, pp.269-278. [8] Samet, H., 1984. The quadtree and related hierarchical
data structures. ACM Computing Surveys (CSUR), 16(2), pp.187-260.
[9] Morton, G. M. (1966), A computer Oriented Geodetic Data Base; and a New Technique in File Sequencing, Technical Report, Ottawa, Canada: IBM Ltd.
[10]Manolopoulos Y, Nanopoulos A, Papadopoulos A, Theodoridis Y. R-trees: Theory& Applications. Springer Sci.&Business Media; 2010Sep8.
[11] Guttman, A. R-Trees, a Dynamic Index Structure for Spatial Searching. Proceedings of ACM SIGMOD Conference 1984; 47-57.
[12] Sleit A, Al-Nsour E. Corner-based splitting: An improved node splitting algorithm for R-tree. Journal of Information Science. 2014 Apr; 40(2):222-36.
[13] Beckmann N, Kriegel HP, Schneider R, Seeger B. The R*-tree: an efficient and robust access method for points and rectangles. In: Acm Sigmod Record, 1990 May 1 (Vol. 19, No. 2, pp. 322-331). ACM.
[14] Al-Nsour, E., Sleit, A., and Alshraideh, M., 2017, December. R-tree node-splitting algorithm using combined quality factors and weights (CSCI), 2017 International Conference on (in press). IEEE.