RESEARCH ARTICLE
CLASSIFICATION OF POWER DISTURBANCES USING MULTILEVEL SUPPORT VECTOR MACHINE
M. Janani
1*, S. Shipra
2, S. Karthikeyan
3, S. Muralidharan
4, B. Sathyabama
51,2,3,4
Department of Mechanical Engineering, Thiagarajar College of Engineering, Madurai, India
5Department of Electronics and Communication Engineering, Thiagarajar College of Engineering, Madurai, India
ARTICLE INFO ABSTRACT
This paper proposes a new approach for the classification of the power system disturbances using Wavelet-Multi resolution Decomposition and multi-level Support Vector Machine (SVM).The proposed approach is carried out at different serial stages. First, the original signal is decomposed in to the different level using the wavelet multi-resolution analysis (MRA). This decomposed signal is used to find the energy distribution of the wave. Next, the energy feature is used as input vector for training the SVM classifier. The appropriate input feature is used for classify the PQ event using SVM classifier. Multi-Level SVM technique is used to classify Power disturbances. Hence, Power disturbances are detected and classified with higher efficiency.
Copyright, IJCR, 2013, Academic Journals. All rights reserved.
INTRODUCTION
Power-quality (PQ) monitoring is an essential service that many utilities perform for their industrial and larger commercial customers. Detecting and classifying the different electrical disturbances which can cause PQ problems is a difficult task that requires a high level of engineering knowledge. Power quality (PQ) is the set of limits of electrical properties that allows electrical systems to function in their intended manner without significant loss of performance or life. PQ problems are caused by the power line disturbances and non linear load in the system. Common power quality disturbances are surges, spikes and sags in power source voltage, and harmonics on the power line. In order to improve the power quality of the system, the above events have to be identified and appropriate mitigating actions have to be taken. In the modernized world, Electric power systems have become polluted with unwanted fluctuation in the voltage and current signal. PQ issues [1] are primarily due to continually increasing sources of disturbances that occur in interconnected power grids, which contain large numbers of generators, transmission lines, transformers and switching loads. In addition, such systems are exposed to environmental disturbances like lighting effect. Furthermore, nonlinear power electronic loads such as converter driven equipment have become increasingly common in power system. Poor power quality [2&3] is attributed due to the various power line disturbances. In brief, PQ problems can cause system equipment malfunction; computer data loss and memory malfunction of sensitive loads such as computer, programmable logic controller controls, protection and relaying equipment; and erratic operation of electronic controls [4]. Therefore, it is necessary to monitor these disturbances. Continuous monitoring is required because of the increasing demand of clean power as suggested in [5–7] and monitoring standards are also given in [8]. Since, disturbances occur in very short time (µsec), in order to record the event, the system need a huge amount of storage. As a result, the volume of the recorded data increases significantly, necessitating the development of an efficient
*Corresponding author:M. Janani
Department of Mechanical Engineering, Thiagarajar College of Engineering, Madurai, India
technique to compress the data volume. Monitoring has significant implications in the area of PQ [9]. The volume of the data to be recorded and examined is prohibitively large, if all the waveform is to be saved into the instrument or a computer. Advancement in PQ monitoring and data compression has received the well attention from those involved in the field [10]. If these unwanted variations in the voltage and current signal are not mitigated properly. They can lead to failures or malfunctions in the connected load or sensitive equipment in the system. This kind of mitigation action is very costlier for the end user and consumer. It is necessary to identify the event with the PQ event detection and classification system so that accordingly mitigation action can be carried out. So, PQ analysis is becoming the most interesting area of research in past several years for characterization [14&15] and classification of events [16]. For the classification of PQ events, feature extraction and classification are the most important part of the generalized PQ event classification system.
Recently, the synergy with the feature extraction techniques of artificial neural networks (ANNs), support vector machines (SVMs) and the other computational intelligence techniques have become
popular for solving the problem about the power systems. Mo et al.
[17] demonstrated how to extract the features from the wavelet transform coefficients at different scales as inputs, to neural networks
for classifying the nonstationary signal type. Elmitwally et al. [18]
used the preprocessed DWT coefficients as inputs to arefined
neuro-fuzzy network to train and classify the power system disturbance
type. As seen in the above studies, the DWT technology has often been employed to capture the time of transient occurrence and extract frequency features of power disturbance. Integrating the DWT technology with the artificial intelligence method or expert system to become a practical power disturbance classifier for recognizing accurately the disturbance has attracted much research interest. However, two practical problems must be overcome in the above methods.
Adopting directly the DWT coefficients as inputs to the neural
networks requires large memory space and much learning time.
ISSN: 0975-833X
International Journal of Current Research
Vol. 5, Issue, 07, pp.1779-1783, July,2013
INTERNATIONAL JOURNAL
OF CURRENT RESEARCH
Article History: Received 16th
April, 2013 Received in revised form 21th May, 2013 Accepted 18th
June, 2013 Published online 18th
July, 2013
Key words:
The decomposition level with the number of extraction features must be reduced to enhance computing efficiency and accuracy of recognizing the disturbance type.
This paper presents the classifier which is used to classify the event with the support vector machines (SVM).
PROPOSED METHODOLOGY
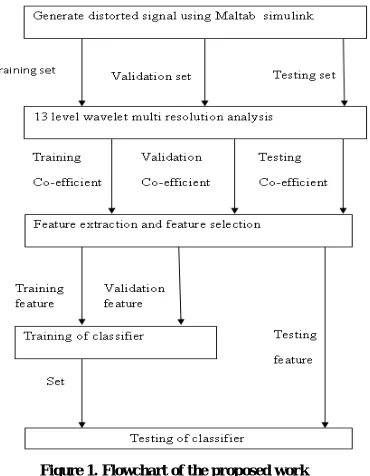
[image:2.612.92.277.261.499.2]In this paper, an effective classification algorithm based on WT and SVM is proposed for identifying power quality disturbances. To build an effective classification algorithm, it is essential to choose robust and adequate features that can recognize the main characteristics of signal and reduce its data size. In this schema, first, the features are obtained by different extraction techniques applied to the wavelet coefficients of all decomposition levels of the disturbance signal. Then the classification is performed with help of the energy features of the wave. Robust and adequate features are selected in feature set which is obtained from first stage. The experimental results showed that the proposed algorithm could classify with high accuracy.
Figure 1. Flowchart of the proposed work
WAVELET TRANSFORM
The wavelet analysis block transforms the distorted signal into different time-frequency scales. The wavelet transform (WT) uses the wavelet function and scaling function to perform simultaneously the Multi Resolution Analysis (MRA) decomposition and reconstruction of the measured signal. The wavelet function will generate the detailed version (high-frequency components) of the decomposed signal and the scaling function will generate the approximated version (low-frequency components) of the decomposed signal. The wavelet transform is a well-suited tool for analyzing high-frequency transients in the presence of low-frequency components such as non-stationary and non-periodic wideband signals [19].
Multi resolution Analysis (MRA) and Decomposition
At first main characteristic in WT is the MRA technique that can decompose the original signal into several other signals with different levels (scales) of resolution. From these decomposed signals, the original time-domain signal can be recovered without losing any information.
The recursive mathematical representation of the MRA is as follows:
Vj==Wj+1 Vj+1 = Wj+1 Wj+2 ··· Wj+n Vn (1)
where
Vj+1 approximated version of the given signal at scale j+1;
Wj+1 detailed version that displays all transient phenomena of the
given signal at Scale j +1 ;
denotes a summation of two decomposed signals; n is the decomposition level.
Mathematical model of WT
The wavelet function and scaling function must be defined before perform the Wavelet analysis. Wavelet function act as highpass filter and generate the detailed and distorted signal, while the scaling function can generate the approximated version of the distorted signal. In general[25],
Øj,n [t]=2j/2 Ʃ cj,n ø [ 2j t- n] (2)
φ j,n [t]=2j/2 Ʃ dj,n ø [ 2j t- n] (3)
where Cj is the scaling coefficient at scale j , and dj is the wavelet
coefficient at scale j. Simultaneously, the two functions must be orthonormal and satisfy the properties as follows:
< Ø. Ø > = 1/2j
< φ . φ > = 1/2j
(4)
< Ø . φ > = 0
Assume the original signal xj[t] at scale j is sampled at constant time
intervals and xj[t]=(v0,v1,v2,…,vn-1),, sampling number is N=2j . (j is
a integer number).
DWT mathematical recursive equation[25] is presented as follows:
DWT (xj[t])= Ʃ xj[t] Øj,k[t]
=2(j+1)/2) (Ʃ u
j+1,n Ø[2j+1t-n]+ Ʃ wj+1,nφ [2j+1t-n] ) (5)
Where
uj+1,n = Ʃcj,kvj,k+2n, 0 ≤ k ≤ (N/2j)-1 (6)
wj+1,n = Ʃcj,kvj,k+2n, 0 ≤ k ≤ (N/2j)-1 (7)
dk =(-1)kc2p-1-k,p=N/2j (8)
where,
uj+1,n is the approximated version at scale j+1,wj+1,n is the detailed
version at scale j+1, and j is the translation coefficient. Fig. 2
illustrates the three decomposed/reconstructed levels of the DWT algorithm.
[image:2.612.328.535.595.723.2]
There are many wavelet functions named as mother wavelets. The choice of mother wavelet is important because different types of mother wavelets have different properties. Several popular wavelet functions are Haar, Morlet, Coiflet, Symlet and Daubechies wavelets. Daubechies wavelets are also well known and widely used in other applications. It is flexible as its order can be controlled to suit specific requirements. Among the different dbN (N-order) wavelets, db4 is the most widely adopted wavelet in power quality applications [20]. The MRA decomposes the original signal into several other signals with different levels of resolution by means of high-pass filters (HP) and low-pass filters (LP) [21].
FEATURE EXTRACTION
The detail coefficients and approximation coefficients are not directly used as the classifier inputs. In order to reduce the feature dimension, the feature extraction methods are generally implemented to these coefficients at each decomposition level. All of the features LIKE mean, standard deviation, skewness, kurtosis, RMS, form factor, crest-factor, energy, Shannon-entropy and log-energy entropy given
in Table 1 [25]. Certain methods were individually applied to the
detail coefficients of each level and the approximation coefficients at 13th level and the features were firstly extracted. Then the obtained features by using each feature extractor were as under scaled to be having the same mean and standard deviation.
Table 1: Formulations of feature extraction techniques.
The energy feature extracted is to train the SVM for classifying the power quality disturbances.
CLASSIFICATION OF PQ EVENTS
To verify the feasibility of the proposed method, we used the Power System Block set Toolbox in Mat lab to generate one pure sine-wave signal (frequency = 50 Hz, amplitude = 1 p.u.) and six sample transient distorted signals. These distorted signals included capacitor
switching, voltage sag/swell, harmonic distortion, and flicker. The sampling rate of the system is points/per cycle. The Daubanchie “db4”with level 13 wavelet was adopted to perform the DWT. Certain features are extracted based on the formulations shown in Table 1. The can directly used for the classification which will give the best results compare to the traditional techniques. Each feature has some own domination. In this paper we consider the eighth feature energy distribution in the signal. The value of the energy distribution is different for the different event. The energy distribution of each disturbance which is the dominant feature is used to train the Support Vector Machine for classifying the events accordingly.
SIMULATION RESULTS
The different events are created using the mat lab simulink tool by creating the event generation model. The PQ events sag, swell, harmonics and outages are generated by changing the signal builder block and/or adding the high frequency sine wave to the original wave. Various power disturbances are generated using the above shown block diagram. Generated waves and its energy distribution are shown below.
Fig: 3(b): Sine wave with voltage sag and its energy distribution diagram
Fig: 3(c): Sine wave with voltage swell and its energy distribution diagram
Fig. 3a shows the pure sine wave energy distribution diagram and b, c shows the sine wave affected with the voltage sag and swell respectively. Same way we can classify the high frequency
events(/harmonics)using the 2,3 and 4th level and low frequency
events(flickering and capacitor switching) can classify using the 9,10
and 11th level of the energy distribution.
Fig 4(a) Energy distribution diagram for harmonic wave
Fig 4(a) Energy distribution diagram for flickering
Fig 4(a) Energy distribution diagram for capacitor switching
Using the energy distribution value, individual SVM classifier is needed to classify the all events completely.
SUPPORT VECTOR MACHINE FOR CLASSIFICATION
Support Vector Machine (SVM) is a modern computational learning
method based on statistical learning theory presented by Vapnik [22]
and specializes for a smaller number of samples for training. Multi-level SVM is developed from the optimal separating plane. Its basic principle can be illustrated in three-dimensional way in our method the features are selected from the SFS technique. High Euclidean value gives the wide range of deviation value, and it will give the best results for the PQ events. Result obtained using SVM is shown in Figure 5.
Figure 5. Classification of power disturbances using SVM
7.5
8 8.5
9 9.5
10
40 45 50 55 50 55 60 65 70
6th energy level Multi-dimensional classification of energy level
7 th energy level
8
th
e
n
e
rg
y
l
e
v
e
Conclusion
This paper proposed a prototype of wavelet-based support vector machine classifiers for power disturbance recognition and classification. The proposed method can reduce the quantity of extracted features of distorted signal without losing its property, thus requiring less memory space and computing time for proper classification of disturbance types. The experimental results showed that the proposed method has the ability of recognizing and classifying different power disturbance types efficiently. This paper mainly focuses the event classification but event classification with amount of compensation will improve the proposed method and this will be one of our future works.
REFERENCES
[1] Hunter I. Power quality issues – a distribution company
perspective. Power Engineering Journal 2001; 15(2):75–80.
[2] Bollen MHJ. What is power quality? Electric Power Systems
Research 2003; 66(1):5–14.
[3] Bollen MHJ, Styvaktakis E, Gu IYH. Categorization and
analysis of power system transients. IEEE Transactions on Power Delivery 2005;20(3):2298–306.
[4] Thapar A, Saha TK, Dong ZY. Investigation of power quality
categorisation and simulating it’s impact on sensitive electronic equipment. IEEE Power Engineering Society General Meeting 2004;1:528–33.
[5] Khan AK. Monitoring power for the future. Power
Engineering Journal 2001; 15(2):81–5.
[6] Gaouda AM, Salama MMA, Sultan MR, Chikhani AY.
Application of multi resolution signal decomposition for monitoring short-duration variations in distribution systems. IEEE Transactions on Power Delivery 2000; 15(2):478–85.
[7] Ouyang S, Wang J. A new morphology method for enhancing
power quality monitoring system. International Journal of Electrical Power and Energy Systems 2007; 29(2):121–8.
[8] IEEE, Recommended practice for monitoring electric power
quality, 2009.
[9] Kandil MS, Farghal SA, Elmitwally A. Refined power quality
indices. IEE Proceedings on Generation of Transmission & Distribution 2001; 148(6):590–6.
[10] Lin T, Domijan Jr A. Real time measurement of power disturbances: part 1. Survey and a novel complex filter
approach. Electric Power Systems Research 2006;
76(12):1027–32
[11] Kezunovic M, Liao Y. A new method for classification and characterization of voltage sags. Electric Power Systems Research 2001; 58(1):27–35.
[12] Ignatova V, Granjon P, Bacha S. Space vector method for voltage dips and swells analysis. IEEE Transactions on Power Delivery 2009; 24(4):2054–61.
[13] Kucuk D, Salor O, Inan T, Cadirci I, Ermis M. Pqont: a domain ontology for electrical power quality. Advanced Engineering Informatics 2010; 24(1):84–95.
[14] Jaramillo SH, Heydt GT, O’Neill-Carrillo E. Power quality indices for aperiodic voltages and currents. IEEE Transactions on Power Delivery 2000; 15(2):784–90.
[15] Shaw SR, Laughman CR, Leeb SB, Lepard RF. A power quality prediction system. IEEE Transactions on Industrial Electronics 2000; 47(3):511–7.
[16] Barros J, Perez E. Automatic detection and analysis of voltage
events in power systems. IEEE Transactions on
Instrumentation & Measurment 2006; 55(5):1487–93. [17] F. Mo and W. Kinsner, “Wavelet modeling of transients in
power systems,” in Proc. Conf. Communications, Power and
Computing Proceedings, Winnipeg, MB, Canada, May 22–23,
1997, pp. 132–137.
[18] A. Elmitwally, S. Farghal, M. Kandil, S. Abdelkader, and M. Elkateb, “Proposed wavelet-neurofuzzy combined system for
power quality violations detection and diagnosis,” Proc. Inst.
Elect. Eng., Gen. Transm.Dist., vol. 148, no. 1, pp. 15–20,
Jan. 2001.
[19] S. Santoso, E. J. Powers, W. M. Grady, and P. Hofmann,
“Power quality assessment via wavelet transform analysis,”
IEEE Trans. Power Delivery, vol. 11, pp. 924–930, Apr. 1996.
[20] S. Chen, H.Y. Zhu, Wavelet transform for processing power quality disturbances, EURASIP J. Adv. Signal Process. 47695 (2007) 20.
[21] S.G. Mallat, A theory for multi resolution signal
decomposition: the wavelet representation, IEEE Trans. Pattern Anal. Mach. Intell. 11 (7) (1989) 674–693.
[22] V.N. Vapnik, The Nature of Statistical Learning Theory, Springer-Verlag, New York, 2000.
[23] A.M. Gaouda and M.M.A. Salaina ,” Power Quality Detection
and Classification Using Wavelet-Multi resolution Signal Decomposition” IEEE Transactions on Power Delivery, Vol. 14, No. 4, October 1999.
[24] Zwe-Lee Gaing, “Wavelet-Based Neural Network for Power
Disturbance Recognition and Classification”, IEEE
TRANSACTIONS ON POWER DELIVERY, VOL. 19, NO. 4, OCTOBER 2004
[25] Hüseyin Eris¸ ti,” Wavelet-based feature extraction and selection for classification of power system disturbances using support vector machines”, Electric Power Systems Research 80 (2010) 743–752
[26] Rajiv Kapoor,” Classification of power quality events – A review”, Electrical Power and Energy Systems 43 (2012) 11– 19