Studying the Inter-Relationship amongst the Barriers to
Implementation of Analytics in Manufacturing Supply
Chains
Bhoomica Aggarwal
HCL Technologies Private Limited, Sector 126, Noida, India
Remica Aggarwal
School of Business, University of Petroleum & Energy Studies,
Dehradun, India
S. P. Singh
Department of Management Studies, IIT, Delhi, India
ABSTRACT
With every economy becoming globalized , operations of global manufacturing and logistics teams are becoming complex and challenging . Delayed shipments, inefficient plants, inconsistent suppliers can stall and delay the shipments thereby increasing the company’s supply chain costs. Managing demand volatility and cost fluctuations in supply chain and making it visible globally are some of the challenges which supply chain managers are facing. As per Accenture report , only up to 17 % of the supply chain managers are comfortable implementing analytics to supply chain functions which means despite being a need for these supply chain managers and despite being the fact that analytics can serve as their problem solver , it cannot , and still has a long way to go to prove itself in this domain . The required foundation is still in its nascent stage . This research work thus focuses on studying and exploring the barriers to implementation of analytics or big data analytics to manufacturing supply chains . After exploring , it further study the interrelationship amongst them with the help of Interpretive Structural Modelling (ISM) methodology .
Keywords
Manufacturing ; supply chain operations ; supply chain analytics ; real time decision making
1.
INTRODUCTION
Supply chain usually comprise of an integrated system of organizations, people, activities, information and resources so as to deliver the semi-finished or finished product or service from supplier or manufacturer to customer1. With every economy becoming globalized and companies increasing their presence across countries, operations of global manufacturing and logistics teams are becoming complex and challenging. Delayed shipments, inefficient plants, inconsistent suppliers can stall and delay the shipments thereby increasing the company’s supply chain costs. Some of the major challenges that supply chain executives are facing today is to manage demand volatility and cost fluctuations in supply chain and to make the global supply chain and logistic processes visible in the global environment2. Thus, the inclination of present day industry towards using analytics cannot be ignored .
Analytics over time has evolved from being just descriptive to an advanced level of predictive and prescriptive states leading to optimized proactive decision making. As per the report by Markets and Markets, the global supply chain analytics market is expected to grow from USD 2.5 billion in 2014 to USD 4.8 billion by 2019, at 14.6% CAGR 2 . Thus , there is a great scope of using big data analytics (BDA) by manufacturing companies for achieving business success in the global market. In addition, due to advances in information and communication technology (ICT) such as
Web 2.0 and the internet of things (IoT), amount of data has also increased considerably [1-4]. Due to these advancements, there are many opportunities to develop BDA tools and apply big data techniques to manufacturing supply chains. Though the potential is huge, the widespread adoption of analytics have been curtailed by several barriers such as poor quality and unavailability of data, functional silos, unclear strategic fit, and rudimentary IT infrastructure to name a few3.
The paper focuses on establishing the interrelationship amongst the various barriers to successful implementation of big data analytics to manufacturing supply chains using the Interpretive Structural Modelling methodology (ISM) . The paper is arranged as follows : Section 2 presents the literature review in two sections . Section 2.1 presents the literature review on analytics and its applications particularly in supply chain. Section 2.2 presents the literature review on recognition of barriers to implementation of analytics to supply chains. Section 3 presents the interpretive structural modelling methodology . A Mic-mac analysis is conducted and an ISM model is prepared in section 4 . Conclusions and future directions are presented in section 5 .
2.
LITERATURE REVIEW
2.1
Literature review on conceptual
analysis of big data analytics in
manufacturing supply chains
manufacturing industry [19]; distributed supply chains using cloud computing[20] and smart cities [21] . [22] handles the systems big data real time analysis for manufacturing. Similarly, [23] studied the omni channel application of big data analytics to predict customer purchasing patterns. The big data repository design protocol to store different type of big data generated from IoT has been discussed by [24]. [25] presents the two tier analysis of unstructured data based on predictive analysis using big data and model optimization. Predictive analysis was done to analyze the customer demands based on their hits and browsing time and further analyzing the behavior of clients according to their location data . A multi-agent based system with big data processing for enhanced supply chain agility has been discussed by [26]. [14] discusses that the knowledge extracted from big data is used mostly in two domains . First one is the professional use i.e. learning , promoting and networking and second is the organisational use which include stakeholder engagement , hiring demand shaping , sales, market sensing and new product development and risk management. [1] develop a framework for supply chain resilence in the context of recovery from disaster. Unstructured big data was in the form of tweets , facebook comments etc. A survey questionnaire was developed followed by content analysis and confirmatory factor analysis . [27] collected the data from 161 US based companies and performed CFA on it and found that organizational level BDA use has impact on two types of supply chains : value creation asset productivity and business growth. Also, organizational readiness and environmental factors have an indirect influence on organizational BDA use through top management support . A large scale survey involving supply chain professionals on the costs and benefits of big data predictive analytics has been conducted by [28]. It was found by [29] that applying relevant and analytical techniques to unstructured and structured data can help firm identify areas of risks that may impact on the sustainability of supply chain. A survey of 230 truckers and big data analytics was used to predict arrival time of truckers at distribution centers and provides information on how to optimize logistics in terms of synchronization of coming and going cargo at distribution centers [30]. Three levers of big data i.e. velocity , volume and variety study has been performed by [31] and it was confirmed that these three levers reduces the bull whip effect of supply chains with velocity having the greatest impact.
2.2
Literature review on recognition of
barriers to implementation of analytics and
/ or big data analytics in supply chain
Keywords such as barriers to supply chain analytics , lack of big data infrastructure , barriers to big data analytics , supply chains and big data etc. were used to identify literature on BDA in various journal databases such as Science Direct, Scopus, Sci-Search, Emerald, Taylor & Francis, ISI web-of-science (WoS). As for example, qualitative analysis was performed by [7] to investigate barriers to big data analytics and its associated challenges in the South African telecommunications industry [10] , a conceptual framework to review articles relevant to the threats and opportunities of using BDA for international development has been performed by [32]. Critical analysis of big data challenges and available analytical methods has been performed by [33] . [34] prioritize the barriers to achieve sustainable consumption and production trends in supply chains using fuzzy Analytical Hierarchy Process. According to CAGR report though the
[image:2.595.309.548.270.770.2]been curtailed by several barriers: Poor quality and unavailability of data, functional silos, unclear strategic fit, and rudimentary IT infrastructure to name a few. [35] identified the barriers to supply chain analytics in four major categories viz technology related barriers which include lack of availability of specific data tools, lack of infrastructural facilities , lack of interest in implementing new technology ; data related barriers (which include complexity of data integration and data quality); investment related barriers (which include lack of funding, high cost of investment , lack of skilled IT personnel and lack of facilities to research) and organizational barriers ( which include lack of training facilities , time constraints and mindset in terms of big data) with respect to Bangladeshi manufacturing industry. The description and related authors have been mentioned in the table 1 below:
Table 1. Barriers to implementation of analytics in manufacturing supply chains
S.no. Barrier Description Author
1. Lack of
availability of specific data
tools (LAT)
In manufacturing facility , lack of BDA
tools can slow down the smooth production
[35]
2. Lack of
infrastructural facility (LIF)
Most of the present techniques are still unable to meet the current infrastructure
requirements
[7,10]
3. Lack of
interest in implementing
new technology
(LIT)
The existing technology for big data management is
quite expensive
[35]
4. Lack of skilled IT personnel
(LSP)
Lack of skilled IT personnel may increase data input errors , data loss or
confound data analysis or interpretation
[7 , 10]
5. High cost of investment
(HCI)
Development of BDA tools for
particular organisations may require substantial investments in data recording and storage
[10]
6. Lack of
funding (LF)
Lack of funding to facilitate new
software and hardware development for big
data analysis
[35]
7. Lack of
facilities to research and develop BDA
tools (LFR)
Lack of interest in collaborating with
educational institutions to research existing
develop BDA tools
8. Complexity of data integration
(CDI)
Variety of data from different sources may
create complexity
[7,10]
9. Difficulty in maintaining data quality
(DQ)
Data quality varies with type of data sources , storage media and so on
[7,10]
10. Problem with data security &
privacy (DSP)
It is an important barrier as data must be secure if they are to compete in global
market
[7,10]
11. Poor
performance and scalability
(PPS)
Big data analytics require massive performance and
scalability
[10]
12. Lack of
training facilities(LTF)
Adaptation of BDA inside manufacturing
companies may be obstructed by absence of suitable
training facilities
[7,10]
13. Non
conformity to time constraints
(NTC)
Major barrier . BDA tools handles big data
and presents the results in stipulated
time . Companies works with tight time
constraint when handling big data
[9], [10]
14. Mindset in terms of big data (MBD)
Stakeholders may be reluctant to use large BDA tools as this may require large investment and extra
effort
[35]
3.
INTERPRETIVE STRUCTURAL
MODELLING METHODOLOGY
Warfield [36] proposed the ISM technique in 1994. Following the process results in creating a structured graph from the set of unique interrelated variables . The process goes through the various steps viz. identifying the relevant elements and establishing a contextual relationship amongst them; then an Structural self- interaction matrix is developed to establish the lead to relationship amongst the two variables i & j . An initial reachability matrix is then created which eventually leads to the development of final reachability matrix and thereafter reachability set and antecedent set for each criterion . In every iteration a top level element is
selected for which the reachability set and intersection sets are the same . Thereafter, precedence relationships are established and elements are arranged in the topological order giving a diagraph or ISM. Further, a dependence and driving power diagram can also be established.
4.
DEVELOPMENT OF ISM MODEL
In this section, ISM model is developed for studying the interrelationships amongst the various barriers to green manufacturing in India. Fourteen important criteria are considered viz. lack of availability of specific data tools (LAT); lack of infrastructural facility (LIF); lack of interest in implementing new technology (LIT) ; lack of skilled IT personnel (LSP); high cost of investment (HCI) ; lack of funding (LF) ; lack of facilities to research and developing BDA tools (LFR) ; complexity of data integration (CDI) ; difficulty in maintaining data quality (DQ) ; problem with data security & privacy (DSP) ; poor performance and scalability (PPS) ; lack of training facilities (LTF) ; non conformity to time constraints (NTC) ; mindset in terms of big data (MBD).
4.1
Construction of Structural Self
-Interaction Matrix (SSIM)
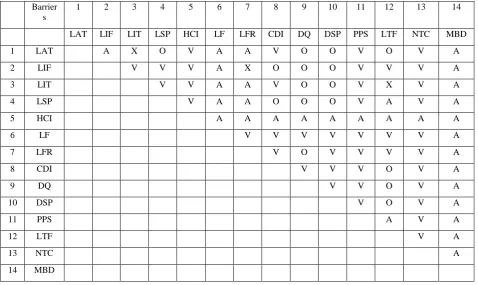
This matrix gives the pair-wise relationship between two variables i.e. i and j based on VAXO. SSIM has been presented below in Fig 1.
Explanation : Lack of availability of specific data tools , lack of infrastructure facility , complexity of data and lack of skilled personnel may lead to lack of facilities to research and develop big data analytics tools and high cost of investment . Similarly, lack of funding and mindset in terms of big data may lead to lack of skilled personnel , lack of facilities to research and develop big data analytics tools. Data quality gets affected by complexity of data and vice versa. Data security and privacy may enhance data quality as well as lead to high cost of investment whereas complexity of data may lead to data security and privacy. Lack of availability of specific data tools may affect the tight time constraint required while implementing big data analytics . Lack of funding , mindset as well as lack of infrastructure facility may lead to lack of training facilities. Lack of funding affects performance and scalability and may lead to poor performance as well as problem with maintaining data quality and problem with data security and privacy. Lack of implementation of new technology may lead to high cost of investment regarding data recording and storage, lack of facilities to research which in turn may lead to problem with data security and privacy Complexity of data may lead to poor performance and scalability if there are lack of resources and latest technology.
4.2
Construction of Initial Reachability
Matrix and final reachability matrix
Barrier s
1 2 3 4 5 6 7 8 9 10 11 12 13 14
LAT LIF LIT LSP HCI LF LFR CDI DQ DSP PPS LTF NTC MBD
1 LAT A X O V A A V O O V O V A
2 LIF V V V A X O O O V V V A
3 LIT V V A A V O O V X V A
4 LSP V A A O O O V A V A
5 HCI A A A A A A A A A
6 LF V V V V V V V A
7 LFR V O V V V V A
8 CDI V V V O V A
9 DQ V V O V A
10 DSP V O V A
11 PPS A V A
12 LTF V A
13 NTC A
[image:4.595.60.539.71.356.2]14 MBD
Fig 1: SSIM matrix for pair wise relationship amongst barriers
Barriers 1 2 3 4 5 6 7 8 9 10 11 12 13 14
LAT LIF LIT LSP HCI LF LFR CDI DQ DSP PPS LTF NTC MBD
1 LAT 1 0 1 0 1 0 0 1 0 0 1 0 1 0
2 LIF 1 1 1 1 1 0 1 0 0 0 1 1 1 0
3 LIT 1 0 1 1 1 0 0 1 0 0 1 1 1 0
4 LSP 0 0 0 1 1 0 0 0 0 0 1 0 1 0
5 HCI 0 0 0 0 1 0 0 0 0 0 0 0 0 0
6 LF 1 1 1 1 1 1 1 1 1 1 1 1 1 0
7 LFR 1 1 1 1 1 0 1 1 1 1 1 1 1 0
8 CDI 0 0 0 0 1 0 0 1 1 1 1 0 1 0
9 DQ 0 0 0 0 1 0 0 1 1 1 1 0 1 0
10 DSP 0 0 0 0 1 0 0 0 0 1 1 0 1 0
11 PPS 0 0 0 0 1 0 0 0 0 0 1 0 1 0
12 LTF 0 0 1 1 1 0 0 0 0 0 1 1 1 0
13 NTC 0 0 0 0 1 0 0 0 0 0 0 0 1 0
14 MBD 1 1 1 1 1 1 1 1 1 1 1 1 1 1
Barriers 1 2 3 4 5 6 7 8 9 10 11 12 13 14
LAT LIF LIT LSP HCI LF LFR CDI DQ DSP PPS LTF NTC MBD D.P
1 LAT 1 0 1 1 1 0 0 1 1 1 1 1 1 0 10
2 LIF 1 1 1 1 1 0 1 0 0 0 1 1 1 0 9
3 LIT 1 0 1 1 1 1 1 1 1 1 1 1 1 0 12
4 LSP 0 0 0 1 1 0 0 0 0 0 1 0 1 0 4
5 HCI 0 0 0 0 1 0 0 0 0 0 0 0 0 0 1
6 LF 1 1 1 1 1 1 1 1 1 1 1 1 1 0 13
7 LFR 1 1 1 1 1 0 1 1 1 0 1 1 1 0 10
8 CDI 0 0 0 0 1 0 0 1 1 1 1 0 1 0 6
9 DQ 0 0 0 0 1 0 0 1 1 1 1 0 1 0 6
10 DSP 0 0 0 0 1 0 0 0 1 1 1 0 1 0 3
11 PPS 0 0 0 0 1 0 0 0 0 0 1 0 1 0 3
12 LTF 0 0 1 1 1 0 0 0 0 0 1 1 1 0 6
13 NTC 0 0 0 0 1 0 0 0 0 0 0 0 1 0 2
14 MBD 1 1 1 1 1 1 1 1 1 1 1 1 1 1 14
De..P 6 4 7 8 14 3 5 7 8 7 12 7 13 1
Fig 3 : Final reachability matrix
D.P : Driving power ; De.P : dependence power
4.3
Level Partition
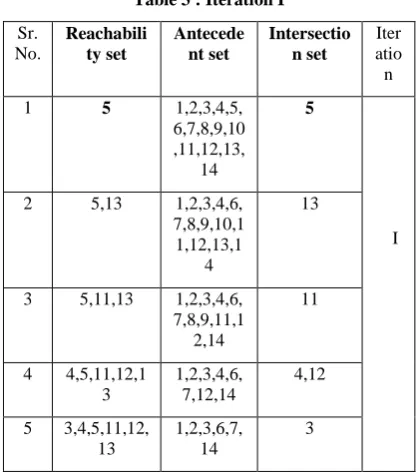
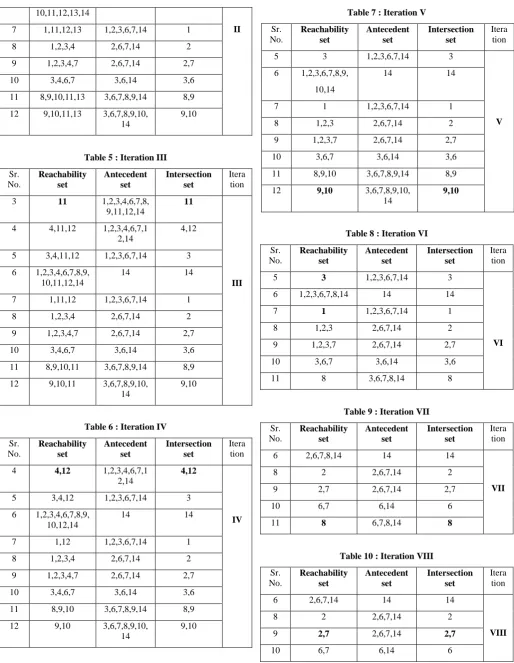
[image:5.595.307.553.411.769.2]From the final reachability matrix, reachability and final antecedent set for each factor are found . The element for which the reachability and intersection sets are same are the top-level element in the ISM hierarchy. After the identification of top level element, it is separated out from the other elements and the process continues for next level of elements. Iterations have been shown from table 3 – table 13 below .
Table 3 : Iteration I
Sr. No.
Reachabili ty set
Antecede nt set
Intersectio n set
Iter atio n
1 5 1,2,3,4,5,
6,7,8,9,10 ,11,12,13,
14
5
I 2 5,13 1,2,3,4,6,
7,8,9,10,1 1,12,13,1
4
13
3 5,11,13 1,2,3,4,6, 7,8,9,11,1 2,14
11
4 4,5,11,12,1 3
1,2,3,4,6, 7,12,14
4,12
5 3,4,5,11,12, 13
1,2,3,6,7, 14
3
6 1,2,3,4,5,6, 7,8,9,10,11, 12,13,14
14 14
7 1,5,11,12,1 3
1,2,3,6,7, 14
1
8 1,2,3,4,5 2,6,7,14 2
9 1,2,3,4,5,7 2,6,7,14 2,7
10 3,4,6,7 3,6,14 3,6
11 8,9,10,11,1 3
3,6,7,8,9, 14
8,9
12 9,10,11,13 3,6,7,8,9, 10,14
9,10
Table 4 : Iteration II
Sr. No.
Reachability set
Antecedent set
Intersection set
Itera tion
2 13 1,2,3,4,6,7,8,
9,10,11,12,1 3,14
13
3 11,13 1,2,3,4,6,7,8, 9,11,12,14
11
4 4,11,12,13 1,2,3,4,6,7,1 2,14
4,12
5 3,4,11,12,13 1,2,3,6,7,14 3
[image:5.595.62.271.521.758.2]10,11,12,13,14
II 7 1,11,12,13 1,2,3,6,7,14 1
8 1,2,3,4 2,6,7,14 2
9 1,2,3,4,7 2,6,7,14 2,7
10 3,4,6,7 3,6,14 3,6
11 8,9,10,11,13 3,6,7,8,9,14 8,9
12 9,10,11,13 3,6,7,8,9,10, 14
9,10
Table 5 : Iteration III
Sr. No.
Reachability set
Antecedent set
Intersection set
Itera tion
3 11 1,2,3,4,6,7,8,
9,11,12,14
11
III 4 4,11,12 1,2,3,4,6,7,1
2,14
4,12
5 3,4,11,12 1,2,3,6,7,14 3
6 1,2,3,4,6,7,8,9, 10,11,12,14
14 14
7 1,11,12 1,2,3,6,7,14 1
8 1,2,3,4 2,6,7,14 2
9 1,2,3,4,7 2,6,7,14 2,7
10 3,4,6,7 3,6,14 3,6
11 8,9,10,11 3,6,7,8,9,14 8,9
12 9,10,11 3,6,7,8,9,10, 14
9,10
Table 6 : Iteration IV
Sr. No.
Reachability set
Antecedent set
Intersection set
Itera tion
4 4,12 1,2,3,4,6,7,1
2,14
4,12
IV
5 3,4,12 1,2,3,6,7,14 3
6 1,2,3,4,6,7,8,9, 10,12,14
14 14
7 1,12 1,2,3,6,7,14 1
8 1,2,3,4 2,6,7,14 2
9 1,2,3,4,7 2,6,7,14 2,7
10 3,4,6,7 3,6,14 3,6
11 8,9,10 3,6,7,8,9,14 8,9
12 9,10 3,6,7,8,9,10,
14
[image:6.595.41.556.65.729.2]9,10
Table 7 : Iteration V
Sr. No.
Reachability set
Antecedent set
Intersection set
Itera tion
5 3 1,2,3,6,7,14 3
V 6 1,2,3,6,7,8,9,
10,14
14 14
7 1 1,2,3,6,7,14 1
8 1,2,3 2,6,7,14 2
9 1,2,3,7 2,6,7,14 2,7
10 3,6,7 3,6,14 3,6
11 8,9,10 3,6,7,8,9,14 8,9
12 9,10 3,6,7,8,9,10,
14
9,10
Table 8 : Iteration VI
Sr. No.
Reachability set
Antecedent set
Intersection set
Itera tion
5 3 1,2,3,6,7,14 3
VI
6 1,2,3,6,7,8,14 14 14
7 1 1,2,3,6,7,14 1
8 1,2,3 2,6,7,14 2
9 1,2,3,7 2,6,7,14 2,7
10 3,6,7 3,6,14 3,6
11 8 3,6,7,8,14 8
Table 9 : Iteration VII
Sr. No.
Reachability set
Antecedent set
Intersection set
Itera tion
6 2,6,7,8,14 14 14
VII
8 2 2,6,7,14 2
9 2,7 2,6,7,14 2,7
10 6,7 6,14 6
11 8 6,7,8,14 8
Table 10 : Iteration VIII
Sr. No.
Reachability set
Antecedent set
Intersection set
Itera tion
6 2,6,7,14 14 14
VIII
8 2 2,6,7,14 2
9 2,7 2,6,7,14 2,7
Table 11 : Iteration IX
Sr. No.
Reachability set
Antecedent set
Intersection set
Itera tion
6 6,14 14 14
IX
10 6 6,14 6
Table 12 : Iteration X
Sr. No.
Reachability set
Antecedent set
Intersection set
Itera tion
6 14 14 14 X
4.4
Classification of factors
[image:7.595.126.214.469.736.2]Fig. 4 below shows the driving power and dominance diagram.
Fig . 4: Driving power and dependence diagram
4.5
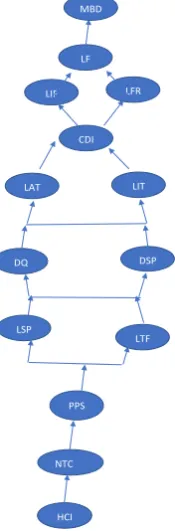
ISM model
An ISM model is developed ( as shown in fig. 5 below ) after arranging the elements as per their interaction or dependence relationships.
5.
MANAGERIAL IMPLICATIONS &
CONCLUSIONS
This research may help manufacturing companies to develop business policies related to big data analytics in supply chains. It may also lead to the exploration of barriers to big data analytics in service companies.
6.
ACKNOWLEDGMENTS
Our thanks to the anonymous reviewers whose comments have helped us in improving the manuscript .
7.
REFERENCES
[1] Wang, G., Gunasekaran , A., Ngai, E. W. T. and Papadopoulos, T. 2016 a. Big data analytics in logistics and supply chain management: Certain investigations for research and applications. International Journal of Production Economics, 176, 98-110.
[2] Waller and facwcet Waller , M.A. and Fawcett , S. E. 2013a. Big data, predictive analytics and theory development in the era of a maker movement supply chain. Journal of Business Logistics, 34, 249-252.
[3] Waller , M. A. and Fawcett, S. E. 2013b. Data science, predictive analytics, and big data: A revolution that will transform supply chain design and management. Journal of Business Logistics, 34, 77-84.
[4] Wang, Y. and Hajli, N. 2017. Exploring the path to big data analytics success in healthcare. Journal of Business
Research, 70, 287–299.
https://doi.org/10.1016/j.jbusres.2016.08.002
[5] Gandomi, A., & Haider, M. 2015. Beyond the hype: Big data concepts, methods, and analytics. International Journal of Information Management, 35(2), 137–144. https://doi.org/10.1016/j.ijinfomgt.2014.10.007
[6] Tsai, C.-W. W., Lai, C.-F. F., Chao, H.-C. C. and Vasilakos, A. V. 2015. Big data analytics : a survey.
Journal of Big Data, 2, 1–32.
https://doi.org/10.1186/s40537-015-0030-3.
[7] Alharthi, A., Krotov, V. and Bowman, M. 2017. Addressing barriers to big data. Business Horizons,
60(3), 285–292.
https://doi.org/10.1016/j.bushor.2017.01.002.
[8] Ahmed, E., Yaqoob, I., Hashem, I. A. T., Khan, I., Ahmed, A. I. A., Imran, M. and Vasilakos, A. V. 2017. The role of big data analytics in Internet of Things. Computer Networks, in press, 1–13. https://doi.org/10.1016/j.comnet.2017.06.013 .
[9] Zhong, R. Y., Newman, S. T., Huang, G. Q. and Lan, S. 2016. Big Data for supply chain management in the service and manufacturing sectors: Challenges, opportunities, and future perspectives. Computers and
Industrial Engineering,
http://dx.doi.org/10.1016/j.cie.2016.07.013.
[10] Malaka, I. and Brown, I. 2015b. Challenges to the organisational adoption of big data analytics : A case study in the South African telecommunications industry. In Proceedings of the 2015 Annual Research Conference on South African Institute of Computer Scientists and Information Technologists (pp. 1–9). Stellenbosch, South
Africa: ACM, New York.
https://doi.org/10.1145/2815782.2815793.
Driving Power
14 MBD
13 LF
12 LIT
11
10 DRIVERS LFR LAT
9 LIF LINKAGE
8
7
6 CDI ,
LTF
DQ
5 DEPENDENT
4 AUTONOMOUS LSP
3 DSP PPS
2 NT
C
1 HCI
1 2 3 4 5 6 7 8 9 10 11 12 13 14
Dependence
LIT LIF
LSP
DSP
PPS
HCI NTC
LTF LAT
DQ CDI
[11]Addo-Tenkorang, R. and Helo, P. T. 2016. Big data applications in operations/supply-chain management: A literature review. Computers & Industrial Engineering, 101, 528–543. https://doi.org/10.1016/j.cie.2016.09.023
[12]Arunachalam, D., Kumar, N. and Kawalek, J. P. 2017. Understanding big data analytics capabilities in supply chain management: Unravelling the issues, challenges and implications for practice. Transportation Research Part E: Logistics and Transportation Review, in press, 1– 21. https://doi.org/10.1016/j.tre.2017.04.001
[13]Singh, A., Shukla, N. and Mishra, N. 2017. Social media data analytics to improve supply chain management in food industries. Transportation Research Part E: Logistics and Transportation Review. https://doi.org/10.1016/j.tre.2017.05.008.
[14]Chae, B. 2015. Insights from supply chain and Twitter analytics: considering twitter and twitter data for supply chain practice and research. International Journal of Production Economics, 165, 247–259. http://dx.doi.org/10.1016/j.ijpe.2014.12.037.
[15]Bi, Z. and Cochran, D. 2014. Big data analytics with applications. Journal of Management Analytics,1(4), 249–265. https://doi.org/10.1080/23270012.2014.992985
[16]Li, J., Tao, F., Cheng, Y.and Zhao, L. 2015. Big data in product lifecycle management. International Journal of Advanced Manufacturing Technology, 81(1–4), 667– 684. https://doi.org/10.1007/s00170-015-7151-x .
[17]Hazen, B. T., Boone, C. A., Ezell, J. D. and Jones-Farmer, L. A. 2014. Data quality for data science, predictive analytics, and big data in supply chain management: An introduction to the problem and suggestions for research and applications. International Journal of Production Economics, 154, 72-80.
[18] Meriton, R.F. and Graham, G. 2016. Big data and supply chain management: A marriage of convenience. Presented at the 20th International Manufacturing Symposium, Cambridge, UK, 29-30th September.
[19]Opresnik, D. and Taisch, M. 2015. The value of big data in servitization. International Journal of Production Economics, 165, 174-184.
[20]Radke, A.M., Tseng, M.M. 2015. Design considerations for building distributed supply chain management systems based on cloud computing. Journal of Manufacturing Science Engineering, 137. http://dx.doi.org/10.1115/1.4030736.
[21]Öberg, C. and Graham, G. 2016. How smart cities will change supply chain management: A technical viewpoint. Production Planning and Control, 27, 529-538.
[22] Hahn, G. J. and Packowski, J. 2015. A perspective on applications of in-memory analytics in supply chain management. Decision Support Systems, 76, 45-52.
[23]Lee, I. 2017. Big data: Dimensions, evolution, impacts, and challenges. Business Horizons, 60(3), 293–303. https://doi.org/10.1016/j.bushor.2017.01.004.
[24]Kang, Y., Park, I., Rhee, J. and Lee, Y. 2016. MongoDB-based repository design for IoT-generated RFID/sensor
big data. IEEE Sens. J. 16, 485–497. http://dx.doi.org/ 10.1109/JSEN.2015.2483499.
[25] Liu, Y. Q. and Wang, H. 2016 . Order allocation for service supply chain base on the customer best delivery time under the background of big data. International Journal of Computer Science and Applications, 13, 84-92.
[26] Giannkis, M. and Louis, M. 2016. A multi-agent based system with big data processing for enhanced supply chain agility. Journal of Enterprise Information Management, 29, 706-727.
[27] Chen, D. Q., Presteon, D. S. and Swink, M. 2015. How the use of big data analytics affects value creation in supply chain management. Journal of Management Information Systems, 32, 4-39.
[28] Schoenherr, T. and Speier-Pero, C. 2015. Data science, predictive analytics, and big data in supply chain management: Current state and future potential. Journal of Business Logistics, 36, 120- 132.
[29] Wu, C. X., Zhao, D. Z. and Pan, X. Y. 2016. Comparison on dynamic cooperation strategies of a three echelon supply chain involving big data service provider. Kongzhi yu Juece/Control and Decision, 31, 1169-1177.
[30] Vander Spoel, S., Amrit, C. and Van Hillegersberg , J. 2015. Predictive analytics for truck arrival time estimation: a field study at a European distribution center. International Journal of Production Research, 1– 17. http://dx.doi.org/10.1080/00207543.2015.1064183.
[31] Hofmann, E. 2015. Big data and supply chain decisions: the impact of volume, variety and velocity properties on the bullwhip effect. International Journal of Production
Research, 7543,1–19.
http://dx.doi.org/10.1080/00207543.2015.1061222.
[32] Hilbert, M. 2016. Big Data for Development: A review of promises and challenges. Development Policy
Review, 34(1), 135–174.
https://doi.org/10.1111/dpr.12142.
[33] Sivarajah, U., Kamal, M. M., Irani, Z. and Weerakkody, V. 2017. Critical analysis of Big Data challenges and analytical methods. Journal of Business Research, 70, 263–286. https://doi.org/10.1016/j.jbusres.2016.08.001.
[34] Mangla, S. K., Govindan, K. and Luthra, S. 2017. Prioritizing the barriers to achieve sustainable consumption and production trends in supply chains using fuzzy Analytical Hierarchy Process. Journal of Cleaner Production. 151, 509–525. https://doi.org/10.1016/j.jclepro.2017.02.099.
[35] Moktadir , M.A. , Ali , S.M. ,Paul, S. and Shukla, N. 2018. Barriers to big data analytics in manufacturing supply chains: A case study from Bangladesh, Computers & Industrial Engineering . DOI: 10.1016/j.cie.2018.04.013.