Abstract— Automated object detection algorithm is an important research challenge in intelligent urban surveillance systems for IoT and smart cities applications. In particular, smart vehicle license plate recognition (VLPR) and vehicle detection are recognized as core research issues of these IoT-driven intelligent urban surveillance systems. They are key techniques in most of the traffic related IoT applications, such as road traffic real-time monitoring, security control of restricted areas, automatic parking access control, searching stolen vehicles, etc. In this paper, we propose a novel unified method of automated object detection for urban surveillance systems. We use this novel method to determine and pick out the highest energy frequency areas of the images from the digital camera imaging sensors, that is, either to pick the vehicle license plates or the vehicles out from the images. Our proposed method can not only help to detect object vehicles rapidly and accurately, but also can be used to reduce big data volume needed to be stored in urban surveillance systems.
Index Terms— Smart transportation, smart city, IoT, vehicle license plate, vehicle, urban surveillance system.
I. INTRODUCTION
mart transportation and urban surveillance systems are important internet of things (IoT) applications for smart cities [1][2]. In these smart transportation and urban surveillance applications, cameras/imaging sensors are commonly installed to automatically detect and identify potential vehicles/cars through automated object detection methods. Usually, such automated object detection methods demand high-complexity image/data processing technologies and algorithms. Hence, the design of low-complexity automated object detection algorithms becomes an important topic in urban surveillance systems. Among these researches, both vehicle license plate recognition (VLPR) and vehicle recognition are hot research topics worldwide, which can be applied to many IoT applications, such as road traffic data
This work was supported by Institute of Software Application Technology, Guangzhou & Chinese Academy of Sciences under Smart City Urban Surveillance Systems project CSA7035.
Ling Hu and Qiang Ni are with the School of Computing and Communications, Lancaster University, InfoLab21, Lancaster, LA1 4WA, UK. E-mail:{l.hu, q.ni}@lancaster.ac.uk.
Copyright (c) 2012 IEEE. Personal use of this material is permitted. However, permission to use this material for any other purposes must be obtained from the IEEE by sending a request to [email protected].
collection/monitoring, automatic parking charging and access control, and searching stolen vehicles.
It is known that a license plate number is a unique identification of a vehicle. Specifically, the license plate recognition, i.e. the extraction of a license plate region from an image, is the key module in a VLPR system [3], which influences the accuracy of the VLPR systems significantly. Different algorithms have been proposed for identifying a vehicle license plate using image processing [4]. One typical way is vertical edge matching [5]. The idea is to first locate the two vertical edges of a license plate, and hence to detect its four corners. In this way, the license plate can be extracted accurately. Using the contrast between the grayscale values, [6] proposed a vertical edge based license plate recognition method.
Another technology is morphology based license plate detection. This method is to extract important features of contrast as guidance to search the license plates [7]. In [8], to extract potential text information from the image, a method is proposed using adaptive threshold, fractal filter and morphological analysis. In [9] and [10], edge statistics in combination with morphological approaches are proposed to eliminate the undesired edges in the images.
Color based methods are also attempted which make use of the colors of the vehicle license plate. In [11], a color based method combined with the texture characteristics is proposed to try to detect license plate from the color image. In [12] and [13], the combination of edge information and plate color are utilized to identify the vehicle license plates.
Based on neural network techniques, other recognition methods of vehicle license plates are proposed. These methods are designed to train classifiers to offer a proper response to the license plate images. In [14], the authors apply genetic algorithm (GA) to the training process and combine the statistic features together with structure features. In [15], a vehicle license plate detection method using neural network approaches is proposed. The proposed scheme utilizes a neural network chip named as CogniMem to detect the vehicle license plates. In [16], the authors propose a method using wavelet transform technique to decompose the images into different layers, and then utilize the low frequency images to combine with neural network technique.
While most approaches have attempted to deal with the VLPR with optical characteristics recognition, another method
IoT-Driven Automated Object Detection
Algorithm for Urban Surveillance Systems in
Smart Cities
Ling Hu and Qiang Ni,
Senior Member
,
IEEE
is proposed based on the horizontal and vertical frequency energy differences. In [17], the authors use Daubechies wavelet transform method to calculate the vertical and horizontal frequency energy curves, considering the frequency is the highest near the number plate.
Other researchers focus on the vehicle recognition. In [18], the authors propose a combination of the transfer subspace learning technique with the manifold learning approach to allow a more systematic search of tuning parameters for the purposes of cross-data and cross-domain electro-optical vehicle recognition. The authors in [19] propose a vehicle recognition and retrieval system using the so-called bag of words approach. In this way, the system may determine automatically the manufacturer and the type of the captured vehicle images. The authors in [20] present a vehicle recognition system prototype using magnetic sensor techniques where more complex hardware and processing are utilized.
However, all the above mentioned existing methods in the literature are still too complex which demand high computational processing. Furthermore, each method can only be used to recognize a vehicle license plate or a vehicle individually. None of them can be used as a unified method to detect both vehicle license places and vehicles.
In this paper, we propose a novel, simple and unified method to search the objects by filtering out the vehicle and/or license plate images rapidly from the digital camera imaging sensors. We design a simple filter to effectively detect either vehicle license plates or vehicles, motivated by the observation that in the most cases the object is the highest energy frequency part of an image. This process can be easily implemented in any urban surveillance systems in smart cities to pick out comparably important areas from the images captured by any camera/imaging sensors in urban environments, which will be a useful method not only to rapidly detect the important information but also to reduce the large data volume required to be stored because only those selected important (smaller) data will be stored as compared to huge raw data captured/generated from any cameras/imaging sensors 24 hours per day, 7 days a week and 365 days per year.
II. OURPROPOSEDALGORITHM
A. Pre-treatment of the image
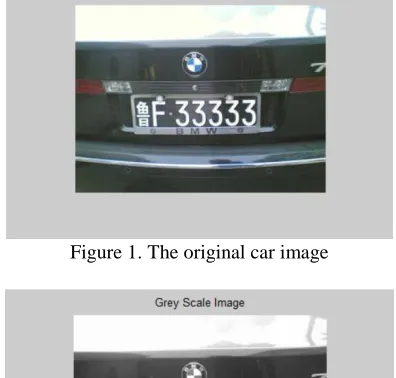
As an instance, let us look at Figure 1. From this image, we need to pick out the car plate, which is the highest energy frequency area. Before formal treatment of the image, we carry a pre-treatment of the image. Firstly we convert the original RGB (R: red, G: green, B: blue) image into grey scale image since the color information is not needed in our method, and the size of the image file can be reduced to a lower level. The formula to convert the image is illustrated below:
𝐴𝑔𝑙=
3𝐴𝑟+ 6𝐴𝑔+ 𝐴𝑏
10 , (1)
where Ar denotes the red spectrum of the color image, Ag is the green spectrum of the color image, and Ab is the blue spectrum
of the color image. The result Agl is the converted grey scale level. The grey scale image is shown in Figure 2.
In the second step, we calculate and obtain the gradient of the grey image. We consider the two-dimensional grey scale image as a two-dimensional matrix P, and calculate the numerical gradient of this matrix. Px corresponds to the differences in x (horizontal) direction. Py corresponds to the differences in y (vertical) direction. The definition to calculate the Px and Py
[image:2.612.343.541.182.371.2]are:
[image:2.612.341.540.324.469.2]Figure 1. The original car image
Figure 2. The grey scale image
{𝑃𝑃𝑥(𝑖,𝑗)= 𝐼(𝑖 + 1, 𝑗) − 𝐼(𝑖, 𝑗)
𝑦(𝑖,𝑗)= 𝐼(𝑖, 𝑗 + 1) − 𝐼(𝑖, 𝑗) , (2)
where I is the grey scale value of the grey scale image, and (i,j) is the position of the pixel.
For every pixel, after getting the gradient of both the horizontal and vertical directions, we calculate the overall gradient of this pixel:
𝑃 = √𝑃𝑥2+ 𝑃𝑦2 . (3)
Figure 3. The gradient of the grey image
B. Design of novel filter
Our idea is to design a two-dimensional smart filter to pick out the object area of an image. We first investigate the characteristics of the object. We found that, within the object boundaries, the energy frequency is high, and the energy frequency curves down sharply outside the object (e.g. the car license plate) boundaries. This interesting characteristic inspires us to design a new two-dimensional filter to figure out the horizontal and perpendicular frequency energy curves, since the meaning of filtering is to calculate the intercorrelation of the filter and the image matrix. Mathematically, the definition of intercorrelation is a mutual relationship or connection between two or more things. The formula for the correlation coefficient is:
r = ∑ (𝑥𝑖− 𝑥̅)(𝑦𝑖− 𝑦̅)
𝑛 1
√∑ (𝑥𝑛1 𝑖− 𝑥̅)2√∑ (𝑦𝑛1 𝑖− 𝑦̅)2
. (4)
Our objective is to implement a new filter to calculate the correlation coefficient for every pixel of the car image and obtain a new image with the car license plate area standing out. To achieve this, we investigate the function for intercorrelation which is expressed as follows:
𝑓(𝑥)°𝑔(𝑥) = 𝑓∗∗ 𝑔 = ∫ ∫ 𝑓∞ ∗(𝑢, 𝑣)𝑔(𝑥 − 𝑢, 𝑦 − 𝑣)𝑑𝑢𝑑𝑣. −∞
∞
−∞ (5)
This motivates us to utilize the pulse function δ(x) which holds an important characteristic as follows:
∫ 𝛿(𝑥 − 𝑎)𝜑(𝑥)𝑑𝑥−∞∞ = 𝜑(𝑎). (6) That is, the function δ(x-a) can be used to pick out another function φ(x) at the x-axis when x=a. We use this property to pick out the highest energy frequency area of a car image.
Specifically, we define line arrays to simulate the pulse function δ(x). After the filtering process, the result will be shown in a new image.
As for our proposal, a perpendicular line array filter (in the array, all the numbers are set as 1’s) is used to filter the pre-treated image in horizontal direction, and another horizontal line array filter (in the array, all the numbers are set as 1’s) is used to filter the pre-treated image in perpendicular direction. The diagrammatic sketch is shown in Figure 4.
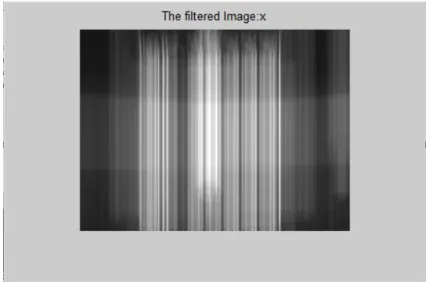
We first filter the pre-treated image in the horizontal direction, since the vehicle plate (or a vehicle) normally holds
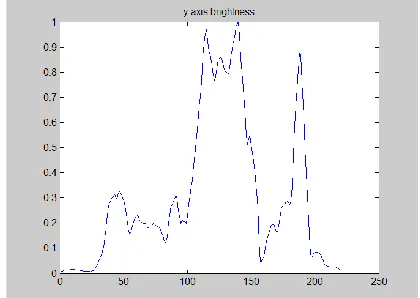
[image:3.612.322.567.137.221.2]larger size in this direction. Hence, it is easier to eliminate noise in this direction. The results are shown in Figure 5. In this way, the high energy frequency areas are shown off by brighter lines. In order to get the intuitive impression, we plot the one-dimensional brightness values for straightforward view by choosing the middle horizontal array line of the filtered image. The values obtained in the x-axis are shown in Figure 6.
[image:3.612.337.552.256.397.2]Figure 4. Line array filters to filter the pre-treated image
Figure 5. The horizontal filtered image
Figure 6. The horizontal axis’s brightness values
From Figures 5 and 6, we find that the brightness values show off the plate area in the horizontal direction roughly, with the higher value representing high energy frequency. The shortcoming is the noise, which makes how to detect the threshold difficult. In order to solve the problem of the noise, we need to improve our filter to smooth the noise while keeping this filter simple and effective.
C. Improvement of the filter
[image:3.612.336.550.422.579.2]sharp edges between the lines, one way is to expand the width of the filter. On the other side, the filter width can’t be too wide, since it will lead to blurred filtered image. In the horizontal direction, we expand the original line array filter into 30 lines of 1’s, that is, to expand the filtered line into a matrix. In this way, the filter becomes a long and narrow rectangle. This perpendicular matrix (all the numbers are set as 1’s) is used to filter the image in horizontal way. The diagrammatic sketch of this filter is shown in Figure 7.
Figure 7. Matrix filter in horizontal direction
We use this improved filter to filter the pre-treated image in horizontal direction; the results are shown in Figure 8. In this direction, the high frequencies areas again are figured out by brighter areas.
[image:4.612.377.513.282.395.2] [image:4.612.80.277.424.546.2] [image:4.612.80.276.578.723.2]In order to get the intuitive impression, we plot the one-dimensional figure. By choosing the middle horizontal brightness values of the filtered image, we plot the results in Figure 9. The results are smoothed and noise is reduced while the main shape remains.
Figure 8. The horizontal filtered image
Figure 9. The horizontal axis’s brightness values
D. Object area in the horizontal direction
Since the car image has been filtered perfectly, to cut out the plate area is not difficult now. As for the horizontal axis, the whole plate area is the brightest area. According to this feature, we only need to scan the horizontal axis values from left to right and simply choose the threshold brightness of 0.5. In order to eliminate the interruption of unwanted small brightness, such as the edges of the car, we check the picked width between the thresholds. Since the width of the car license plate is within an already-known area, we can cut out the car license plate in x-axis correctly.
We know that the width of the filter matrix brings some blur and expands the width of the car plate, and the filter scans the image from left to right. Hence we only need to gently adjust the final results by shrinking the detected area and move the results a little left.
After obtaining the x-axis value, we cut this horizontal area from the original image, and the result is shown in Figure 10.
Figure 10. The object area in horizontal direction
E. Use filter to detect the perpendicular direction area
Similar to the horizontal direction, we use matrix filter in the perpendicular position. Since the car license plate area in horizontal direction has already been picked out, in order to avoid the interference of unwanted noise, we only need to filter the pre-treated image in the area shown in Figure 11. We notice that in the perpendicular direction, there is no break between the characters like the horizontal direction; hence the height of the filter does not need to be big. Here we choose the height number as 8 to filter the object image. The diagrammatic sketch of this filter is shown in Figure 11.
[image:4.612.370.518.581.690.2]After filtering the pre-treated image within the area shown in Figure 10, the perpendicular results are shown in Figure 12. In this direction, the high frequencies areas are shown out by brighter areas.
Figure 12. The perpendicular filtered image
[image:5.612.99.255.109.244.2]In order to get the intuitive impression, we plot the one-dimensional figure for straightforward view as well. By choosing the middle perpendicular brightness values of the filtered image, we plot the results in Figure 13. Because the width of the filter is small, the results are smoothed and noise is reduced while the main shape remains.
Figure 13. The perpendicular axis’s brightness values
Now we need to cut out the plate area in the perpendicular direction. As for the perpendicular axis, the whole plate area is the brightest area although there are some interruptions of noise coming from the edges of the car, with the noise brightness normally shown as narrow pulse. According to this feature, we only need to scan the perpendicular axis’s brightness values from left to right and simply choose the threshold value at 0.5. In the scan process, we check the picked width between the thresholds. Since the height of the car license plate is within an already-known area, we can cut out the car license plate in perpendicular direction correctly.
We then gently adjust the final results by shrinking the detected area and move the results a little up. After getting the four edge value, we cut this area from the original car image, and the result is shown in Figure 14.
Figure 14. The detected car license plate-1
The result shows the correctly picked car license plate. Consider that we only use a simple filter to get the result, this demonstrates that our method is effective and practical.
F. The flow chart of our proposed method
The flow chart of our proposed method is shown in Figure 15. It is a simple method to pick out the highest energy frequency area of a vehicle image.
Take a car image
Show the object
area
Convert to grey
scale image
Convert to
gradient image
X-direction to
filter the image
Search the
brightness values
to find the y-axis
area
Y-direction to
filter the image
Search the
brightness values
[image:5.612.325.573.284.561.2]to find the x-axis
area
Figure 15. The process of our proposed method
III. EXPERIMENTALRESULTSOFOURPROPOSED
FILTERS
A. Use our filter to detect vehicle license plates
[image:5.612.72.282.355.504.2]Figure 16. The detected car license plate-2
Figure 17. The detected car license plate-3
[image:6.612.54.299.175.280.2]In many situations, the car license plates are not such big as shown in Figures 15, 16 and 17. They may appear like in Figure 18, a whole car with a smaller car license plate:
Figure 18. Whole car with the car license plate
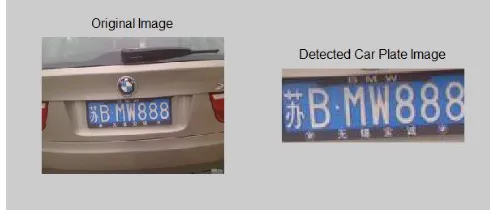
[image:6.612.322.565.201.297.2]In these cases, we test our proposed filter, and find that our method can still detect the car license plates by simply adjusting the threshold of the x-axis and y-axis. We adjust the threshold of x-axis to 0.7 and keep the threshold of y-axis unchanged (0.5). Then our method matches that kind of median size car license plates. The results of our experiment are shown in Figures 19, 20 and 21.
Figure 19. The detected car license plate-4
Figure 20. The detected car license plate-5
Figure 21. The detected car license plate-6
It is a simple method to pick out the highest energy frequency area of a vehicle image, in our cases which are the vehicle license plates. For other similar sized vehicle images, the parameter settings may be chosen as the same, hence it is useful for urban surveillance systems. For example, at a car parking lot, the camera takes the vehicle images at a fixed place and fixed distance with the vehicles.
B. Use our filter to detect vehicles
In the following, we will show that our unified filter can be used to detect the vehicles from the images, since the vehicles also show high energy frequency within the images.
This time we begin from a car image shown in Figure 22. Our aim is to pick out the car from the image. The first step is to convert the color image into a grey image. Then, similar to the car license plate searching, we calculate and obtain the gradient of the grey image.
[image:6.612.79.278.354.484.2]After we complete the pre-treatment process of the car image, the next step is to pick out the car using our proposed method.
Figure 22. The original image of a car
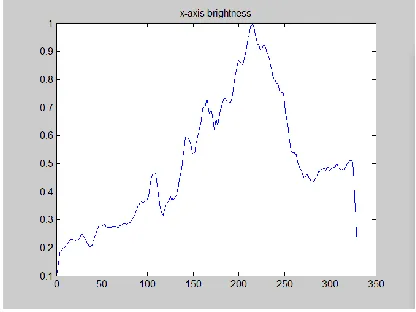
[image:6.612.334.554.574.704.2] [image:6.612.74.280.605.694.2]direction. In this direction, the high frequencies areas are shown out by brighter area. In order to get the intuitive impression, we plot the one-dimensional brightness values for straightforward view by choosing the middle horizontal array line of the filtered image. The array values are shown in Figure 23.
Figure 23. The horizontal axis’s brightness values
[image:7.612.336.548.50.205.2] [image:7.612.73.281.111.267.2]Since the prepared work has been done perfectly, to cut out the car area is not difficult now. As for the horizontal axis, the car area is the brightest area. According to this feature, we only need to scan the horizontal axis array from left to right. We simply choose the threshold at 0.5 for the horizontal axis. In order to eliminate the interruption of unwanted brightness, we check the picked width between the thresholds. Since the width of the car is within an already-known area, we can cut out the car in horizontal direction correctly; the result is shown in Figure 24.
Similar to the horizontal direction, we use matrix array filter in the perpendicular position. Since the car area in horizontal direction has already been picked out, we only need to filter the pre-treated image in the area shown in Figure 24.
Figure 24. The detected car area in horizontal direction
[image:7.612.321.572.386.493.2]By choosing the middle perpendicular brightness values of the filtered image, we plot the results in Figure 25.
Figure 25. The perpendicular axis’s brightness values
Now we are to cut out the car area in perpendicular direction. As for the perpendicular axis, the whole car area is the brightest area although there are some interruptions of noise. According to this feature, we only need to scan the perpendicular axis’s brightness values from left to right and simply choose the threshold as 0.5 for the perpendicular brightness values. In the scan process, we check the picked height between the thresholds. Since the height of the car is within an already-known scale, we can cut out the car in perpendicular direction correctly.
After getting the four edge value, we cut out this area from the original car image, and the result is shown in Figure 26.
Figure 26. The detected car-1
The result is amazing. Note that we use the same simple and effective filter to get the result.
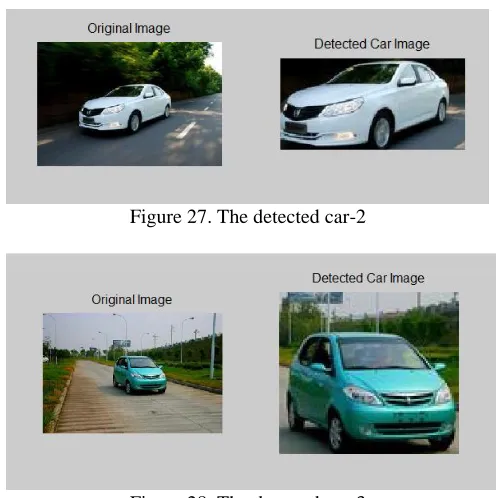
[image:7.612.103.256.469.615.2]Figure 27. The detected car-2
Figure 28. The detected car-3
IV. CONCLUSION
This paper designs a novel filter which is unified to detect either the vehicle license plates or the vehicles from the digital camera imaging sensors of urban surveillance systems in smart cities. To the best of our knowledge, we are the first to design this kind of filter to detect the vehicle/license plate objects. We tested our filter with different images. The results show that our filter can automatically detect the highest energy frequency areas out from the images, which makes our proposed algorithm a simple and effective method to automatically detect vehicle objects for IoT and smart cities applications. Our method can also be used to reduce the big data volume which is generated every day from urban surveillance systems in smart cities.
REFERENCES
[1] S. Chen, H. Xu, D. Liu, B. Hu, H. Wang, “A vision of IoT: applications, challenges, and opportunities with China perspective,” IEEE Internet of Things Journal, Vol. 1, Issue 4, pp. 349 - 359, Aug 2014.
[2] M. Handte, S. Foell, S. Wagner, G. Kortuem, P. Marrón; “An Internet-of-Things enabled connected navigation system for urban bus riders,” IEEE Internet of Things Journal, Vol. 3, Issue 5, pp. 735 - 744, Oct 2016.
[3] B. Li, B. Tian, Q. Yao, K. Wang, “A vehicle license plate recognition system based on analysis of maximally stable extremal regions,” 9th IEEE International Conference on Networking, Sensing and Control, pp. 399 - 404, 2012.
[4] C. Anagnostopoulos, I. Anagnostopoulos, I. Psoroulas, V. Loumos, E. Kayafas, “License plate recognition from still images and video sequences: a survey,” IEEE Transactions on Intelligent Transportation Systems, Vol. 9, Issue 3, pp. 377 - 391, Sept 2008.
[5] M. Yu, Y. Kim, “An approach to Korean license plate recognition based on vertical edge matching,” 2000 IEEE International Conference on Systems, Man, and Cybernetics, Vol. 4, pp. 2975 – 2980, 2000. [6] A. Al-Ghaili, S. Mashohor, A. Ramli, A. Ismail, “Vertical-edge-based
car-license-plate detection method,” IEEE Transactions on Vehicular Technology, Vol. 62, Issue 1, pp. 26 - 38, Jan. 2013.
[7] J. Hsieh, S. Yu, Y. Chen, “Morphology-based license plate detection from complex scenes,” 16th IEEE International Conference on Pattern Recognition, pp. 176 – 179, 2002.
[8] A. Lensky, K. Jo, V. Gubarev, “Vehicle license plate detection using local fractal dimension and morphological analysis,” The 1st IEEE International Forum on Strategic Technology, pp. 47 - 50, 2006. [9] S. Wang, H. Lee, “Detection and recognition of license plate characters
with different appearances,” Proceedings of IEEE Intelligent Transportation Systems, pp. 979 – 984, Vol 2, 2003.
[10] H. Bai, C. Liu, “A hybrid license plate extraction method based on edge statistics and morphology,” 17th IEEE International Conference on Pattern Recognition, pp. 831 – 834, Vol. 2, 2004.
[11] G. Li, R. Yuan, Z. Yang, X. Huang, “A yellow license plate location method based on RGB model of color image and texture of plate,” Second Workshop on Digital Media and its Application in Museum & Heritages, pp. 42 - 46, 2007.
[12] A. Ahmadyfard, V. Abolghasemi, “Detecting license plate using texture and color information,” International Symposium on Telecommunications, pp. 804 - 808, 2008.
[13] L. Luo, H. Sun, W. Zhou, L. Luo, “An efficient method of license plate location,” 1st International Conference on Information Science and Engineering, pp. 770 - 773, 2009.
[14] G. Sun, C. Zhang, W. Zou, G. Yu, “A new recognition method of vehicle license plate based on genetic neural network,” The 5th IEEE Conference on Industrial Electronics and Applications, pp. 1662 – 1666, 2010. [15] Y. Liu, D. Wei, N. Zhang, M. Zhao, “Vehicle-license-plate recognition
based on neural networks,” IEEE International Conference on Information and Automation, pp. 363 - 366, 2011.
[16] J. Sharma, A. Mishra, K. Saxena, S. Kumar, “A hybrid technique for license plate recognition based on feature selection of wavelet transform and artificial neural network,” International Conference on Reliability, Optimization and Information Technology, pp. 347 – 352, 2014. [17] H. Rajput, T. Som, S. Kar, “An automated vehicle license plate
recognition system,” Computer, Vol. 48, Issue 8, pp. 56 - 61, Aug 2015.
[18] O. Mendoza-Schrock, M. Rizki, V. Velten, “Manifold and transfer subspace learning for cross-domain vehicle recognition in dynamic systems,” 18th International Conference on Information Fusion, pp. 1954 – 1961, 2015.
[19] W. Pei, Z. An, Y. Zhu, X. Jia, X. Zuo, F. Wang, “A rapid vehicle recognition and retrieval system,” 2nd International Conference on Systems and Informatics, pp. 748 - 753, 2014.