Content based Natural Image Retrieval using Histogram,
Segmentation and Edge
Md Safikul Alam
School of Education Technology Jadavpur University
Kolkata, India
Joydeep Mukherjee
School of Education Technology Jadavpur University
Kolkata, India
ABSTRACT
Content Based Image Retrieval (CBIR) is a process to retrieve a stored image from database by supplying an image as query instead of text. This can be done by proper feature extraction and querying process. The features like histogram, color values and edge detection plays very vital role in proper image retrieval. Here we have implemented a method of image retrieval using the histogram, color and edge detection features. In this method we used image segmentation in order to get a better accuracy percentage and this proved itself to be a very successful approach. We used our own computation method as well as some MATLAB functions. Canny’s edge detection technique and color values extraction after image segmentation gives a better accuracy level to our system. Finally we get top images matching to our query image using Euclidean distance.
General Terms
Image recognition by content.
Keywords
Gray color histogram, Segmentation, Edge detection, Lab color space
1.
INTRODUCTION
From past few years, with the advancement of computer technology, digitization in every field has become very important issue for mankind. Nowadays, Internet or World Wide Web has become very popular for transferring data. So for that reason every data generated, analyzed, stored, transmitted and accessed through the Internet must be digitized. Storing of alphanumeric data merely, does not complete a system. Storing of multimedia data like image, video, audio, animation and graphics is also a very necessary part of a system. So in order to give completeness to a system it is much important to store, retrieve and access this vast amount of multimedia data in an efficient way. And for this efficient storage, access and retrieval, the content based retrieval needs to be developed in proper manner with its necessary attention. In this paper, we have given the prime importance to the image storage and retrieval. As image is one of the most widely used data besides text and also is the unit of video and other multimedia information, so content based retrieval of an image data also helps us to retrieve video and other multimedia information. This proposed approach is also a generalized approach to retrieval of other multimedia data. In this paper we propose an image store and retrieval method based on different extracted features like image histogram analysis, extraction of color values from segmented image and logical shape detection of an image.
Our first approach on feature extraction is image histogram analysis. For this we have used some functions that extracted histogram bar values for each and every image. The generated image histogram is almost like a bar graph and that bar values
varies from image to image depending on the color, intensity and many other things related to that image. After extraction of histogram bar values of an image, the different bar values are stored in a 1D array. This process is repeated for every image in the database .Due to high memory usage we convert the color image into grayscale image and then take the histogram of the corresponding image.
Our second approach in feature extraction is to extract color values from an image. First we have converted the color image into Lab color space then and normalize every image into same size, then segment the whole image into small pieces. This color values are also stored in three 1D arrays.
Our third approach in feature extraction is logical shape detection of image. Logical shape detection is also well known as edge detection technique. For edge detection we have many different techniques available that have been proposed times before. We used Canny’s edge detection technique as most of the experiments have proved that this technique gives most effective result for our proposed system.
To apply this technique we have to convert our image to a grayscale one. Though the color values of the image is lost but that makes our edge detection more efficient. After conversion and edge detection is done we have taken the maximum edge value for one column of the image and stored it into a 1D array. And finally after all the feature values are extracted and stored for one image, we get three 1D arrays for one image. Even for the query images, the same procedure is followed. And our system gives a very efficient level of accuracy in case of querying. The rest of the paper organized as follows, section 2- related work surveyed by us , section 3- System overview and proposed approach, section 4- the methods used in feature extraction, section 5- training and testing vector formation, next section is about experimental result that contains accuracy graphs, and this is followed by conclusion and future scope.
ALGORITHM
Step 1- Extract Histogram Feature
Step 2- Extract Segmentation and Color values Step 3- Extract Edge Detection
Step 4- Calculate Training and testing vector from the features Step 5- Find the distance between the vectors and get results
2.
REALTED WORK
8 queries to the image level. All these are done by some
background programming of the system. The image features are extracted from the original image and stored as metadata. And for the query image the same features are extracted from the image and compared with each other. But besides this offline approaches some online approaches [2] are also appreciable in this context. This approach has both higher level and lower level feature extraction. The higher level is just the refinement of lower level feature extraction. And with the introduction of finer features number of candidate images gradually decreases and search become more efficient. Many approaches are available based on histogram extraction technique, but the color coherence vector [3] approach gave a new blow to previous histogram based approaches. This color coherence vector extracts not only the color distribution of pixels in images like color histogram, but also extracts the spatial information of pixels in the images. It gives us a more sophisticated approach towards histogram refinement. Use of multiple color coherence vectors gives much better efficiency than single one though it has higher computational complexity. Some efficient work on histogram is done to detect image copy [4] also. In this scheme multi resolution histogram is used. It is almost same like the plain color histogram method. But it adds some extra feature like encoding of spatial information directly. Most of the works related to the content based image retrieval is associated with the color extraction feature. Different approaches used different color spaces and different techniques to define color values. If the RGB color space is used in some approach then researcher gave high priority to the red, green and blue values. And in case of HSV color space, the hue, saturation and brightness takes the high priority level. For any other approaches different color values gets importance. Jagadeesh Pujari, Pushpalatha S.N, Padmashree D.Desai[5] used HSV and Lab color space to recognize an image and then compared it with gray and RGB approach. In their experiment Lab color space gives better result than other ones. But, Young Deok Chun, Nam Chul Kim and Ick Hoon Jang’s [6] proposed approach is based on the HSV color space. They stored hue and saturation component for an image. And it gave a higher accuracy level than some other conventional methods though the feature vector matrix size was of the same size. In addition it also gave more retrieval accuracy for queries and target images of various resolutions. Some approaches also used the database to sore the feature value of the images that stores color values as well as other features values. Finally the query image feature values are compared with each and every image’s feature values. Then the final candidate images are retrieved. Xiang-Yang Wang , Yong-Jian Yu, Hong-Ying Yang [7] proposes a system that firstly cluster the image then predetermine them using fast color quantization algorithm. Then the dominant color values are obtained. Then these values are merged with the texture values and finally a robust system is presented. Shape detection of an image is an important feature for object recognition. Shape description or representation of edge is an important issue in classification also. Nanhyo Bang and Kyhyun Um [8] proposed an extraction method of logical shape to detect structure of an image. They generated some pattern segment matrix that is composed of curves which helped them to find most similar curve sequence. As per their proposal they demanded that their system have global characteristic like the structural feature and also local characteristic as an adaptive feature of shape. This approach reduces computational complexity and retrieval cost. ZhengYun Zhuang, Ming Ouhyoung [9] proposed a new type of image retrieval approach that associates both with shape detection and color value extraction. Their system has two types of matrix i.e. “shape metric” and “color metric” to store the color values. This approach also gives good accuracy as two
features are used efficiently here. N. Senthilkumaran and R. Rajesh [21] have done a comparative study in different edge detection techniques. They have used the soft computing approaches namely, fuzzy based approach, Genetic algorithm based approach and Neural network based approach. In their research it is seen that Robert method is better than both Sobel and Prewitt method. But by our experiment we can come to a conclusion that for our system the Canny’s method gives more accuracy than the Robert method.
3.
SYSTEM OVERVIEW AND
PROPOSED METHOD
Our proposed methodology involves study of three features image histogram, segmentation, Lab color values and edge detection techniques. It is used for the implementation of CBIR using histogram, color and shape descriptor approach.
3.1 Image Histogram Analysis Method
An image is a function of two variables. It is simply represented by a 2D matrix after the digitization is done. If a pixel in that image is black then the pixel value is assigned to zero and in case of a white pixel the pixel value is assigned to one. For other pixels some other values in between one and zero is assigned. Color histogram of an image is a type of bar graph and these acts as a graphical representation of the tonal distribution in a digital image. The number of pixels is plotted for each tonal value. An image viewer can understand the entire tonal distribution of an image by looking at the histogram bar graph. In mathematics a histogram is a function mi that counts the number of observations that falls in each of the category (bins). Thus, if n is the total number of observations and k is the total number of bins, the histogram mi meets the following conditions:n = sum (mi) when i = 1 to k
In our proposed approach image histogram feature is extracted by converting an image to gray color space and applying this formulae. So the histogram value matrix holds only values between zero and ones.
3.2 Image Segmentation and Color Values
Analysis Method
Image segmentation is a modular approach to get color values of image more accurate. Segmentation of an image means, to divide an image into many small parts. The goal of segmentation is to simplify the representation of image into something that is easier to analyze and access. The segmented images collectively represent the whole main image. By segmentation the different characteristics such as color, intercity, texture etc. of an image can be accessed, manipulated and computed easily. A color image is represented by three 2D matrices after digitization in Lab color space. One matrix is for L and two are for a and b. So for a color image we get three 2D matrix of same size as the image size in pixels. After segmentation also for every small part we get same size matrix as image size in pixels. And as segmented image color manipulation is more easy and accurate so color values we get is more accurate if we do any computation over them. For every small image we get three color values after computation.
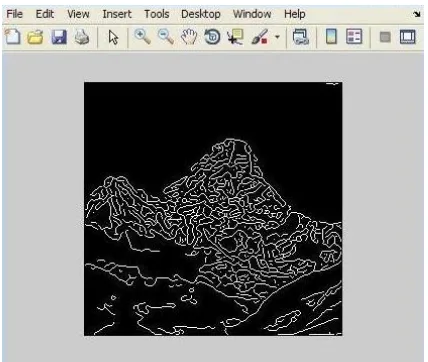
3.3 Shape/Edge Detection Method
Figure 1: Edge detection by Sobel’s method
But in our proposed system Canny’s method (Figure 2) is used. It is proposed by John Canny. He derived optimal smoothing filter algorithm by giving criteria of detection, localization and minimizing multiple responses to a single edge. He used a filter that is well approximated by first-order derivatives of Gaussians. Though it is an old approach, but it is still hard to find an edge detection technique better than this.
Figure 2: Edge detection by Canny’s method
4.
FEATURE EXTRACTION
As mentioned earlier, our proposed approach uses three feature extraction methods i.e. image color histogram extraction, segmentation and image color values extraction in Lab color space and image edge detection using Canny’s edge detection technique.
4.1 Histogram Feature Extraction
Our proposed algorithm to find the histogram of a color image is following:
Step 1: Read the file.
Step 2: Convert the color image to a grayscale one (Figure 3). Step 3: Find the relative frequencies of colors by MATLAB’s own histogram computational method.
[image:3.595.318.535.70.251.2]Step 4: Find the relative frequencies of colors inside the image. Step 5: Store the values in a matrix.
Figure 3: Converted to a grayscale image
4.2 Image Segmentation and Color Values
Extraction
Proposed algorithm to segment an image and extract L, a and b color values from it is as follows:
Step 1: Read the image.
Step 2: Segment the image into small parts by some computational method. The number of segmented small image is not fixed. Any number of images can be generated. For our system main image size is 160*160 and small parts are of 16X16 size.
Step 3: For every small part L channel, a channel and b channel color matrices are generated.
Step 4: The average of L matrix is taken for one small part and the same process is repeated for both a and b matrix.
Step 5: Now finally we get one L color value as well as a and b color values for one small image part.
Step 6: Store these values in a matrix.
4.3 Edge Detection and Values Extraction
Our proposed algorithm to find the edge of a color image is as follows:Step 1: Read the image.
Step 2: Convert the image into a grayscale image because MATLAB supports edge detection only after conversion the image into grayscale one.
Step 3: Apply Canny’s edge detection technique to detect the edges and store it into a 2D matrix.
Step 4: The maximum value of each column is taken from the generated matrix.
Step 5: Store the values in a new matrix.
5.
TRAINING AND TESTING VECTOR
FORMATION
[image:3.595.63.277.343.524.2]10 system. Training image set comprises 160 images segregated in
4 categories. So each category consists of 40 images. The training vector is generated for total 160 images. And all the features values are accumulated for all 160 images in that training vector. Testing image set comprises of 100 images segregated in 4 categories and each category consists of 25 images but these image set is fully different from the training image set though the categories are same. For testing also, all feature values are extracted and stored in testing vector. All the other 100 image feature values are stored in one place, i.e. testing vector.
6.
EXPERIMENTAL RESULTS
6.1 Training Vector Plotting
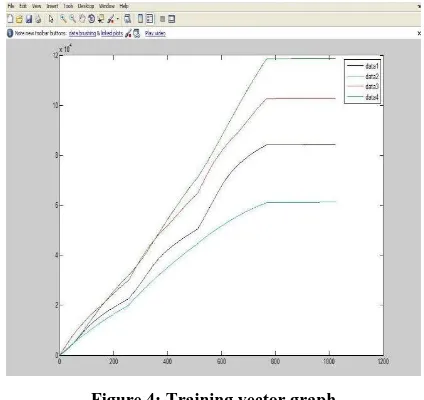
After formation the training vector we plot a graph to understand how the training phase is done. The graph for testing vector is given below (Figure 4).
[image:4.595.316.537.195.399.2]In Figure 4, data 1 denotes class 1 value, data 2 denotes class 2 value, data 3 denotes class 3 value, data 4 denotes class 4 value.
Figure 4: Training vector graph
6.2 Testing Vector Plotting
[image:4.595.63.275.282.482.2]To check the testing vector performance, the graph is plotted as given below (Figure 5).
Figure 5: Testing vector graph
In Figure 5, data 1 denotes class 1 value, data 2 denotes class 2 value, data 3 denotes class 3 value and data 4 denotes class 4 value.
6.3 Final Accuracy Graph plotting
After training and testing phase is over, we have calculated the accuracy using Euclidean distance. The final accuracy graph is given below (Figure 6).
In Figure 6, data 1 denotes class 1 value, data 2 denotes class 2 value, data 3 denotes class 3 value and data 4 denotes class 4 value.
Figure 6: Accuracy graph
[image:4.595.301.549.416.686.2]6.1 Accuracy Percentage
Table 1: Accuracy percentage for different Features Different Features
Accuracy Percentage
Only Histogram
Only Color
Only Edge
Histogram + Color + Edge
25 70 40 70
Table 2: Accuracy percentage for different Classes Different Classes
Class 1
(Mountain)
Class 2 (Cloud)
Class 3 (River)
Class 4 (Forest)
Accuracy Percentage
80 60 76 52
Overall Accuracy
67
7.
CONCLUSION
[image:4.595.66.274.530.726.2]system performance is quite reasonable as per the accuracy graph shown above.
8.
FUTURE SCOPE
In the proposed approach, the present worker worked with image retrieval from some stored images. Properly maintained database storage instead of MATLAB file may give better accuracy level and can also reduce the time and computational complexity. This approach concentrates only on retrieving of image files, but in future this work can be enhanced to retrieve the audio and video file by using these features or modifying them. Euclidean matrix method is used to calculate the distance vector and finally output the top images. Some other approaches, i.e. neural network method, Chebyshev distance, Manhattan distance may also give better accuracy to our system.
9.
REFERENCES
[1] Cosmin Stoica Spahiu, "A multimedia database server for information storage and querying", Proceedings of the 2009 International Multiconference on Computer Science and information technology, pp-517-522.
[2] Jozsef Vass, Jia Yao, Anupam Joshi, Kannappan Palaniappn, Xinhua Zhuang, "Interactive image retrieval over the inyternet", Reliable Distributed Systems, 1998. Proceedings. Seventeenth IEEE Symposium on 20-23 Oct 1998, pp.: 461 – 466.
[4] Zhihua Xu Hefei Ling* Fuhao Zou Zhengding Lu Ping Li,” Robust Image Copy Detection Using Multiresolution Histogram”, Proceedings of the international conference on Multimedia information retrieval, 2010.
[5] Jagadeesh Pujari , Pushpalatha S.N, Padmashree D.Desai, "Content-Based Image Retrieval using Color and Shape Descriptors", Signal and Image Processing (ICSIP), 2010 International Conference on, pp.: 239 – 242.
[6] Young Deok Chun, Nam Chul Kim and Ick Hoon Jang, “Content-Based Image Retrieval Using Multi resolution Color and Texture Features”, Multimedia, IEEE Transactions on Oct. 2008, Volume: 10, Issue: 6, pg. no: 1073 – 1084.
[7] Xiang-Yang Wang , Yong-Jian Yu, Hong-Ying Yang,” An effective image retrieval scheme using color, texture and shape features”, Published in: · Journal Computer Standards & Interfaces archive Volume 33 Issue 1, January, 2011 Elsevier Science Publishers B. V. Amsterdam, The Netherlands, The Netherlands.
[8] Nanhyo Bang and Kyhyun Um, “Image Retrieval Using Structured Logical Shape Feature”, International conference on advances in web-age information management, CHINE 2004 , vol. 3129, pp. 708-713. [9] Zheng-Yun Zhuang, Ming Ouhyoung, “Novel Multi
resolution Metrics for Content-Based Image Retrieval”, Published in: · Proceeding PG '97 Proceedings of the 5th Pacific Conference on Computer Graphics and Applications IEEE Computer Society Washington, DC, USA ©1997.
[10] Yong Rui, Thomas S. Huang, Michael Ortega and Sharad Mehrotra, “Relevance Feedback: A Power Tool for Interactive Content-Based Image Retrieval”, Circuits and Systems for Video Technology, IEEE Transactions on, Vol. 8, No. 5. (1998), pp. 644-655.
[11] Yong Rui, Thomas S. Huang and Sharad Mehrotra, “Content-Based Image Retrieval With Relevance Feedback In Mars”, In Proc. IEEE Int. Conf. on Image Proc, 1997.
[12] Yu Xiaohong, Xu Jinhua, “The Related Techniques of Content-based Image Retrieval”, International Symposium on Computer Science and Computational Technology, 2008, pp.: 154–158.
[13] Raman Maini, Dr. Himanshu Aggarwal, “Study and Comparison of Various Image Edge Detection Techniques”, International Journal of Image Processing 01/2009, volume=3, issue=1.
[14] Toni Safner , Mark P. Miller , Brad H. McRae , MarieJosée Fortin and Stéphanie Manel, “Comparison of Bayesian Clustering and Edge Detection Methods for Inferring Boundaries in Landscape Genetics”, International Journal of Molecular Sciences, 2011.
[15] O. R. Vincent, O. Folorunso, “A Descriptive Algorithm for Sobel Image Edge Detection”, Proceedings of Informing Science & IT Education Conference (InSITE) 2009. [16] Yu Zhong, Anil K. Jain, “Object localization using color,