THE EFFECT OF DISTRIBUTOR DESIGN ON HYDRODYNAMICS OF CONICAL
Harekrushna Sutar and Vikas Kumar
Chemical Engineering Department, National Institute of Technology, Rourkela, 769008, Odisha, India
ARTICLE INFO ABSTRACT
The paper presents the comparative study of hydrodynamics of conical
types of distributor plates have been used .The influence of perforated plate , punched plate and dutch weave mesh distributor designs on fluidized bed dryer hydrodynamics was investigated for a range of bed loadings and superfic
Wet bed loadings of 1, 3 and 5 kg were used with initial static bed heights of 12, 22 and 30 cm respectively. Gas velocity used are 1.5 and 3 m/s. Standard deviation and power spect
the pressure fluctuations were used to analyse the hydrodynamic behaviour of the bed during the drying process. The analysis shows punched plate giving improved performance over the other designs at a gas velocity of 1.5 m/s and bed loading
INTRODUCTION
An important component of any fluidized bed is the gas distributor. The role of the distributor is to evenly distribute the fluidization gas across the bed inlet and hence to initiate effective gas-solids contacting. Various distributor designs have been created to improve on the operational co that can be encountered in fluidized bed processes. These designs can influence the bed hydrodynamics and therefore potentially alter the rate of heat and mass transfer in fluidized bed processes, including dryers. Many industries, including the pharmaceutical industry, which is the focus of the present study, have traditionally used the perforated plate distributor for fluid bed drying. This design however, can lead to dead zones between orifices, uneven air distribution across the bed and overall poor bed utilization [1]. The Dutch weave mesh and the punched plate represent alternative distributor designs that have been implemented in order to overcome the operational concerns associated with the perforated plate. The Dutch weave mesh consists of wires, typically of two different sizes, that are woven to create small, curved, triangular openings. These fine apertures eliminate the potential for dead zones between orifices, as well as solids backflow. However, the small bubbles generated by the weave may not carry sufficient energy to fluidize the larger particles in the bed [2]. This may result in particle segregation or even zones of defluidization depending on fluidization conditions. The punched plate imparts a lateral direction to the gas flow through the introduction of horizontal gas jets. These gas jets generate a swirling motion in the lower regions of the fluidized bed that leads to more thorough mixing of solids [3]. Few comparative studies regarding the influence of distributor design on fluidized bed
*Corresponding author: [email protected]
ISSN: 0975-833X
Available online at http://www.journalcra.com
International Journal of Current Research Vol.
Article History:
Received 18th
July, 2012 Received in revised form 20th
August, 2012 Accepted 24th
August 2012 Published online 30th
September 2012
Key words:
Conical fluidized bed dryer,
Placebo granulate, bed hydrodynamics, Drying kinetics.
RESEARCH ARTICLE
THE EFFECT OF DISTRIBUTOR DESIGN ON HYDRODYNAMICS OF CONICAL
FLUIDIZED BED DRYER
Harekrushna Sutar and Vikas Kumar
Engineering Department, National Institute of Technology, Rourkela, 769008, Odisha, India
ABSTRACT
The paper presents the comparative study of hydrodynamics of conical
types of distributor plates have been used .The influence of perforated plate , punched plate and dutch weave mesh distributor designs on fluidized bed dryer hydrodynamics was investigated for a range of bed loadings and superficial gas velocities. The placebo granulates was used as fluidized material. Wet bed loadings of 1, 3 and 5 kg were used with initial static bed heights of 12, 22 and 30 cm respectively. Gas velocity used are 1.5 and 3 m/s. Standard deviation and power spect
the pressure fluctuations were used to analyse the hydrodynamic behaviour of the bed during the drying process. The analysis shows punched plate giving improved performance over the other designs at a gas velocity of 1.5 m/s and bed loadings greater than 1.0 kg.
Copy Right, IJCR, 2012, Academic Journals
bed is the gas distributor. The role of the distributor is to evenly distribute the fluidization gas across the bed inlet and hence to initiate solids contacting. Various distributor designs have been created to improve on the operational concerns that can be encountered in fluidized bed processes. These designs can influence the bed hydrodynamics and therefore potentially alter the rate of heat and mass transfer in fluidized bed processes, including dryers. Many industries, including rmaceutical industry, which is the focus of the present study, have traditionally used the perforated plate distributor for fluid bed drying. This design however, can lead to dead zones between orifices, uneven air distribution across the bed oor bed utilization [1]. The Dutch weave mesh and the punched plate represent alternative distributor designs that have been implemented in order to overcome the operational concerns associated with the perforated plate. res, typically of two different sizes, that are woven to create small, curved, triangular openings. These fine apertures eliminate the potential for dead zones between orifices, as well as solids However, the small bubbles generated by the may not carry sufficient energy to fluidize the larger particles in the bed [2]. This may result in particle segregation or even zones of defluidization depending on fluidization conditions. The punched plate imparts a lateral ough the introduction of jets. These gas jets generate a swirling motion regions of the fluidized bed that leads to more Few comparative studies regarding the influence of distributor design on fluidized bed
hydrodynamics have been put forth in literature [4 these studies, Ouyang and Levenspiel [5] were the first to introduce the concept of the swirling fluidization distributor plate. This study was later followed by the work of Chyang and Lin [7], which draws parallels to the distributor designs commonly employed in the pharmaceuti
study compares the hydrodynamics induced by a perforated plate versus a multi-horizontal nozzle design. The multi horizontal nozzle design created a swirling flow pattern which greatly improved fluidization quality as compared to the perforated plate. Smaller and more frequent bubbles were generated due to the unpredictable detachment of bubbles from the swirling jets created by the horizontal nozzle orientation. This limits bubble coalescence, thus improving gas-solids contacting in the fluidized bed.
The study of Chyang and Lin [7] has illustrated the relative influence of distributor designs on dry bed hydrodynamics. While these results may be used to infer the potential influence of the distributor design on fluidized bed dryer
there have been no such studies that have examined this directly. Therefore, the current study focuses on the influence of the Dutch weave mesh, perforated plate and punched plate distributor designs on the hydrodynamics resulting from the fluidized bed drying of pharmaceutical granulate.
MATERIALS AND METHODS
A. Granulation
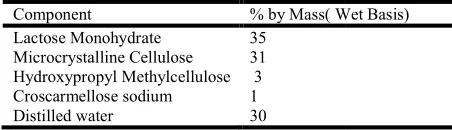
The placebo granulate was comprised of the ingredients tabulated in Table 1. The detailed description of the apparatus and the granulation procedure are explained in literature [8].
Available online at http://www.journalcra.com
ternational Journal of Current Research
Vol. 4, Issue, 09, pp.168-172, September,2012
INTERNATIONAL
OF CURRENT RESEARCH
THE EFFECT OF DISTRIBUTOR DESIGN ON HYDRODYNAMICS OF CONICAL
Engineering Department, National Institute of Technology, Rourkela, 769008, Odisha, India
The paper presents the comparative study of hydrodynamics of conical fluidized bed dryer. Three types of distributor plates have been used .The influence of perforated plate , punched plate and dutch weave mesh distributor designs on fluidized bed dryer hydrodynamics was investigated for a range of ial gas velocities. The placebo granulates was used as fluidized material. Wet bed loadings of 1, 3 and 5 kg were used with initial static bed heights of 12, 22 and 30 cm respectively. Gas velocity used are 1.5 and 3 m/s. Standard deviation and power spectrum analysis of the pressure fluctuations were used to analyse the hydrodynamic behaviour of the bed during the drying process. The analysis shows punched plate giving improved performance over the other
, Academic Journals. All rights reserved.
hydrodynamics have been put forth in literature [4-7]. Of nd Levenspiel [5] were the first to introduce the concept of the swirling fluidization distributor plate. This study was later followed by the work of Chyang and Lin [7], which draws parallels to the distributor designs commonly employed in the pharmaceutical industry. This study compares the hydrodynamics induced by a perforated horizontal nozzle design. The multi-horizontal nozzle design created a swirling flow pattern which greatly improved fluidization quality as compared to forated plate. Smaller and more frequent bubbles were generated due to the unpredictable detachment of bubbles from the swirling jets created by the horizontal nozzle orientation. This limits bubble coalescence, thus improving
fluidized bed.
The study of Chyang and Lin [7] has illustrated the relative influence of distributor designs on dry bed hydrodynamics. While these results may be used to infer the potential influence of the distributor design on fluidized bed dryer performance, there have been no such studies that have examined this directly. Therefore, the current study focuses on the influence of the Dutch weave mesh, perforated plate and punched plate distributor designs on the hydrodynamics resulting from the
idized bed drying of pharmaceutical granulate.
MATERIALS AND METHODS
The placebo granulate was comprised of the ingredients . The detailed description of the apparatus and the granulation procedure are explained in
Table: I. Components for formation of plcebo granules
B. Fluid Bed Apparatus
The fluidized bed used in this study has product bowl cone entrance angle of 19° with a 0.155 m inlet diameter and a 0.315 m outlet diameter and 0.95 m height. Provisions are made for control of both inlet air temperature and superficial gas velocity. The relative humidity of the air drawn by the fluidized bed was 25 ± 2% under ambient conditions.Dense bed pressure fluctuations, product temperature and moisture content were measured to monitor the drying process. Pressure fluctuations were measured using a single high frequency piezoelectric dynamic pressure transducer. The pressure transducer was flush mounted to the inner wall of the conical bed 9 cm above the distributor plate. Pressure fluctuation data was collected at 400 Hz and filtered between 0.5 and 170 Hz. The product temperature was measured with a thermocouple immersed in the dense region of the fluidized bed. Finally, the moisture content of the granulate was determined by taking samples through a sample thief. The granulate samples were analyzed for moisture content (loss after drying) using a moisture balance p
Harekrushna sutar and Abanti Sahoo[12].
C. Distributor Design
The three distributor designs that were investigated are illustrated in Fig.1 along with enhanced details of their design. The Dutch Weave mesh distributor was a 24 x 110 mesh. The weave creates openings that are triangular shaped with base and height dimensions of approximately 25 and 90 µm, respectively. Using microscopy, the percent open area was estimated to be 15 ± 1%. The perforated plate distributor design consisted of 256 holes of 2.7 mm diameter drilled on a 7.5 mm square pitch. This design resulted in an open area of 9.5%. Finally, the punched plate was designed with hooded openings of 5.75 mm by 1 mm. The openings were orientated in a circular pattern with 3 mm between adjacent rings. This orientation is designed to produce a swirling effect in the bed. The open area calculated based on these openings was 9.6%. It is important to note that these high percent open areas are typical of pharmaceutical fluidized bed dryers.
D. Operating Conditions.
Wet bed loadings of 1.0, 3.0, and 5.0 kg were used which resulted in initial static bed heights of 12, 22, and 30 cm, respectively.
Component % by Mass( Wet Basis)
Lactose Monohydrate 35 Microcrystalline Cellulose 31 Hydroxypropyl Methylcellulose 3 Croscarmellose sodium 1
Distilled water 30
or formation of plcebo granules
The fluidized bed used in this study has product bowl cone angle of 19° with a 0.155 m inlet diameter and a 0.315 m outlet diameter and 0.95 m height. Provisions are made for control of both inlet air temperature and superficial gas velocity. The relative humidity of the air drawn by the under ambient conditions.Dense bed pressure fluctuations, product temperature and moisture content were measured to monitor the drying process. Pressure fluctuations were measured using a single high frequency piezoelectric dynamic pressure transducer. The pressure transducer was flush mounted to the inner wall of the conical bed 9 cm above the distributor plate. Pressure fluctuation data was collected at 400 Hz and filtered between 0.5 and 170 Hz. The product temperature was measured with mersed in the dense region of the fluidized bed. Finally, the moisture content of the granulate was determined by taking samples through a sample thief. The granulate samples were analyzed for moisture content (loss after drying) using a moisture balance predicted by
The three distributor designs that were investigated are illustrated in Fig.1 along with enhanced details of their design. The Dutch Weave mesh distributor was a 24 x 110 The weave creates openings that are triangular shaped with base and height dimensions of approximately 25 and 90 µm, respectively. Using microscopy, the percent open area was estimated to be 15 ± 1%. The perforated plate distributor 6 holes of 2.7 mm diameter drilled on a 7.5 mm square pitch. This design resulted in an open area of 9.5%. Finally, the punched plate was designed with hooded openings of 5.75 mm by 1 mm. The openings were orientated adjacent rings. This orientation is designed to produce a swirling effect in the bed. The open area calculated based on these openings was 9.6%. It is important to note that these high percent open areas are
Wet bed loadings of 1.0, 3.0, and 5.0 kg were used which resulted in initial static bed heights of 12, 22, and 30 cm,
A. Dutch Weave Mesh
B. Perforated Plate
[image:2.612.68.294.77.142.2]C. Punched Plate
Fig .1 Designing of Distributor Plates
The two higher bed loadings were fluidized by air at superficial gas velocities of 1.5 and 3.0 m/s. The 1.0 kg bed loading was fluidized at 1.5 m/s only because operation at 3.0 m/s resulted in a high rate of particle entrainment. This the depletion of a distinct dense bed phase rendering a fluidization state not appropriate for this study. Elevated velocities of 2.0 and 3.5 m/s were required for the first ten minutes of the 1.5 and 3.0 m/s drying experiments, respectively, in order to properly fluidize the wet granulate. The need for these elevated velocities was based on visual observation through a sight-glass in the product bowl. It should also be noted that pressure fluctuations could not be obtained for the 1.0 kg bed loading
loading resulted in a shallow bed where the pressure sensor was inadequately covered by material in the dense region of the fluid bed. The results obtained from the 3.0 and 5.0 kg bed loading experiments will therefore be used to inf the influence of distributor design on the dryer performance in the 1.0 kg bed loading experiments.
air was heated to 65ºC with the end of drying being attained when the product temperature reached 40ºC. When dried, the static beds heights of the bed loadings noted above are approximately 8, 15, and 21 cm, respectively. The particle
% by Mass( Wet Basis)
A. Dutch Weave Mesh
B. Perforated Plate
C. Punched Plate
Distributor Plates
size distributions of the granulate from each of the distributor design experiments are very similar with modes of 250 and 3500 μm and an average mean mass diameter of 258 ± 8 μm. The particle density of the dry granulate is 830 kg/m3.This results in a Geldart particle classification in the B/A transition region. Each experimental run was repeated twice to test the reproducibility of the data.
RESULTS
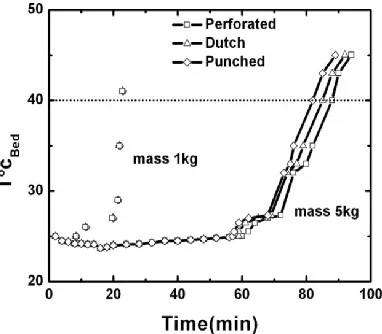
Conventional dryer monitoring techniques, including product temperature and moisture content profiles, were used along with pressure fluctuations to analyze dryer performance. As illustrated by representative product temperature profiles from 1.5 m/s drying (see Fig.2), differences between distributors begin to emerge as bed loading is increased from 1.0 to 5.0 kg. The punched plate distributor dries the 5.0 kg load fastest, followed by the Dutch weave then the perforated plate. The respective drying times based on product temperature endpoint determination are 81, 85 and 88 minutes, respectively. Moisture content profiles also support this trend. Fig.3 illustrates the average moisture content for both the 1.0 and 5.0 kg bed loadings dried at 1.5 m/s. For the 1.0 kg bed loading, the drying curves are virtually identical for the different distributor designs. As bed loading is increased, a separation in the drying profiles between the punched plate and the other designs appear between the 25 and 60 minute mark. This difference in moisture content profiles is carried throughout the drying process. The 3 kg bed loading dried at 1.5m/s behaves similarly to that of the 5.0 kg bed loadings. Under 3.0 m/s drying conditions, product temperature and moisture profile are similar between distributor designs for both the 3.0 and 5.0 kg bed loadings.
In order to better quantify dryer performance for all the conditions studied, the arithmetic average of the drying times of duplicate experiments for a given experimental condition was determined. The average drying times were then normalized based on the lowest average drying time amongst the distributor designs at specific bed mass and velocity. The normalized drying times are summarized in Table.II. These times signify that for a 1.0 kg bed loading dried at 1.5 m/s there is negligible difference in performance between the distributor designs as the average normalized times are within 3% of one another.
[image:3.612.318.540.77.306.2]
Fig.2. Product Temperature profile at drying velocity 1.5m/s
Table II. Characteristics for normalizing drying times
Type of Distributor Bed Mass in Kg
U=1.5m/s U=3.0m/s
1.0 3.0 5.0 3.0 5.0
Dutch Weave 1.00 1.03 1.07 1.01 1.03
Perforated 1.03 1.06 1.10 1.00 1.00
[image:3.612.340.530.338.478.2]Punched 1.00 1.00 1.00 1.03 1.02
Fig. 3. Moisture Content Profiles for drying velocity 1.5m/s
Fig.4. Standard Deviation of Pressure Fluctuation for 5.0 kg bed loading
However, as the bed loading increases to 5.0 kg, favourable bed hydrodynamics induced by the punched plate distributor design are more evident. The Dutch weave and the perforated plate distributors lead to drying times that are 7 and 10% longer, respectively, than the punched plate. Under 3.0 m/s drying conditions, the average normalized drying times between distributor designs for both the 3.0 and 5.0 kg wet bed loadings are within 3% of each other. This suggests that increasing the fluidization velocity results in similar fluid bed hydrodynamics between distributor designs at high bed loadings. Standard deviation and power spectrum analysis of the pressure fluctuations were also used to analyze the hydrodynamic behaviour of the bed during the drying process. Fig.4 is a representative profile of the standard deviation of the dense bed pressure fluctuations for 5.0 kg bed loadings dried with each distributor design. The standard deviation of the pressure fluctuations demonstrates a sigmoid like profile over the drying process for all distributor types. In the early stages of drying, the standard deviations are relatively low and constant. Eventually, the pressure
[image:3.612.63.254.546.713.2]fluctuations begin to increase steadily until another constant state is reached. This signifies that moisture removal is slowing and that the endpoint of drying is close. The profiles of the standard deviation of the pressure fluctuations are different between distributors for the 1.5 m/s drying velocity. Initially, the standard deviation profiles are
constant, but after the 34 minute mark of the drying process the standard deviation begins to increase for the punched plate. Increases in the standard deviation profiles of the perforated plate and Dutch weave mesh do not occur until after 44 and 48 minutes into drying, respectively. In addition, the standard deviation profile for the punched plate is larger in magnitude throughout the drying process as compared to the other designs. Similar to the 5.0 kg bed loading data, the standard deviation for the 3.0 kg bed loading dried at 1.5 m/s takes on a sigmoid like curvature with the standard deviation profile of the punched plate increasing before the other designs. Under the higher drying velocity conditions of 3.0 m/s, little to no difference in the standard deviation of the pressure fluctuations occurs.
Using power spectral density analysis, details regarding the hydrodynamic behaviour throughout the drying process were also examined. In the early stages of the drying process (Fig. 5(A)), the punched and perforated plates exhibit similar hydrodynamic behaviour with a dominant frequency of 5.2 Hz and a secondary frequency of 0.7 Hz. The dominant frequency represents the bubbling frequency in the bed where the secondary frequency is associated with the step wise movement of particles down the wall of the bed
observed visually at approximately this frequency. The Dutch weave does not display a distinct dominant bubbling frequency; however, it does exhibit the same low frequency movement of material at the bed wall. At the 32 minute mark, differences in the hydrodynamic behaviour are evident.
Fig. 5 (A). 16 minutes into drying
Fig.5 (B). 32 minutes into drying
fluctuations begin to increase steadily until another constant at moisture removal is slowing and that the endpoint of drying is close. The profiles of the standard deviation of the pressure fluctuations are different between distributors for the 1.5 m/s drying velocity. Initially, the standard deviation profiles are all relatively constant, but after the 34 minute mark of the drying process the standard deviation begins to increase for the punched plate. Increases in the standard deviation profiles of the perforated plate and Dutch weave mesh do not occur until 44 and 48 minutes into drying, respectively. In addition, the standard deviation profile for the punched plate is larger in magnitude throughout the drying process as compared to the other designs. Similar to the 5.0 kg bed loading data, the tion for the 3.0 kg bed loading dried at 1.5 m/s takes on a sigmoid like curvature with the standard deviation profile of the punched plate increasing before the other designs. Under the higher drying velocity conditions of 3.0 in the standard deviation of the
Using power spectral density analysis, details regarding the hydrodynamic behaviour throughout the drying process were also examined. In the early stages of the drying process (Fig. 5(A)), the punched and perforated plates exhibit similar viour with a dominant frequency of 5.2 Hz and a secondary frequency of 0.7 Hz. The dominant frequency represents the bubbling frequency in the bed where the secondary frequency is associated with the step wise movement of particles down the wall of the bed that was observed visually at approximately this frequency. The Dutch weave does not display a distinct dominant bubbling frequency; however, it does exhibit the same low frequency movement of material at the bed wall. At the 32 minute mark,
n the hydrodynamic behaviour are evident.
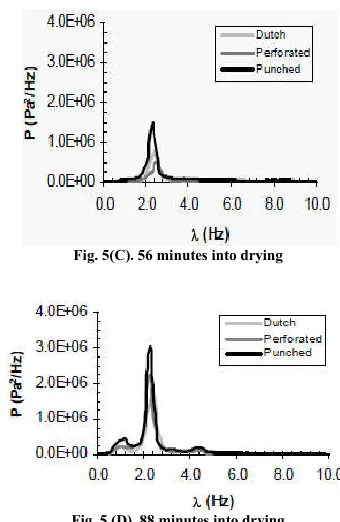
Fig. 5(C). 56 minutes into drying
[image:4.612.347.517.56.317.2]Fig. 5 (D). 88 minutes into drying
Fig. 5. Power spectrum for 5.0 kg loading Dried at 1.5 m/s
The punched plate exhibits a power spectrum that is stronger in intensity and contains a dominant frequency that is slightly higher than the dominant frequencies of the perforated plate and Dutch weave designs. The dominant frequency of the punched plate is 5.2 Hz whereas the frequencies are 4.9 and 4.7 Hz for the perforated plate and Dutch weave designs, respectively. Figs. 5(C) represents the middle to latter portion of the drying period. The power associated with the power spectrums is a scale of magnitude larger than seen in the earlier stages of the drying process. This increase in power is attributed to larger fluctuations in the bed as moisture is removed (see Fig.4). The dominant frequencies have also shifted from a higher to lower frequency indicati bubble coalescence has increased. Differences in the power spectrums between distributor designs still exist, with the punched plate illustrating a higher power bubbling frequency as compared to the other designs. Finally, Fig.5(D) compares the hydrodynamic behaviour between distributor designs during dry bed operation. The power spectrums of the different distributors are very similar indicating that distributor design has no influence on hydrodynamics under these conditions. The most likely reason
significant amount of excess gas in the system which results in a high degree of bubble coalescence and therefore negating the impact of the distributor on the system. Similar to the standard deviation analysis for the 3.0 m/s drying experiments, no differences in drying hydrodynamics exist between distributor designs when the fluidization velocity is elevated to 3.0 m/s.
DISCUSSION
It is believe that similar to the horizontal nozzle distributor used by Chyang and Lin [7], the punched plate promotes the formation of a swirling flow pattern via horizontal gas jets which in turn promotes lateral gas mixing. Horizontal gas jets
56 minutes into drying
88 minutes into drying
5. Power spectrum for 5.0 kg loading Dried at 1.5 m/s
The punched plate exhibits a power spectrum that is stronger in intensity and contains a dominant frequency that is slightly higher than the dominant frequencies of the perforated plate and Dutch weave designs. The dominant frequency of the s 5.2 Hz whereas the frequencies are 4.9 and 4.7 Hz for the perforated plate and Dutch weave designs, respectively. Figs. 5(C) represents the middle to latter portion of the drying period. The power associated with the power de larger than seen in the earlier stages of the drying process. This increase in power is attributed to larger fluctuations in the bed as moisture is removed (see Fig.4). The dominant frequencies have also shifted from a higher to lower frequency indicating that bubble coalescence has increased. Differences in the power spectrums between distributor designs still exist, with the punched plate illustrating a higher power bubbling frequency as compared to the other designs. Finally, Fig.5(D) compares rodynamic behaviour between distributor designs during dry bed operation. The power spectrums of the different distributors are very similar indicating that distributor design has no influence on hydrodynamics under these conditions. The most likely reason for this is the significant amount of excess gas in the system which results in a high degree of bubble coalescence and therefore negating the impact of the distributor on the system. Similar to the standard deviation analysis for the 3.0 m/s drying iments, no differences in drying hydrodynamics exist between distributor designs when the fluidization velocity is
[image:4.612.87.268.440.729.2] [image:4.612.87.264.441.576.2]produce bubbles from their tips as they penetrate the bed [9]. Due to the presumably random nature of the jet formation and subsequent bubble detachment, bubble coalescence is reduced resulting in a higher bubbling frequency. The punched plate illustrates this higher frequency bubbling phenomenon (see Fig. 5(B)) and also demonstrates improved lateral gas mixing through the larger magnitude of its standard deviation profile; improved lateral gas mixing explains the increase in pressure fluctuations with the presence of a higher bubbling frequency as less attenuation of the pressure wave occurs due to the presence of bubbles closer to the bed wall where the sensor is located. The smaller, more frequent bubbles along with the improved lateral gas mixing generated in this portion of the drying period explains the improved dryer performance for 3.0 and 5.0 kg bed loadings dried at 1.5 m/s with the punched plate. The similarities in drying hydrodynamics between distributor designs at 3.0 m/s are thought to be related to improved radial gas dispersion with the perforated plate and Dutch weave distributors under such conditions. With these types of distributor designs, gas dispersion is more centralized at low gas velocities. This results in limited potential for lateral gas mixing in the fluidized bed [10]. However, as gas velocity increases, gas permeates to the periphery of the bed resulting in improved gas-solids contacting[11].
Conclusion
The present study has found that the punched plate distributor design provides shorter drying times than the Dutch weave and perforated plate designs when wet bed loadings of 3.0 kg and above are dried at superficial gas velocities typical of the pharmaceutical industry (1.0 to 1.5 m/s). This study was carried out on a laboratory scale fluidized bed dryer. It is possible that in larger diameter fluidized beds, such as clinical and production scale dryers, the positive influence of the punched plate may be more pronounced as bed loadings, and therefore bed depths, become greater.
APPENDIX
m: Bed mass, kg
Mbed:Granule moisture content (mass basis),
P : Frequency spectrum power, Pa2/Hz Tbed: Product temperature, °C
U : Superficial gas velocity at bed inlet, m/s λ : Frequency, Hz
σ: Standard deviation of pressure ,Pa
REFERENCES
Bauer,W.,Werther, J and Emig,G,1981,: Influence of gas distributor design on the performance of fluidized bed reactor.Ger. chem.. Eng.,4,291-298.
Carmello, D., Garrod, D.B., Pardocchi, M., Ioppi, M., and Foscolo, V: 2000, “Horizontal gas mixing in the distributor region of a fluidised bedreactor.”Chem.Eng. J.,76, 153-158.
Chaplin, G., Pugsley, T., and Winters, C. In :2004,
Fluidization XI, ed. Arena, U., Chirone, R., Miccio, M., Salatino, P., Engineering Foundation, New York, USA, 419-426.
Chyang, C-S., and Lin, Y-C., 2002 “A study in the swirling fluidization pattern.”J. Chem. Eng. Japan., 35, 503-512.
Garncarek, Z., Przybylski, L., Botterill, J.S.M., and Broadbent, C.J: 1997 “Aquantitative assessment of the effect of distributor type on particle circulation.”Powder Technol, 91, 209-216.
Geldart, D., and Baeyens,J. 1985,‘The design of distributors for gas-fluidized beds’ Powder Technology, vol.42.pp:67-78.
Masters ,K .in: Fluidization VII ,ed .Potter, O.E., Nicklin,D.J.,1992, Engineering Foundation, New York, USA, 56-72.
Merry, J.M.D:1971, “Penetration of a horizontal gas jet into a fluidised bed.”Trans. Instn. Chem. Engrs., 49, 189-195.
Ouyang,F.,and Levenspiel ,O, 1986.: Spiral distributor of fluidized beds. Ind. Chem. Process Des.Dev., 25,504-507.
Rowe, P.N., and Evans, T.J:1974, “Dispersion of tracer gas supplied at the distributor of freely bubbling fluidized beds.” Chem. Eng. Sci., 29, 2235-2246.
Sreenivasan.B. and Raghvan,, V.R.: 2002,Hydrodynamics of swirling fluidized bed .Chemical Eng. process, 41, 99-106.
Sutar,H., Sahoo,A:2011, Effect of Distributor-Orifice on Drying Kinetics in a Fluidized Bed Drier (EDODKFBD)," Int’l J of Chemical Engineering and Applications ,vol. 2, no. 5, pp. 346-351.