Munich Personal RePEc Archive
What Place does Luxembourg hold in
Global Value Chains?
Di Filippo, Gabriele
Banque centrale du Luxembourg
9 February 2018
Online at
https://mpra.ub.uni-muenchen.de/86235/
1
What Place does Luxembourg hold in Global Value Chains?
First Version: November 18, 2017 This Version: February 09, 2018
Gabriele Di Filippo
Department of Statistics, External Statistics Section Banque centrale du Luxembourg
Abstract
The paper analyses the place held by Luxembourg in global value chains (GVC) by relying on trade in value added data retrieved from OECD inter-country input-output tables, available over the period 1995-2011. The analysis is multifaceted as the role of Luxembourg in GVC is analyzed across 50 advanced and emerging market economies, at the country level, at the sector level and over time. Results show that Luxembourg acts as an important chain-link in GVC as evidenced by its strong upstream and downstream interconnections with other partner countries. Luxembourg is primarily a buyer of foreign value added and less a seller of domestic value added. The major part of Luxembourg’s GVC trading partners is located in Western Europe suggesting that the supply chain network is not global for Luxembourg but rather regional. Notwithstanding this, the share of East Asian and Eastern European emerging countries - albeit relatively low compared to advanced economies - is increasing over the period of analysis. A similar observation prevails for the geographical breakdown of the origin (destination) of foreign (domestic) value added for domestic (foreign) final demand at the end of the value chain. The analysis unveils that Luxembourg possesses a comparative advantage in GVC in the finance and insurance industry. It is from the latter sector that the country retrieves the most important share of value added from GVC participation.
Keywords: International trade, Global value chains, Gross trade statistics, Trade in value added statistics, Inter-country input-output tables
JEL codes: D57,F14, F20, F21, F23
Contact: [email protected]. Disclaimer: This paper should not be reported as representing the views of the Banque centrale du Luxembourg or the Eurosystem. The views expressed are those of the author and may not be shared by other research staff or policymakers in the Banque centrale du Luxembourg or the Eurosystem.
2
Table of Contents
1. Introduction ... 6
2. Importance of international trade for Luxembourg... 9
2.1 Trade dependence ... 9
2.2 Trade contribution to economic growth ... 10
2.3 Trade contribution to employment... 11
3. Data ... 12
3.1 From gross trade statistics... ... 12
3.2 ...to trade in value added statistics ... 15
4. Global value chains: the producers’ side ... 18
4.1 Domestic versus foreign value added shares of gross exports ... 18
4.2 Participation in global value chains ... 20
4.3 Position in global value chains ... 23
4.4 Geographical breakdown ... 25
4.5 Sectoral breakdown ... 27
4.6 Link between global value chain participation and foreign direct investment ... 33
4.7 Length of the sourcing chain versus length of the selling chain ... 34
5. Global value chains: the final consumers’ side ... 44
5.1 Who are the ultimate consumers of Luxembourg’s value added? ... 44
5.2 Where does foreign value added embodied in Luxembourg’s final demand come from? . 47 6. Conclusion ... 50
References ... 53
Appendix ... 62
A. Decomposition of gross exports ... 62
B. The measurement issue of double or multiple-counting in gross trade figures ... 68
C. Measuring trade in value added from inter-country input-output tables ... 71
D. Revealed Comparative Advantage based on domestic value added ... 86
E. Ultimate consumers of Luxembourg’s value added versus ultimate providers of foreign value added to Luxembourg’s final demand (finance and insurance sector) ... 88
3
Non-Technical Summary
Over the recent decades, the paradigm of international trade has changed. The lowering of trade
barriers as well as the reduction in transportation and communication costs allowed producers and notably
multinational companies to locate the various production stages of a product in different sites across the
world according to their competitive advantage. The production process has thus become more
geographically and vertically fragmented giving birth to global value chains. In global production chains,
intermediate products are shipped across countries multiple times, with each exporting country providing
some value added - often depending on its specialization - until the product is eventually imported for
final consumption. GVC have become a prominent feature of world trade as evidenced by the substantial
increase of worldwide trade flows in intermediate products compared to trade flows in final products.
Against this background, the paper analyses the place held by Luxembourg - a small open
economy - in the global value network vis-à-vis other advanced and emerging market economies. The
paper relies notably on trade in value added statistics retrieved from OECD inter-country input-output
tables, available over the period 1995-2011. The paper undertakes a multifaceted analysis by investigating
the role of Luxembourg in GVC within a sample of 50 advanced and emerging market economies, at the
country level, at the sector level and over time.
Results show that Luxembourg acts as an important chain-link in GVC as evidenced by its strong
upstream and downstream interconnections in GVC with other partner countries. Luxembourg trades a
larger amount of intermediate products imported from abroad while it exports a lower amount of
domestically produced intermediate products. This is generally the case of small open economies. The
latter usually source more intermediate products from abroad in GVC than larger economies where, given
their size, a longer part of the value chain is domestic and hence a higher share of intermediate products is
produced domestically.
The major part of Luxembourg’s GVC trading partners is located in Western Europe suggesting
that the supply chain network is not global for Luxembourg but rather regional. Notwithstanding this, the
share of East Asian and Eastern European emerging countries - albeit relatively low compared to
advanced economies - is increasing over the period of analysis. A similar observation prevails for the
geographical breakdown of the origin (destination) of foreign (domestic) value added for domestic
(foreign) final demand at the end of the value chain.
Eventually, the analysis shows that Luxembourg possesses a comparative advantage in GVC in
the finance and insurance industry. It is from the latter sector that the country retrieves the most important
4
Résumé Non Technique
Au cours des dernières décennies, le paradigme du commerce international a changé.
L’abaissement des barrières commerciales ainsi que les réductions des coûts de transport et de
communication ont permis aux producteurs et notamment aux entreprises multinationales de localiser les
différentes étapes de production d’un produit dans différents sites à travers le monde, en fonction de leur
avantage concurrentiel. Le processus de production est ainsi devenu plus fragmenté géographiquement et
verticalement, donnant naissance à des chaînes de valeur mondiales (en anglais, global value chains ou
GVC). Dans ces chaînes de production, les produits intermédiaires sont exportés plusieurs fois entre pays,
chaque pays exportateur apportant une valeur ajoutée dans la conception du produit - souvent en fonction
de sa spécialisation – jusqu’à ce que le produit soit finalement importé pour la consommation finale. Les
GVC sont devenues une caractéristique proéminente du commerce international, comme en témoigne la
progression substantielle des flux commerciaux de produits intermédiaires au niveau mondial par rapport
aux flux commerciaux de produits finis.
Dans un tel contexte, le document analyse la place du Luxembourg - une petite économie ouverte
- dans le réseau mondial des chaînes de valeur. A cette fin, le document s’appuie notamment sur des
données de commerce extérieur en valeur ajoutée (en anglais, trade in value added) extraites des tableaux
d’entrées-sorties inter-pays fournis par l’OCDE et disponibles sur la période 1995-2011. Le document
entreprend une analyse multiforme en analysant le rôle joué par le Luxembourg dans les GVC au sein
d’un échantillon de 50 économies avancées et émergentes, au niveau du pays, au niveau sectoriel et à
travers le temps.
Les résultats montrent que le Luxembourg joue un rôle important dans les chaînes de valeur
mondiales, comme en témoignent les fortes interconnexions avec ses pays partenaires en amont et en aval
des chaînes de valeur mondiales. Dans ces dernières, le Luxembourg importe plus de valeur ajoutée
étrangère qu’il n’exporte de valeur ajoutée domestique. C’est généralement le cas des petites économies
ouvertes qui, compte tenu de leur taille, s’appuient généralement plus sur l’importation de produits
intermédiaires en provenance de l’étranger dans les GVC. A contrario, dans les grandes économies
développées, une part plus importante de produits intermédiaires est produite au niveau domestique, étant
donné que leur taille leur permet d’avoir des chaînes de production domestiques plus longues.
Au sein des GVC, la majeure partie des partenaires commerciaux du Luxembourg est située en
Europe de l’Ouest, ce qui suggère que le réseau des chaînes de valeur est plutôt régional que mondial.
Malgré cela, la part des émergents d’Asie de l’Est et d’Europe de l’Est - bien que relativement faible par
5
prévaut pour la ventilation géographique de l’origine (la destination) de la valeur ajoutée pour la demande
finale domestique (étrangère) de produits finis, à la fin des chaînes de valeur.
Enfin, l’analyse montre que le Luxembourg possède un avantage comparatif sur les chaînes de
valeur mondiales dans le secteur de la finance et de l’assurance. C’est de ce dernier secteur que provient
la part la plus importante de valeur ajoutée du Luxembourg émanant de sa participation aux chaînes de
6
1. Introduction
Over the recent decades, the paradigm of international trade has changed. The lowering of trade barriers as well as the reduction in transportation and communication costs allowed producers and notably multinational companies to better optimize their production processes by locating the various production stages of a product in different sites across the world according to their competitive advantage. The production process has hence become more geographically and vertically fragmented giving birth to global value chains (a.k.a. global production chains or global value networks). In global production chains, intermediate products are shipped across countries multiple times, with each exporting country providing some value added - often depending on its specialization - until the product is eventually imported for final consumption. Gereffi and Fernandez-Stark (2011) define global value chains (GVC) as “the full range of
activities that firms and workers do to bring a product from its conception to its end use”. GVC
have become a prominent feature of world trade as evidenced by the substantial increase of worldwide trade flows in intermediate products compared to trade flows in final products (Miroudot et al. (2009),De Backer and Norihiko (2012), UNCTAD (2015)).
Against this background, the paper analyses the place held by Luxembourg - a small open economy - in the global value network vis-à-vis other advanced and emerging market economies. To this aim, the paper relies on trade in value added statistics retrieved from OECD inter-country input-output tables, available over the period 1995-2011. The paper undertakes a multifaceted analysis by investigating the role of Luxembourg in GVC within a sample of 50 advanced and emerging market economies1, at the country level, at the sector level and over time.
The paper highlights the following results. Across OECD countries, Luxembourg features the highest dependence to trade. Foreign trade contributes strongly to economic activity and domestic employment. Trade in intermediate products represents the majority of foreign trade in Luxembourg. In this regard, the country appears to be deeply integrated in GVC as it features the highest degree of GVC participation across the considered countries. Luxembourg’s GVC participation is characterized by a strong backward participation and a relatively low forward
1 The sample of selected advanced and emerging market economies covers the following countries: AT, AU, BE,
7
participation. This means that Luxembourg trades a larger amount of intermediate products imported from abroad while it exports a lower amount of domestically produced intermediate products. In other words, Luxembourg is primarily a buyer of foreign value added and less a seller of domestic value added. This is generally the case of small open economies. The latter usually source more intermediate products from abroad in GVC than larger economies where, given their size, a longer part of the value chain is domestic and hence a higher share of intermediate products is produced domestically. Moreover, Luxembourg’s GVC participation is characterized by an involvement in long, increasing and internationally-oriented production chains whether on the sourcing side or on the selling side. The country thus features strong upstream and downstream interconnections in GVC with other partner countries. This suggests that Luxembourg acts as an important chain-link in the global value network.
The major part of Luxembourg’s GVC trading partners is located in Western Europe (by order of importance, Germany, Belgium, Switzerland, France, the United Kingdom and Italy) implying that the supply chain network is not global for Luxembourg but rather regional. Notwithstanding this, the share of East Asian and Eastern European emerging countries - albeit relatively low compared to advanced economies - is increasing over the period of analysis.
At the sector level, Luxembourg’s GVC participation is concentrated in the finance and insurance industry. It is from this specific sector that the country retrieves the most important share of value added from GVC. This is notably evidenced by the position of this sector at the extremity of the GVC smile curve. The latter observation concurs with the fact that Luxembourg captures large benefits from GVC participation in the finance and insurance industry in terms of inward FDI, employment and economic activity.
In addition, the analysis shows that across the considered countries, Luxembourg possesses a revealed comparative advantage in GVC in the finance and insurance industry. This comparative advantage is maintained over time in the sample of countries.
8
industry. On the other side of the chain, the providers of foreign value added to Luxembourg’s final demand share similar geographical characteristics. However, at the sector level, the main providers of foreign value added to Luxembourg’s final demand originate primarily from business and real estate services and less from the finance and insurance sector. This suggests that the Luxembourg’s finance and insurance industry is able to satisfy domestic needs, in addition to foreign ones.
9
2. Importance of international trade for Luxembourg
2.1 Trade dependence
Chart 1 presents the average ratio of trade dependence for selected advanced and emerging market economies (EMEs) over the period 2000-2016. It also shows the evolution of this ratio for the years 1995, 2000, 2005, 2010 and 2015. Trade dependence represents the combined weight of total trade (gross exports and gross imports) in an economy as a percentage of GDP.
Chart 1: Trade dependence across countries
0% 50% 100% 150% 200% 250% 300% 350% 400% 450%
S
G
H
K
L
U
M
T IE
M
Y
S
K BE
H
U VN EE
N
L
T
H CZ SI
L
T
K
H CY
C
H LV
A
T
D
K IL SE
K
R PL FI
E
A
D
E
E
U IS
N
O PT CA CL
N
Z
M
X
ZA ES GR FR UK ID RU IT
O
E
C
D
C
N TR IN
A
U JP US BR
Exports of goods and services (% of GDP) Imports of goods and services (% of GDP) 1995 2000 2005 2010 2015
Source: World Bank (NE.EXP.GNFS.ZS for exports-to-GDP, NE.IMP.GNFS.ZS for imports-to-GDP), average over the period 2000-2016.
10
intermediate and re-export/re-import products, this means that one of these components could account for an important share of gross trade flows. With regard to this observation, potential explanations will be provided later in the paper.
2.2 Trade contribution to economic growth
Chart 2 focuses on the case of Luxembourg and presents the contribution of the various demand components to GDP: consumption (C), investment (I), changes in private inventory (dS) and net trade (X-M). The respective contributions of each GDP component are presented in percentage points so that the sum of the components is equal to the year-on-year growth rate of nominal GDP. For example, in 2016, nominal GDP grew by 4.18%. In percentage points (pp), the various demand components contributed to 0.30 for consumption, -0.21 for investment, 0.07 for changes in private inventory, 0.52 for government spending and 3.28 for net trade2.
Chart 2: Contribution to the year-on-year growth rate of nominal GDP for Luxembourg
-8% -6% -4% -2% 0% 2% 4% 6% 8% 10% 12%
2000 2001 2002 2003 2004 2005 2006 2007 2008 2009 2010 2011 2012 2013 2014 2015 2016 C I dS G X-M Nominal GDP (YoY growth rate)
Source: STATEC. For a given demand component A, the contribution in percentage points to the year-on-year growth rate of nominal GDP is calculated as follows: CA,t=(At-1/Yt-1)x[(At/At-1)-1] or equivalently, CA,t=(At-At-1)/Yt-1, with Y representing GDP. Notations: consumption (C), investment (I), changes in private inventory (dS), government spending (G), gross exports (X), gross imports (M), net trade (X-M).
Over the period 2000-2016, net trade stands as the most important demand component driving economic activity in Luxembourg. Indeed, for an average nominal GDP growth rate of
2 Note that gross imports and gross exports have opposite effects on GDP. Gross exports add to GDP while gross
11
3.37% from 2000 to 2016, the contribution of each demand component amounts to 0.74pp for consumption, 0.49pp for investment, 0.04pp for changes in private inventory, 0.53pp for government spending and 1.57pp for net trade. In other words, net trade accounts approximately for 46% of the average year-on-year nominal growth rate of GDP over the period 2000-2016.
2.3 Trade contribution to employment
The trade sector is also a substantial driver of employment in Luxembourg3. Indeed,
Chart 3 shows that on average, over the period 2000-2011, domestic employment sustained by foreign final demand accounts for 62.8% of total employment. According to OECD statistics4,
the sector that benefits the most from foreign final demand in term of employment is the finance and insurance industry.
Chart 3: Domestic employment sustained by foreign final demand across countries (in percent of total domestic employment)
0% 10% 20% 30% 40% 50% 60% 70%
L
U
M
T IE
E
E SK
H
U SI CZ CY CH BE
A
T
S
E IL
D
K LV FI NZ IS KR
N
L
D
E
P
L
C
L
C
A
N
O PT LT RU IT ES ID FR ZA KU GR TR AU XM CN BR IN JP US
Domestic employment sustained by foreign final demand-to-total domestic employment 1995 2000 2005 2010
Source: http://stats.oecd.org/, Industry and Services\ Structural Analysis Database (STAN)\ Input Output Database\ Trade in employment: Core Indicators, EMPN_FFDEM, average over the period 2000-2011 (based on available data).
Across countries, the share of employment sustained by foreign final demand is larger for small economies (e.g. Luxembourg, Malta, Ireland, Cyprus, etc.) and lower for larger economies
3 Similar evidence is found in Sousa et al. (2012), Arto et al. (2015), Rueda-Cantuche and Sousa (2016) and OECD
(2016a).
4 Source: http://stats.oecd.org/, Industry and Services\ Structural Analysis Database (STAN)\ Input Output Database\
12
(e.g. the United States, Japan, India, Brazil, China, etc.). This result is in line with OECD (2016a) which shows that the importance of trade for employment is influenced by the size of countries and also by the type of activity in which countries specialize in. Across OECD economies, Luxembourg features the largest share and is the unique country to present a share of domestic employment embodied in foreign final demand above 50%. Moreover, this share trends upward since 1995 for Luxembourg; an observation that differs across countries.
Altogether, the above observations suggest that Luxembourg retrieves a lot of benefits from international trade, in terms of economic activity and employment. The analysis of trade in value added statistics (sections 4 and 5) will provide some explanations for this observation.
3. Data
3.1 From gross trade statistics...
Gross trade figures are the standard and official measure of a country’s trade flows. Gross trade statistics measure trade by recording products crossing the national customs borders. For example, gross exports are defined as the sum of exports of domestic products and re-exports. Exports of domestic products cover goods and services processed in the domestic economy with the need of domestic intermediate products and/or the requirement of imports of intermediate products from foreign economies. Gross exports can thus include the value of any foreign intermediate products that are used in domestic production. Re-exports - in the sense of entrepot trade - are exports of foreign products in the same state as previously imported i.e. without further domestic processing or transformation5,6.
5 One should distinguish re-exports in the sense of entrepot trade from re-exports within global value chains. In the
case of re-exports as entrepot trade, the product does not undergo any transformation. In other words, re-export products do not contain any value added from the country that imported them and then re-exports them. Re-packing, splitting into lots, sorting or grading, marking and the like are not considered as undergoing the process of transformation (Lim (2013)). In the case of re-export within the global value chain, the product undergoes a transformation. In other words, re-export products within GVC contain domestic value added from the country that imported them as intermediate products from a foreign country for processing (or value adding) and then re-exports them back to the foreign country.
6 Similarly, gross imports of a country are defined as the sum of imports of foreign products and re-imports. Gross
13
A common criticism of gross trade data is that they disregard the fact that intermediate products used in the production process of a product and exported from one country may be imported from several other countries. In the presence of intermediate trade, gross trade data record several times the value of intermediate products traded between countries before the products actually reach the final consumer. In other words, gross trade data overstate the value that a country contributes to its exports, leading to a measurement issue illustrated by a double-counting or a multiple-double-counting of trade flows (Koopman et al. (2014)). As a consequence, along the value chain, the country of the final producer appears as capturing most of the value of products traded, while the role of countries providing intermediate products upstream can be overlooked7.
This argument is even more compelling given that intermediate trade has become a key feature of international trade (Miroudot et al. (2009),De Backer and Norihiko (2012), UNCTAD (2015)). Indeed, at the global level, the average share of intermediate products amounted to 56.91% of total trade (defined as exports plus imports of intermediate and final products) in 1995. This share grew at an average year-on-year rate of 0.7% over the period 1995-2011 to reach 63.42% of total trade in 2011. At the country level, the majority of foreign trade in goods and services deals with intermediate products (Chart 4). In the case of Luxembourg, the average share of intermediate products (exports plus imports of intermediate goods and services) over the period 2000-2011 amounts almost to 70% of foreign trade (exports plus imports of final and intermediate goods and services) while the share of final products represents only 30% of foreign trade (Chart 4). When reported to gross output8, Luxembourg features the highest percentage of
intermediate trade across the considered countries, with an average amount of trade in intermediate products equal to 72% of gross output over the period 2000-2011 (Chart 5).
foreign processing. As such, they do not contain any foreign value added. Conversely, re-import products within GVC contain foreign value added by a foreign country that imported them as intermediate products from a given country for processing and then re-exports them back to this latter country.
7 See Koopman et al. (2014), notably p. 467-469 and Appendix B.
8 Gross output is a much broader measure of economic activity than gross domestic product (GDP). Gross output
14
Chart 4: Gross trade in intermediate products versus gross trade in final products as a share of foreign trade
0% 10% 20% 30% 40% 50% 60% 70% 80% 90% 100%
R
U
N
O NL
K
R
M
Y
S
G LU FI IE ID CL ZC BE SK IN CN TH
H
U JP SE ZA DK RB EE CA AU MT S
I
L
V PL
V
N IT DE UK
A
T ES
F
R
U
S
M
X IL PT
C
H IS TR LT
N
Z
H
K
G
R
K
H CY
Trade in intermediate products-to-foreign trade (INT) Trade in final products-to-foreign trade (FNL) 1995 2000 2005 2010
Source: OECD-TiVA database (December 2016), average 2000-2011, based on available data. Calculations: INT=(EXGR_INT+IMGR_INT)/(EXGR+IMGR); FNL=(EXGR_FNL+IMGR_FNL)/(EXGR+IMGR).
Chart 5: Gross trade in intermediate products versus gross trade in final products as a share of gross output
0% 10% 20% 30% 40% 50% 60% 70% 80% 90% 100%
L
U IE
MY MT SG HU SK EE S
I
C
Z
V
N TH
K
H
N
O BE
C
Y SE
N
L FI
D
K
C
H AT IL
K
R LV CL
R
U IS CA
H
K LT
D
E
P
L
P
T ID
MX GR ZA ES UK FR IT ZN AU IN TR CN JP BR US
Trade in intermediate products-to-gross output (INT) Trade in final products-to-gross output (FNL) 1995 2000 2005 2010
Source: OECD-TiVA database (December 2016), average 2000-2011, based on available data. Calculations: INT=(EXGR_INT+IMGR_INT)/PROD; FNL=(EXGR_FNL+IMGR_FNL)/PROD.
15
activities9. The production process becomes geographically and vertically fragmented. This
implies that one key feature of world trade is that the final goods and services bought by final consumers are composed of intermediate products from various countries around the world, blurring the concept “made in a given country”, as products are actually “made in the world”.
Global Value Chains (GVC) describe this international functional and spatial fragmentation of production processes. Gereffi and Fernandez-Stark (2011) define GVC as “the full range of activities that firms and workers do to bring a product from its conception to its end
use”. GVC have become a prominent feature of world trade. Their development has been mainly driven by multinational enterprises (MNEs) in their pursuit of competitive advantage and profits. By carrying out specific parts of the production process in certain countries, costs are minimized through economies of scale as well as specialization, in addition to local cost advantages (e.g.
lower unit labor costs, tax benefits, etc.). Within the GVC process, intermediate products are shipped across borders multiple times, with each exporting country providing some value added, until the product is eventually imported for final consumption. Each time products cross national borders they are registered as gross trade flows, meaning that gross trade statistics double-count, triple-count or multiple-count international trade flows10.
3.2 ...to trade in value added statistics
To address the measurement issue in gross trade data, economists have developed methods and datasets to better estimate the value that a country contributes or adds to foreign trade flows. This is notably the case of trade in value added (TiVA) statistics11,12. Retrieved from
9 Outsourcing involves the contracting out of a business process (e.g. payroll processing, claims processing) and
operational and/or non-core functions (e.g. manufacturing, facility management, call center support) to another party. Offshoring is the relocation of a business process from one country to another; typically an operational process (such as manufacturing) or supporting processes (such as accounting). Grossman and Rossi-Handsberg (2008) favor the term “offshoring” to the more popular “outsourcing” when talking about GVC. Indeed, the latter suggests that tasks formerly performed in-house are now being purchased at arms-length, whereas the former implies that tasks formerly undertaken in one country are now being performed abroad. In other words, offshoring includes not only foreign sourcing from unrelated suppliers, but also the migration abroad of some of the activities conducted by a multinational firm.
10 To better understand the measurement issue of multiple-counting, see Appendix B.
11 For example, the OECD computes Trade in Value Added (TiVA) indicators from the OECD Inter-Country
16
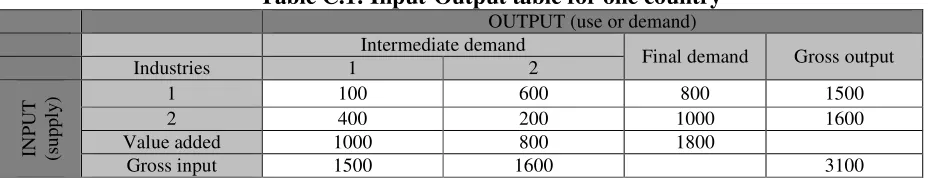
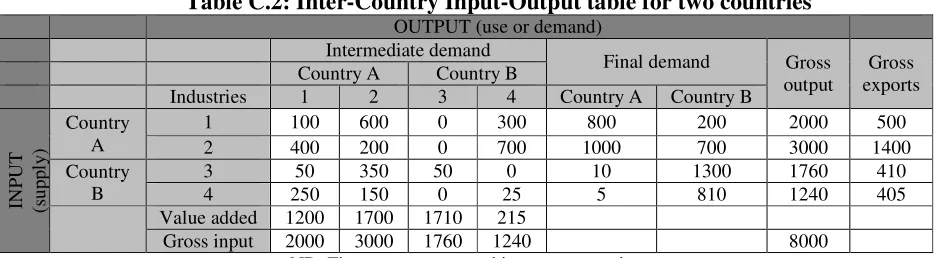
inter-country input-output tables13, TiVA data consider the value added by each country in the
production of goods and services that are consumed worldwide. As such, they allow for a better understanding of the role of an economy in international trade compared to gross trade statistics. In this regard, TiVA statistics provide a decomposition of the value of gross exports into several components. Chart 6 shows a basic example:
Chart 6: Basic decomposition of gross exports
Gross exports can first be decomposed into two main components: domestic value added and foreign value added. Domestic value added exports correspond to the domestic contribution to exported products. Foreign value added exports reflect the foreign contribution to exported products. The foreign value added stems from trade in intermediate products within the global value network14.
contributed to develop ICIO tables and related indicators: the European Commission’s World Input-Output Database (WIOD; http://www.wiod.org/home), the Asian Development Bank’s Input-Output Tables (https://www.adb.org/data/icp/input-output-tables), the UNCTAD’s Eora Multi-Region Input-Output (MRIO) database (http://worldmrio.com/), etc. For more information, see http://www.wiod.org/otherdb.
12 Caution is still required when using trade in value added statistics (Sturgeon (2015)). Indeed, the latter are
estimates and underlying data are not perfect owing to inconsistencies across countries and lack of complete bilateral trade in services data. In addition, several assumptions are used, notably the hypothesis that firms are treated as homogeneous. As a consequence, results must be interpreted with caution.
13 An inter-country input-output (ICIO) table is a combination of national input-output tables and trade data that
breaks down the use of goods and services according to the country of their origin (Powers (2012)).
14 Trade in intermediate products within the global value network refer to trade in intermediate goods and services
imported by the domestic country, processed in the domestic economy and then exported to third economies in the global value network.
Domestic value added content Foreign value added content
Indirect domestic value added
content Direct
domestic value added
content
Re-Imports
Re-imports
17
Domestic value added combines three components: direct domestic value added, indirect domestic value added and re-imports of domestic value added (Chart 6).
Direct domestic value added regroups domestic value added exported and directly consumed abroad plus domestic value added exported and processed in a foreign economy and directly consumed in this foreign economy. Direct domestic value added thus reflects the direct contribution made by a country in producing a product for export. The latter product does not imply trade in GVC as it does not require foreign intermediate products in its production process. Conversely, indirect domestic value added and re-imports involve trade flows in intermediate products between two or more countries within GVC. Indeed, indirect domestic value added includes intermediate products that the direct (or initial) foreign importer embodies into other intermediate products, which are then exported to third countries. Indirect value added thus reflects the indirect contribution of domestic supplier industries to the production of final goods and services. Re-imports cover the domestic value added content of intermediate exports that finally returns home. Re-imports thus reflect the domestic value added that was exported by a given country as intermediate products to a foreign country for further processing. Then, the former country re-imports this intermediate product for further processing in domestic industries or for final use.
The above components of gross exports can themselves be decomposed into further sub-components to reach the final decomposition of gross exports as introduced by Koopman et al. (2014) into nine sub-components15. Appendix A provides a detailed description of the latter
decomposition. This section stops at the above basic decomposition as it is necessary and sufficient to carry on the analysis.
To proceed with the analysis, the paper retrieves trade in value added statistics from OECD inter-country input-output (ICIO) tables. The latter are available for 62 countries and 34 industries over the period 1995-2011. The OECD produces ICIO tables based on different sources: the national accounts, the supply and use tables (SUTs), the national input-output tables (IOTs) and merchandise and services trade statistics16.
15 See Koopman et al. (2014), p. 482.
16 The national accounts gather the main components of expenditures (household and non-profit institutions serving
18
4. Global value chains: the producers’ side
4.1 Domestic versus foreign value added shares of gross exports
Chart 7 decomposes the average value of gross exports as shares of foreign value added17
and domestic value added18 for selected advanced and emerging market economies over the
period 2000-2011. The chart also presents the evolution of the foreign value added content in gross exports for the years 1995, 2000, 2005 and 2010 (given available data).
Within the selected sample of countries, Luxembourg presents the highest percentage of foreign value added content in gross exports and the least percentage of domestic value added content in gross exports. Thus, on average over the period 2000-2011, 56% (respectively, 44%) of Luxembourg’s gross exports consist in value that was added in a foreign country (respectively, in Luxembourg). This suggests a strong involvement of Luxembourg in GVC compared to the other countries in the sample.
Between 1995 and 2010, the share of foreign value added in gross exports has increased in Luxembourg. This pattern can be observed across a majority of advanced and emerging market economies (Chart 7). This suggests increasing international and vertical fragmentation of production at the global level.
and the imports (valued at cost, insurance and freight). The use tables - provided at purchasers’ price and at basic price - contain the products used by each industry in the domestic country and/or imported from abroad. The national input-output tables - provided at basic prices - contain the use and supply of goods and services industry-by-industry and/or product-by-product. The merchandise trade contains the exports and imports of goods including re-exports and re-imports. The services trade covers both inflows and outflows of services. For more details, see OECD (2015), “National Data Requirements for Inclusion in the Current TiVA Data Infrastructure”, December 2015, available at http://www.oecd.org/sti/ind/tiva/tivasourcesandmethods.htm.
17 The foreign value added content of gross exports corresponds to the value added of intermediate products that
were imported in order to produce intermediate or final products (goods or services) to be exported. The measure is also often referred to as vertical specialisation. Source: OECD, https://data.oecd.org/trade/import-content-of-exports.htm#indicator-chart. See Appendix A for further details.
18 The domestic value added content of gross exports is an estimation of value added, by an economy, in producing
19
Chart 7: Share of domestic versus foreign value added in gross exports (in percent)
0% 10% 20% 30% 40% 50% 60% 70% 80% 90% 100%
L
U
H
U SK
M
Y
M
T
C
Z IE
K
H SG EE SI
T
H KR
C
N
M
X
V
N BE
P
T FI DK SE
P
L IL
N
L
A
T
L
V
E
A ES
E
U IS FR
C
A
C
H IT CY GR TR DE
O
E
C
D LT
Z
A CL IN
U
K
H
K
N
Z
N
O
R
U ID US AU JP BR
Foreign added value in gross exports Domestic value added in gross exports 1995 2000 2005 2010
Source: OECD-TiVA database (December 2016), average 2002-2011, based on available data.
Chart 8 focuses on the case of Luxembourg and presents a decomposition of gross exports over the period 1995-2011. It shows the respective contributions of the components of gross exports to the year-on-year growth rate of gross exports (Chart 8.1) and the shares of the respective components in gross exports (Chart 8.2). The considered components are the ones defined in section 3.2: the direct domestic value added (EXGR_DDC), the indirect domestic value added (EXGR_IDC), re-imports (EXGR_RIM) and the foreign value added (EXGR_FVA).
Over the period 1995-2011, gross exports present a positive growth cycle in 1998-2000 and 2002-2008 (Chart 8.1). Gross exports faced four major downward shocks: a fall in 1997 potentially explained by the global economic slowdown in the aftermath of the Asian financial crisis (ECB (1999)), a fall in 2001 presumably related to the fall in global economic activity following the crash of the internet bubble in global stock markets, a slowdown in 2005 possibly due to a global economic slowdown in the background of a steep rise in oil prices (WTO (2005)) and a fall in 2009 in the wake of the 2007-2008 global financial crisis. From the first shock to the fourth one, the contribution of the components pertaining to trade flows within GVC
(EXGR_IDC, EXGR_RIM and EXGR_FVA) increased substantially. As a matter of fact, in 1997,
20
ECB (2016), IMF (2016)). Altogether, this suggests that over the period, trade flows within GVC are becoming more and more important in Luxembourg’s gross exports.
The latter argument agrees with the fact thatthe share of gross export flows within GVC
([EXGR_IDC+EXGR_RIM+EXGR_FVA]/EXGR) is increasing over the period 1995-2011 (Chart
8.2). From 52.04% in 1995, the latter share reaches 69.27% in 2011; hence an average growth rate of almost 2% a year over this period. Conversely, the share of gross exports outside GVC approximated by the direct domestic value added, amounted to 47.96% in 1995 and fell to 30.73% in 2011; hence an average growth rate equal to -2.60% a year over this period.
Chart 8: Decomposition of gross exports for Luxembourg Chart 8.1: Contribution to the year-on-year
growth rate in gross exports
-20% -10% 0% 10% 20% 30% 40% 1 9 9 6 1 9 9 7 1 9 9 8 1 9 9 9 2 0 0 0 2 0 0 1 2 0 0 2 2 0 0 3 2 0 0 4 2 0 0 5 2 0 0 6 2 0 0 7 2 0 0 8 2 0 0 9 2 0 1 0 2 0 1 1
EXGR_DDC EXGR_IDC EXGR_RIM EXGR_FVA
Chart 8.2: Share of gross exports
0% 10% 20% 30% 40% 50% 60% 70% 1 9 9 5 1 9 9 6 1 9 9 7 1 9 9 8 1 9 9 9 2 0 0 0 2 0 0 1 2 0 0 2 2 0 0 3 2 0 0 4 2 0 0 5 2 0 0 6 2 0 0 7 2 0 0 8 2 0 0 9 2 0 1 0 2 0 1 1 EXGR_DDC/EXGR EXGR_IDC/EXGR EXGR_RIM/EXGR EXGR_FVA/EXGR
Source: OECD-TiVA database (December 2016), based on available data. In Chart 8.1, the black line represents the year-on-year growth rate of gross exports.
4.2 Participation in global value chains
21
backward GVC participation) and the domestic value added embodied in third countries’ gross exports (a.k.a. forward GVC participation)19.
The backward GVC participation considers the importers’ perspective (or buyers’ perspective) of foreign value added. It assesses the amount of foreign value added embodied in intermediate products imported from a source country, included in exports and used in third countries’ exports. The forward GVC participation refers to the exporters’ perspective (or sellers’ perspective) of domestic value added. It gauges the amount of domestic value added embodied in a country’s exports that is used in other countries’ exports.
According to OECD (2012), the GVC participation index indicates the extent to which a country is involved in a vertically fragmented production process. In other words, the GVC participation index indicates the depth of GVC integration of a given country.
Chart 9 shows that Luxembourg possesses the strongest GVC participation across the considered countries, accounting for around 68% of its total gross exports on average over the period 2000-2011. This suggests that Luxembourg is deeply integrated in the global value network, as a substantial part of its exports consists in foreign intermediate products and domestically produced intermediate products used in third countries’ exports. Between 1995 and 2010, Luxembourg’s GVC participation has increased. This evolution is similar across the majority of selected advanced and emerging market economies. This implies that Luxembourg and to some extent, the other considered countries, are expanding their role in the global production network but at the same time are becoming more exposed to changes in external factors.
19 The forward GVC participation thus corresponds to a sub-component of the domestic value added in gross exports
22
Chart 9: GVC participation across countries (GVC integration depth)
0% 10% 20% 30% 40% 50% 60% 70% 80%
L
U SK
H
U
M
Y
C
Z
S
G
M
T EE
K
R IE SI BE FI NL
N
O
R
U SE DK IL
U
K
L
V PL
K
H AT
V
N
C
N CL
P
T
C
H DE
M
X
F
R ES
Z
A TH LT JP IT
H
K IS ID AU GR US YC CA IN TR NZ BR
Backward GVC participation Forward GVC participation 1995 2000 2005 2010
Source: OECD-TiVA database (December 2016), average 2000-2011, based on available data.
23
4.3 Position in global value chains
According to Koopman et al. (2014), the share of forward GVC participation relative to the share of backward GVC participation informs about the position of a country along the global value chain. If the forward participation is higher than the backward participation, the country is located more upstream in the production network i.e. in the first stages of production where it exports a lot of intermediate products abroad. Conversely, if the forward participation is lower than the backward participation, the country is positioned more downstream in the value chain i.e. specialized in the last stages of production where it imports a lot of intermediate products from abroad20.
A country’s position in the value chain usually depends on its comparative advantage and therefore the mix of labor skills and resource endowments it brings to the international production process (OECD (2016b)). In other words, a country can be upstream or downstream, depending on its specialization (OECD (2012)). Upstream activities usually relate to the production of raw materials or intangibles at the start of the production process (e.g. minimally processed or unprocessed materials, research and development, innovation, design, consulting, market intelligence, etc.). At the center of the value chain, countries are usually specialized in activities dealing with standardized, labor-intensive manufacturing jobs. At the end of the value chain, production activities become closer to final demand and usually regroup final assembly or customer services (e.g. logistics, distribution, etc.).
Chart 10 presents the average ratio of backward GVC participation-to-forward GVC participation over the period 2000-2011 together with its evolution for the years 1995, 2000, 2005 and 2010. Large economies (e.g. Japan, the United States, the United Kingdom, Germany) or countries that export commodities (e.g. Russia, Norway, Australia, Brazil, Chile, South Africa) are located on the right of the chart, hence more upstream in the value chain. Indeed, large economies import less intermediate products as a larger share is produced domestically, while commodity exporting countries export more intermediate products towards countries
20 Koopman et al. (2014) define the GVC position index as the log of the domestic value added embodied in third
24
located more downstream in the value chain. Conversely, small economies and in particular those that benefit from offshoring (e.g. Luxembourg, Cambodia, Hungary, Malta, Mexico, Ireland, China, Malaysia, Slovakia, Thailand, Czech Republic) are located on the left of the chart hence more downstream in the value chain. These countries thus import more intermediate products whose value has been added by other countries situated more upstream in the chain. Downstream countries add intermediate products and value towards the end of the global production process.
Chart 10: Ratio of backward GVC participation-to-forward GVC participation across countries (GVC position)
0 1 2 3 4 5 6 7
L
U KH
H
U
M
T
M
X IE
C
N
M
Y
S
K
T
H CZ EE
S
G PT SI
V
N CA
K
R CY
T
R
G
R ES
B
E IS FI SE PL
D
K IL NZ
N
L
A
T
F
R IT LV
C
H LT IN
D
E
Z
A
U
K
H
K CL
B
R ID
A
U US
N
O
R
U JP
1995 2000 2005 2010
Source: OECD-TiVA database (December 2016), average 2000-2011, based on available data.
25
4.4 Geographical breakdown
Given the strong GVC participation of Luxembourg, an important question pertains to the origin and destination of value added trade flows within GVC. Chart 11 provides a geographical breakdown of the origin of foreign value added and the destination of domestic value added. The charts are designed so that the buying side (Chart 11.1) sums up to the backward GVC participation, while the selling side (Chart 11.2) adds up to the forward GVC participation. As Luxembourg is primarily a buyer of foreign value added, the geographical breakdown into source countries could be of particular interest to identify which foreign sources add the most value to its exports.
On the buying side, on average over the period 2000-2011, the most important providers of foreign value added to Luxembourg within GVC are Germany (9.28%), Switzerland (5.96%), Belgium (5.52%), the United Kingdom (5.19%), the United States (5.14%), France (4.79%), Italy (3.71%) and the Netherlands (2.21%). The geographical origin of foreign value added is hence mostly European and in particular Western European. Indeed, on average over the period 2000-2011, 82% (respectively, 79%) of the foreign value added has been bought by Luxembourg from European economies (respectively, Western European economies)21. Notwithstanding this,
between 1995 and 2011, the most important average growth rates concerning the origin of foreign value added in gross exports are found for specific economies located in East Asia (e.g.
China, Hong Kong, India, Japan, Singapore and South Korea) and in Eastern Europe (e.g. Czech Republic, Hungary, Poland and Russia)22. This suggests that the geographical origin of foreign
value added evolves over time.
21 To be precise, European economies cover here Western European economies (AT, BE, CH, CY, DE, DK, ES, FI,
FR, GR, IE, IS, IT, MT, NL, NO, PT, SE, UK) and Eastern European economies (CZ, EE, HU, LT, LV, PL, RU, SI, SK).
22 Between 1995 and 2011, the average year-on-year growth rates in foreign value added originating from abroad
26
Chart 11: Origin and destination of trade in value added for Luxembourg Chart 11.1: Origin of foreign value added in gross exports:
Where does Luxembourg buy foreign value added?
0% 2% 4% 6% 8% 10% 12% D E C
H BE
U
K
U
S
F
R IT NL ES IE SE SG JP AT AC CN DK HK RU NO KR IN F
I P T P L C Z G R A
U BR
Z
A
H
U TR
M
Y IS ID CL SK TH MX CY EE VL SI IL KH LT LU MT NZ VN
1995 2000 2005 2010
Chart 11.2: Destination of domestic value added in gross exports: Where does Luxembourg sell its domestic value added?
0,0% 0,5% 1,0% 1,5% 2,0% 2,5% 3,0% 3,5% D E B E F
R IT IE CH
U
K
N
L
C
N ES
S
E
S
G US
A T D K H K C A R
U CZ PL JP
N
O KR FI PT
H U M Y M X T
R TH
G
R IS SK IN
Z
A
A
U BR ID CL
C
Y EE
L
V SI IL KH LT
L U M T N Z V N
1995 2000 2005 2010
Source: OECD-TiVA database (December 2016), average 2000-2011, based on available data.
27
most important average growth rates concerning the destination of Luxembourg’s value added are found for specific economies located in East Asia (China, Hong Kong and Singapore) and in Eastern Europe (Czech Republic, Hungary, Poland and Russia)23.
As a result, whether on the buying side or on the selling side, the importance of emerging economies located in East Asia (e.g. China, India) and in Eastern Europe (e.g. Czech Republic, Hungary, Poland, Russia) as value added trading partners of Luxembourg within GVC is increasing, although their share remains relatively small in comparison to advanced economies. The importance of trade in value added flows with Western European countries (by order of importance, Germany, Belgium, Switzerland, France, the United Kingdom and Italy, when adding the respective country’s shares in Charts 11.1 and 11.2) suggests that distance appears to matter in shaping bilateral value added trade flows in GVC24 and also that the supply chain
network is less global for Luxembourg but rather regional. The latter observation prevails also for other countries reviewed in the literature (Fontagné and Santoni (2017))25.
4.5 Sectoral breakdown
GVC participation across sectors
Chart 12 provides a decomposition of Luxembourg’s GVC participation at the sector level26. Luxembourg’s GVC participation is concentrated in the services sector and in particular
in the finance and insurance industry, revealing the country’s specialization. The finance and
23 Between 1995 and 2011, the average year-on-year growth rates in domestic value added going abroad amount to
10% for East Asia (China, Hong Kong, and Singapore), 8% for Eastern Europe (Czech Republic, Hungary, Poland and Russia), 5% for Western Europe (Austria, Belgium, Denmark, Finland, France, Germany, Greece, Ireland, Italy, the Netherlands, Norway, Portugal, Spain, Sweden, Switzerland and the United Kingdom) and 2% for North America (Canada and the United States).
24 Johnson and Noguera (2012b) highlighted a similar result and suggest that gravity effects could prevail for value
added trade flows (Anderson (1979, 2011), Anderson and van Wincoop (2003), Head and Mayer (2013, 2014)). However, this remains to be tested empirically.
25 Notice that the United Kingdom is also an important GVC partner for Luxembourg, whether on the buying side or
on the selling side. Indeed, at the global level, the United Kingdom is the 4th most important provider of foreign
value added to Luxembourg (Chart 11.1) and the 7th most important destination of domestic value added (Chart
11.2). As a result, the consequences of the Brexit should probably be examined in light of the latter observation. Investigating this issue in details goes beyond the scope of the paper.
28
insurance industry is indeed the sector where most of the domestic value added is created from Luxembourg’s participation in the global value network.
Luxembourg’s exports in the finance and insurance sector are characterized by a high backward GVC participation (36%) and a lower forward GVC participation (23%). This means that the export content in finance and insurance products includes to a large extent foreign intermediate products.
Chart 12: GVC participation across sectors in Luxembourg (GVC depth across sectors)
36% 23% 0% 10% 20% 30% 40% 50% 60% 70% F in a n c e & i n su ra n c e T ra n sp o rt & t e le c o m W h o le sa le & r e ta il B u si n e ss & r e a l e st a te s e rv ic e s B a si c & f a b ri c a te d m e ta ls C h e m ic a ls & n o n -m e ta ll ic p ro d u c ts P e rs o n a l & c u lt u ra l se rv ic e s M a c h in e ry & e q u ip m e n t T e x ti le s & a p p a re l F o o d , b e v e ra g e s & to b a c c o W o o d , p a p e r & p u b li sh in g E le c tr ic a l & o p ti c a l e q u ip m e n t C o n st ru c ti o n A g ri c u lt u re & fo re st ry E le c tr ic it y , g a s & w a te r O th e r m a n u fa c tu re s & r e c y c li n g T ra n sp o rt e q u ip m e n t M in in g & q u a rr y in g
Backward GVC participation Forward GVC participation 1995 2000 2005 2010
Source: OECD-TiVA database (December 2016), average 2000-2011, based on available data.
In the finance and insurance sector, traditional intermediate products within the value chain are financial services and information. Firms involved in this value chain usually regroup private banks, asset management firms (e.g. investment funds), insurance companies, corporate cash management entities, etc. The activity of these firms boils down to raising funds by taking deposits or issuing securities and make loans or trade securities. The value chain goes from lenders to borrowers and the products can be divided into credit intermediaries and financial intermediaries27.
27 Note that domestic industries supporting the finance and insurance industry in Luxembourg (e.g. fiduciary
29
The importance of Luxembourg’s GVC participation in the finance industry goes hand in hand with its status as a global financial center, hosting for example one of the most important fund industry in the world. As a matter of fact, the fund industry manages EUR 3943 billion of assets in 2017Q2 (EFAMA (2017)), placing Luxembourg as the leading investment fund centre in Europe and the second one at the global level, just behind the United States where the fund industry manages EUR 17856 billion of assets28.
According to Bley (2015), in Luxembourg, the investment fund industry (a.k.a.
Organismes de Placements Collectifs (OPC)) and particularly mutual funds (a.k.a. Organismes de Placements Collectifs en Valeurs Mobilières (OPCVM)) contribute to the major part of trade in financial services.
Bley (2015) argues that financial services exports by the Luxembourg’s fund industry include the assignment to non-resident investors of all expenses incurred by investment funds regarding their assets holding. Such expenses cover the running costs of investment funds inherent to their assets holding activity and comprise management and advisory expenses, administrative fees, audit and accounting costs, marketing and legal expenses, custodian banks’ commissions, distributors’ costs, etc.). The expenses are actually paid by Luxembourg’s investment funds to resident companies, but are assigned to non-resident shareholders of mutual
funds. The latter expenses take part of the 23% of domestic value added exported by Luxembourg in the finance and insurance industry (Chart 12).
On the other hand, financial services imported by the Luxembourg’s fund industry reflect the expenses paid by Luxembourg’s management companies to their non-resident counterparts.
The major part of these expenses relates to advisory commissions, trading fees and distribution
costs paid to non-resident companies, either directly or indirectly through a resident management
company. According to Bley (2015), the latter commissions represent about three-quarters of the
total expenses incurred by Luxembourg’s investment funds. The latter expenses are included in
the 36% of foreign value added exported by Luxembourg in the finance and insurance industry (Chart 12).
28 See EFAMA (2017), Table 2 “Total net assets excluding funds of funds by the type of funds”, millions of euro,
30
From a historical perspective, the geographical fragmentation of the finance and insurance industry is not a new phenomenon. Indeed, most finance and insurance companies have globalized their activities to seek new customers and new markets abroad. This process can be explained by the considerable reduction of transport costs and the improvement of communications, stimulated by technological development like internet (Capelle-Blancard and Tadjeddine (2009), OECD (2012)). Notwithstanding this, what becomes more acute since the 1990s is the vertical fragmentation of the finance and insurance industry (Capelle-Blancard and Tadjeddine (2009), Mudambi and Venzin (2010), OECD (2012)). According to Mudambi and Venzin (2010), financial services firms are increasingly offshoring and outsourcing parts of their value adding activities in countries where they can find specific factor endowments (i.e. skilled labor force, processing capabilities, etc.) and reduce their costs (i.e. lower labor cost, tax benefit,
etc.).
Revealed comparative advantage across sectors
Trade in value added statistics allow refining the sectoral analysis by unveiling whether Luxembourg possesses a comparative advantage in the above considered sectors within the global value network. To this aim, the paper relies on the revealed comparative advantage (RCA) proposed by Balassa (1965)29. The latter indicator computes the ratio of domestic value added
exported within GVC by sector i in country c to the total domestic value added exported within GVC by country c (Xc,i,t/Xc,t) divided by the ratio of domestic value added exported within GVC
by sector i at the world level to the total domestic value added exported within GVC at the world
29 A similar analysis is implemented in Timmer et al. (2013) and van der Marel (2015). According to Timmer et al.
31
level (Xw,i,t/Xw,t). The domestic value added exported within GVC is equal to the forward GVC
participation i.e. the sum of indirect domestic value added (EXGR_IDC) and re-imports
(EXGR_RIM). Hence:
) _
_ (
) _
_ (
) _
_ (
) _
_ (
, ,
, , ,
,
, ,
, , ,
,
, , ,
, , ,
t w t
w t
i w t
i w
t c t
c t
i c t
i c t
w t i w
t c t i c t
RIM EXGR IDC
EXGR RIM
EXGR IDC
EXGR
RIM EXGR IDC
EXGR RIM
EXGR IDC
EXGR
X X
X X RCA
+ +
+ +
= =
According to Balassa (1965) and Balassa and Nolan (1989), a RCA index above (below) unity indicates that a country has a revealed comparative advantage (disadvantage). This paper believes that identifying any comparative advantage of a country based on a single ratio bears some limits. A more relevant approach would require a thorough analysis. This task goes however beyond the scope of this paper. As a result, we consider that a particular sector has a revealed comparative advantage in GVC if two conditions are fulfilled: first, the related RCA is above unity and second, the related RCA is the highest in the set of countries30. Table 1 presents
the GVC-related RCA index for Luxembourg. When the index is higher than unity, the table specifies the rank of Luxembourg in the sample of 50 advanced and emerging market economies.
30 An additional criteria could be the implementation of a one-sided right-tailed Student t-test to check whether the
value of the RCA is significantly higher than one (H0: RCA=1 versus H1: RCA>1). However, the paper ruled out this
32
Table 1: GVC-related Revealed Comparative Advantage for Luxembourg
1995 2000 2005 2010 Average
2000-2011
Sectors RCA Rank RCA Rank RCA Rank RCA Rank RCA Rank
Agriculture & forestry 0.28 0.21 0.20 0.22 0.17
Mining & quarrying 0.07 0.01 0.01 0.01 0.01
Food, beverages & tobacco 0.44 0.33 0.29 0.19 0.25
Textiles & apparel 0.38 0.27 0.32 0.20 0.26
Wood, paper & publishing 0.43 0.37 0.57 0.40 0.44
Chemicals & non-metallic products 0.24 0.16 0.10 0.08 0.11
Basic & fabricated metals 1.18 18th 0.81 0.28 0.35 0.50
Machinery & equipment 0.30 0.29 0.15 0.12 0.18
Electrical & optical equipment 0.07 0.04 0.14 0.07 0.07
Transport equipment 0.01 0.01 0.01 0.01 0.01
Other manufactures & recycling 0.18 0.08 0.04 0.08 0.06
Electricity, gas & water 0.29 0.20 0.16 0.37 0.48
Construction 0.72 0.85 1.27 30th 1.09 34th 1.10 37th
Wholesale & retail 0.58 0.34 0.45 0.96 0.58
Transport & telecom 0.78 0.74 0.56 1.53 20th 0.93
Finance & insurance 39.27 1rst 37.67 1rst 36.99 1rst 31.34 1rst 33.47 1rst
Business & real estate services 0.96 0.50 1.38 18th 1.39 15th 1.04 26th Personal & cultural services 4.29 3rd 1.77 21rst 1.54 15th 1.29 18th 1.45 20th
Source: Author’s calculations based on OECD-TiVA database (December 2016). The GVC-related RCA index is calculated based on the forward GVC participation (EXGR_IDC+EXGR_RIM) of each sector.
Table 1 shows that a lot of heterogeneity prevails across sectors regarding the value of the GVC-related RCA index. Over the period of analysis, the index passes below unity for the basic and fabricated metals industry while other sectors evidence the reverse (e.g. construction, business and real estate services). Some sectors present a GVC-related RCA higher than one but remain far from the first positions in term of ranking (e.g. construction, transport and telecom, business and real estate services, personal and cultural services31). One sector presents a revealed
comparative advantage in GVC that persists over time: the finance and insurance industry, where Luxembourg is ranked first throughout the considered period. Although not shown in Table 1, the main countries ranked behind Luxembourg in the finance and insurance industry are Cyprus (with a GVC-related RCA equal to 6.59 on average over the period 2000-2011), the United Kingdom (6.10), Switzerland (4.24), Hong Kong (2.97), Singapore (2.56), Ireland (2.32), Malta
31 In the sector of personal and cultural services, the most important component stems from “other community,