Invited Review
STATISTICAL GUIDELINES FOR THE ANALYSIS OF DATA OBTAINED FROM ONE OR BOTH EYES
Richard A. Armstrong
School of Life and Health Sciences: Ophthalmic Research Group, School of Optometry, Aston University, Birmingham, B4 7ET, UK.
Abstract
Measurements obtained from the right and left eye of a subject are often correlated whereas many statistical tests assume observations in a sample are independent. Hence, data collected from both eyes cannot be combined without taking this correlation into account. Current practice is reviewed with reference to articles published in three optometry journals, viz., ophthalmic and physiological optics (OPO), optometry and vision sciences (OVS), and clinical and experimental optometry (CEO) during the period 2009-2012. Of the 230 articles reviewed, 148/230 (64%) obtained data from one eye and 82/230 (36%) from both eyes. Of the 148 one-eye articles, the right eye, left eye, a randomly selected eye, the better eye, the worse or diseased eye, or the dominant eye were all used as selection criteria. Of the 82 two-eye articles, the analysis utilized data from: (1) one eye only rejecting data from the adjacent eye, (2) both eyes separately, (3) both eyes taking into account the correlation between eyes, or (4) both eyes using one eye as a treated or diseased eye, the other acting as a control. In a proportion of studies, data were combined from both eyes without correction. It is suggested that: (1) investigators should consider whether it is advantageous to collect data from both eyes, (2) if one eye is studied and both are eligible, then it should be chosen at random, and (3) two-eye data can be analysed incorporating eyes as a ‘within subjects’ factor.
Introduction
Clinical studies in optometry often collect data from either one or both eyes of a subject. A recent survey of ophthalmology journals, however, suggested a variety of different approaches both to eye selection in ‘one-eye’ studies and methods of analysis in ‘two-eye’ studies. Many studies did not describe clearly the procedures used or violated the statistical assumptions of independence of the data (Karakosta et al., 2012).
There are a number of issues raised by the decision to collect data from one or both eyes. First, if one eye per subject is studied, then how is that eye to be selected? Second, if data from both eyes are collected, how should the data be analysed? Measurements obtained from right and left eyes are usually correlated (Glynn and Rosner, 2012; Karakosta et al., 2012) whereas many statistical procedures, such as ‘t’ tests, analysis of variance (ANOVA), confidence intervals (CI), or linear regression assume that observations are an independent sample of the population (Sainani, 2010). An important problem in testing hypotheses is the possibility of making a Type 1 error, i.e., rejecting the null hypothesis (Ho) when it is true. Since, the variance between eyes is usually less
both eyes to be used explicitly in diagnosis.
The purpose of this article is to provide statistical advice for authors carrying out clinical studies in optometry which involves the question of whether to collect data from one or both eyes. First, current practice is reviewed with reference to articles published in three optometric journals, viz., ophthalmic and physiological optics (OPO), optometry and vision sciences (OVS), and clinical and experimental optometry (CEO) during the period 2009-2012. Second, statistical advice relevant to the analysis of data from both eyes is described in a variety of experimental contexts.
Methods
Journals
All of the articles published in three optometric journals, viz., OPO, OVS, and CEO in the period 2009-2012 were initially reviewed. Articles involving animal or laboratory studies were then eliminated. The remaining 230 articles were divided into two groups: (1) those in which data were collected from one eye only and (2) those in which data were collected from both eyes. In the one-eye studies, articles were classified according to how the eye was selected: viz., right eye, left eye, a randomly selected eye, dominant eye, better eye, i.e., eye with better visual acuity (VA), and worse or diseased eye. In the two-eye studies, articles were classified according to how the data were analysed: (1) using one eye only rejecting data from the fellow eye, (2) using both eyes but analysed separately, (3) using both eyes, the analysis taking into account the correlation between eyes, (4) using both eyes in which one eye is the 'treated' or ‘diseased’ eye, the other acting as a control, or (5) using data combined from both eyes but without correction for correlation.
Data analysis
Differences in the distribution of frequencies were compared among the three journals (totalled over years) and the four years of the study (totalled over journals) using chi-square (2
Results
Of the 230 articles reviewed for this study, published in the period 2009-2012, 148/230 (64%) obtained data from one eye and 82/230 (36%) obtained data from both eyes.
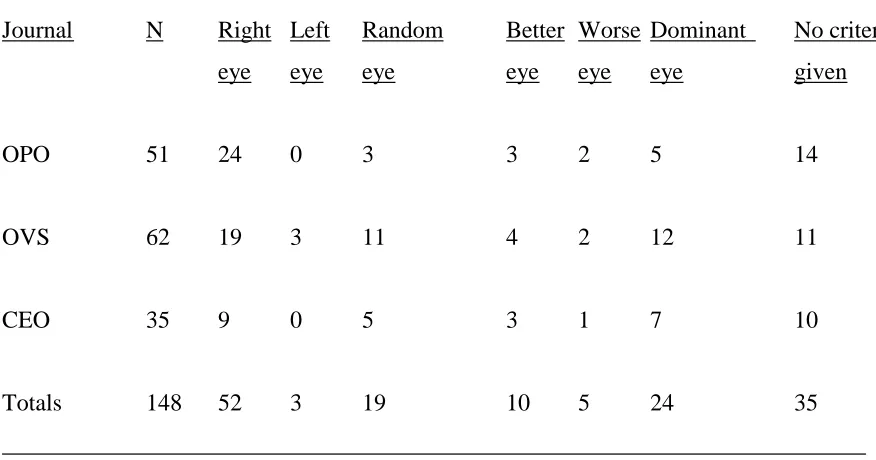
Of the 148 one-eye studies (Table 1), a variety of methods of selecting that eye were used: 52/148 (35%) selected the right eye, 3/148 (2%) the left eye, 19/148 (13%) a randomly selected eye, 34/148 (23%) the better or the worse/diseased eye, 5/148 (3%) the dominant eye, and in 35/148 (24%) no selection criteria were given. There were no significant differences in the distribution of these frequencies among journals (2 = 14.48, 12DF, P 0.30) or years (2
= 12.93, 15DF, P = 0.60).
Of the 82 two-eye studies (Table 2): (1) 18/82 (22%) made measurements on both eyes but analysed data from one eye only, most commonly the right eye, (2) 10/82 (12%) analysed data from both eyes separately, (3) 10/82 (12%) analysed data from both eyes, taking into account the correlation between eyes, (4) 15/82 (18%) analysed both eyes using one eye as a treated or diseased eye, and the other as a control, and (5) 29/82 (35%) analysed both eyes either without correction or it was unclear exactly how the data had been analysed. Where data from both eyes were analysed, a variety of methods of analysis were employed including clustered ANOVA, nested ANOVA, ANOVA with right and left eye included as a ‘within subject’ factor, and the Bland and Altman test of agreement. There were no significant differences in the distribution of the frequencies of analysis in two-eye studies among journals (2
= 7.44, 8DF, P = 0.51) or years (2
= 16.91, 15DF, P = 0.32).
Discussion
among the three optometry journals or that the methods employed had changed markedly over the years reviewed.
A significant proportion of studies chose not to exploit or to avoid the between eye correlation by measuring one eye only (Dulku, 2012; Moschos et al., 2011), a procedure which can result in the loss of statistical power (Karakosta et al., 2012). In addition, there was no consistency in the procedures employed for the selection of the measured eye. Where either eye could have been chosen, the majority of studies selected the right eye, fewer choosing a randomly selected eye (Chen and Lam, 2009; Anderson et al., 2011; Denniss et al., 2011; Tomás et al., 2012; Tajbakhshi et al., 2012; Ogbuehi et al., 2012), and even fewer the left eye. In some studies, the better or dominant eye was selected (Parker et al., 2009; Suttle et al., 2009; Black et al., 2011; Davison et al., 2011; Nilsson et al., 2012) while in other studies the eye was self-selected on clinical grounds, i.e., the eye in which the signs and symptoms of disease were most evident (Kim et al., 2011; O’Neill et al., 2011; Shafi et al., 2011). In a significant proportion of articles, the selection criteria were either not described at all or were unclear, similar findings to ophthalmology (Karakosta et al., 2012). Where either eye could be selected, the only statistically valid procedure is to select that eye at random unless an alternative can be justified as selection consistently of the right eye can result in bias. There may be systematic differences between right and left eyes. Hence, some conditions are more prevalent in either the left or right eye, e.g., early glaucomatous defects may favour the right eye as in certain types of migraine (Yenice et al., 2006). As a consequence, selecting the right eye may provide a random sample of right eyes but is a biased sample of all eyes.
A smaller proportion of studies utilized data obtained from both eyes, and a significant proportion of these did so without correction for correlation, a result similar to ophthalmology (Karakosta et al., 2012). Such a procedure is likely to underestimate standard errors (SE), result in probability
questions of subjecting patients to measurements that were not used in a subsequent analysis. In addition, some investigators average data from both eyes and the problems of using this procedure are discussed by Newcombe and Duff (1987) and Murdoch et al. (1988), or analyze data from each eye separately (Plakitsi et al., 2011) which avoids the problem of rejecting useful data. Averaging data from both eyes can be a useful procedure if the correlation between the two eyes is high (close to unity) and if a treatment is applied which affects both eyes equally (Karakosta et al., 2012). Obviously, averaging would not be recommended if the treatment is locally administered to one eye. However, as a result of averaging, the data analysis is likely to be less efficient and have less power as it does not utilize the fact that right and left eyes can be regarded as a ‘within subjects' factor (Snedecor and Cochran, 1980; Armstrong et al., 2002; Martínez-Roda et al., 2011).
degree of bias. Either side of the bias line are the 95% confidence intervals in which it would be expected that 95% of the differences between the two methods would fall.
To estimate the magnitude of a variable together with its variance from a sample of right and left eyes, a ‘random effects model’ ANOVA (Armstrong et al., 2002) could be used. In a random effects model, the objective is not to measure the fixed effect of a treatment but to estimate the degree of variation of a particular measurement and to compare different sources of variation. These designs are also called nested or hierarchical designs (Snedecor & Cochran, 1980). The most important statistics from a random effects model are the ‘components of variance’ which estimate the variance associated with each of the sources of variation. The components of variance can be used to calculate appropriate SDs and CI if required but SDs can also be obtained from the ANOVA when calculating the ICC.
If a hypothesis test that the proportions of eyes with a particular characteristic is similar in two groups, involving data collected from right and left eyes, is required than the procedure of Fleiss et al. (2003), which accounts for the correlation between eyes, can be used and is described in detail by Karakosta et al. (2012). Essentially, an asymptotic approach is adopted with variance inflation factors applied to adjust the variance of the difference in proportions and to calculate an appropriately adjusted Z statistic.
In a more complex experimental design, different treatments could be given, at random, to the right and left eyes of human subjects employing two or more different subject groups (Armstrong et al., 2002). In such an experiment, the subject group would be regarded as a major factor while right/left eye would be regarded as a minor factor. This type of factorial design is best described as a split-plot factorial (Snedecor and Cochran, 1980). The difference between this and an ordinary factorial design is that in a completely randomised experiment, all subjects are allocated to treatment combinations at random whereas in a split-plot design, subjects can only be allocated at random to the main treatment groups, the sub-plot treatments then being randomised to right and left eyes within each subject. Hence, in a two-factor, split-plot ANOVA, there are two error terms, the main-plot error is used to test the main effect of subject group while the sub-plot error is used to test the main effect of eyes and the possible interaction between the factors. With reference to the design of experiments employing these analyses, it should be noted that statistical power of the analysis will vary with the degree of correlation between the eyes. In general, as the correlation decreases, a larger sample size will be needed to provide a specified power because of the increased variability. Hence, some knowledge of the ICC between eyes in a specific circumstance is useful in designing the experiment efficiently.
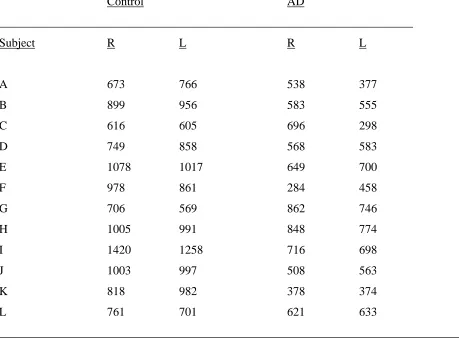
To illustrate the analyses, ANOVA is applied to the analysis of axon counts from the right and left optic nerves of twelve control subjects and twelve subjects with Alzheimer’s disease (AD) (Table 4). The density of axons was quantified using an image analysis system (Syed et al., 2005). Each section of the optic nerve was divided into four approximately equal quadrants. A sample field, approximately 2000 µm2 in area was located within each quadrant, as close as possible to the
center of the section, and the number of axons present in the field counted and averaged for the four fields. Three different types of ANOVA are illustrated. First, using the data from control subjects only, total variation was partitioned into that associated with subjects (between subjects) (2 + 22
s) and between eyes nested within subjects (2). The components of variance indicate that
plot factor and eyes as a sub-plot factor. The data suggested a significant reduction in axon counts in AD compared with the control group (F = 17.34, P = 0.004) but with no significant differences between eyes (F = 1.11, P = 0.30), the interaction suggesting that the difference between control and AD was similar for right and left eye (F = 0.33, P = 0.57).
Concluding remarks and advice
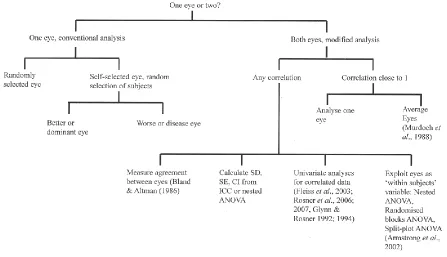
A flow chart summarising the major points and relevant advice is given in Fig 1.
1. In any study, consider whether it is advantageous to collect data from both eyes, which may reduce the number of subjects that have to be recruited and potentially increase the power of the study.
2. If only one eye is included and if both eyes are eligible, then the eye should be selected at random unless an alternative can be justified. A sample of such eyes can be analysed using conventional statistics (Armstrong et al., 2011).
3. If one eye is chosen on the basis of clinical criteria, then investigators should consider whether the alternate eye could be used as a control rather than recruiting a separate group of subjects as a control. If one eye is chosen and a separate control group recruited, then the data can be analysed using conventional statistics.
4. If both eyes are included in a study, then the correlation between eyes should be assessed using the ICC. If the correlation is close to one, then data from both eyes could be averaged or one eye selected at random for analysis using conventional statistics
6. If the objective is to assess the magnitude and variability of a measurement, then a nested classification ANOVA should be considered which includes the calculation of variance components, viz., between eyes within a subject and between subjects. Suitable SDs can also be obtained when calculating the ICC.
7. If a hypothesis test is required that the proportions of eyes with a particular characteristic is similar in two groups, involving data collected from right and left eyes, than the procedure of Fleiss et al. (2003) can be used.
8. If eyes are used as a ‘within subject’ variable in an experiment, the data can be analysed using a paired sample 't' test or two-way ANOVA in randomised blocks (single factor) or a factorial split-plot ANOVA (more than two factors).
9. Investigators should clearly describe the design of their study, provide a rationale for their choice of one or both eyes, the selection criteria applied if one eye is chosen, and describe the appropriate data analysis.
References
Anderson AJ, Johnson CA & Werner JS. Measuring visual function in age-related macular degeneration with frequency-doubling (matrix) perimetry. Optom Vis Sci 2011; 88: 806 – 815.
Armstrong RA, Eperjesi F & Gilmartin B. The application of analysis of variance (ANOVA) to different experimental designs in optometry. Ophthal Physiol Opt 2002; 22: 1-9.
Armstrong RA, Davies L, Dunne MCM & Gilmartin B. Statistical guidelines for clinical studies of human vision. Ophthal Physiol Opt 2011; 31: 123-126.
291.
Bland JM & Altman DG. Statistical method for assessing agreement between two methods of clinical measurement. Lancet 1986; I, 307-310.
Bland JM & Altman DG. Measurement error and correlation coefficients. BMJ 1996; 313: 41-42.
Chen D & Lam AKC. Reliability and repeatability of the Pentacam on corneal curvatures. Clin Exp Optom 2009; 92: 110 – 118.
Davison P, Akkali M, Loughman J, Scanlon G, Nolan J & Beatty S. Macular pigment: Its associations with color discrimination and matching. Optom Vis Sci 2011; 88: 816 -822.
Debert I, Malta de Alencar L, Polati M, Souza MB & Alves MR. Oculometric parameters of hyperopia in children with esotropic amblyopia. Ophthal Physiol Opt 2011; 31: 389-397.
Denniss J, Echendu D. Henson DB & Artes PH. Discus: investigating subjective judgement of optic disc damage. Optom Vis Sci 2011; 88: E93 – E101.
Donner A. A review of inference procedures for the intraclass correlation coefficient in the one-way random effect model. Int Stat Rev 1986; 54: 67 – 82.
Du B, Zhang H, Chan HHL, Wang JT, Cheung PW & Xu YS. Retinal function and morphology of severe non-proliferative diabetic retinopathy before and after photocoagulation. Clin Exp Optom 2011; 94: 284 – 290.
Dulku S. Generating a random sequence of left and right eyes for ophthalmic research. Invest Ophthalmol Vis Sci 2012; 8: 15 – 20.
Fotouhi A, Hashemi H, Yekta AA, Mohammad K & Khoob MK. Characterization of astigmatism in a population of school children, Dezful, Iran. Optom Vis Sci 2011; 88: 1054 - 1059.
Fleiss Jl, Levin B & Paik MC. Statistical Methods for Rates and Proportions. 3rd ed. New York, Wiley and Sons, 2003, pp 440 – 461.
Fortuin MF, Schilperoort J, Evans BJW, Manon HMT & Kiers H. Randomised controlled study comparing comfort-related outcomes between two rigid gas permeable (RGP) lenses with different sessile drop contact angles. Ophthal Physiol Opt 2011; 31: 190 – 199.
Glynn RJ & Rosner B. Accounting for the correlation between fellow eyes in regression analysis. Arch Ophthalmol 1992; 110: 381 – 387.
Glynn RJ & Rosner B. Comparison of alternative regression models for paired binary data. Stat Med 1994; 13: 1023 – 1036.
Glynn RJ & Rosner B. Regression methods when the eye is the unit of analysis. Ophthalmic Epidemiol 2012; 19: 159 – 165.
Hon Y, Cheung SW, Cho P & Lam AK. Repeatability of corneal biomechanical measurements in children wearing spectacles and orthokeratology lenses. Ophthal Physiol Opt 2012; 32: 349 - 354
Karakosta A, Vassilaki M, Plainis S, Elfaal NH, Tsilimbaris M & Moschandreas J. Choice of analytic approaches for eye-specific outcomes: one eye or two. Am J Ophthalmol 2012; 153: 571 - 579.
Kim H-G, Heo H & Park S-W. Comparison of scanning laser polarimetry and optical coherence tomography in preperimetric glaucoma. Optom Vis Sci 2011; 88: 124 - 129.
detect contact lens-induced corneal swelling. Clin Exp Optom 2011; 94: 352 – 360.
Martínez-Roda JA, Vilaseca M, Ondategui JC, Giner A, Burgos FJ, Cardona G & Pujol J. Optical quality and interocular scattering in a healthy young population. Clin Exp Optom 2011; 94: 223 – 229.
Martus P. Statistical methods for the evaluation of diagnostic measurements concerning paired organs. Statist Med 2000; 19: 525 – 540.
McAlinden C, Khadka J & Pseudovs K. Statistical methods for conducting agreement (comparison of clinical tests) and precision (repeatability or reproducibility) studies in optometry and ophthalmology. Ophthal Phys Opt 2011: 31: 330 – 338.
McGraw KO & Wong SP. Forming inferences about some intraclass correlation coefficients. Psychol Methods 1996; 1: 30 – 46.
Moschos MM, Margetis I, Markopoulos I & Moschos MN. Optical coherence tomography and multifocal electroretinogram study in human immunodifficiency virus-positive children without infectious retinitis. Clin Exp Optom 2011; 94: 291 – 295.
Müller R & Büttner P. A critical discussion of intraclass correlation coefficients. Stat Med 1994; 13: 2465 – 2476.
Murdoch IE, Morris SS & Cousens SN. People and eyes: statistical approaches in ophthalmology. Br J Ophthalmol 1988; 82: 971-973.
Nebbioso M, Livani ML, Steigerwalt RD, Panetta V & Rispoli E. Retina in rheumatic diseases: Standard full field and multifocal electroretinography in hydroxychloroquine retinal dysfunction. Clin Exp Optom 2011; 94: 276 – 283.
ophthalmological studies. Br J Ophthalmol 1987; 71: 645 -646.
Nilsson M, Svanberg M, Schalin S & Brautaset RL. Rarebit fovea test in children: reference data for children aged six to 10 years. Clin Exp Optom 2012; 95: 48 - 53.
Ogbuehi KC, Mucke S & Osuagwu UL. Influence of central corneal thickness on measured intraocular pressure differentials: Nidek RKT-7700, Topcon CT-80 NCTs and Goldmann tonometer. Ophthal Physiol Opt 2012; 32: 547 - 555
O’Neill EC, Connell PP, O’Connor JK, Brady J, Reid J & Logan P. Prism therapy and visual rehabilitation homonymous visual field loss. Optom Vis Sci 2011; 88: 263 - 268.
Parker KE, Marsack JD, Elswick JD, Brunstetter TJ & Applegate RA. Controlled induction of spherical aberration with custom soft contact lenses. Clin Exp Optom 2009; 92: 283 - 288.
Plakitsi A, O’Donnell C, Miranda MA, Charman WN & Radhakrishnan H. Corneal biomechanical properties measured with the ocular response analyser in a myopic population. Ophthal Phys Opt 2011, 31: 404-412.
Rosner B. Statistical methods in ophthalmology: an adjustment for the intraclass correlation between eyes. Biometrics 1982; 38: 105-114.
Rosner B. Multivariate methods in ophthalmology with applications to other paired-data situations. Biometrics 1984; 40: 1025 – 1035.
Rosner B, Glynn RJ & Lee ML. Incorporation of clustering effects for the Wilcoxon rank sum test: a large-sample approach. Biometrics 2003; 59: 1089 – 1098.
Rosner B, Glynn RJ & Lee ML. A non-parametric test of observational non-normally distributed ophthalmic data with eye-specific exposures and outcomes. Ophthalmic Epidemiol 2007; 14: 243 – 250.
Shafi A, Swanson WA & Dul MW. Structure and function in patients with glacomatous defects near fixation. Optom Vis Sci 2011; 88: 130 - 139.
Sainani K. The importance of accounting for correlated observations. PM R 2010; 2: 858-861.
Sheppard AL & Davies LN. Clinical evaluation of the Grand Seiko Auto Ref/Keratometer WAM-5500. Ophthal Physiol Opt 2010; 30: 143-151.
Smith ND, Crabb DP & Garway-Heath DF. An exploratory study of visual search performance in glaucoma. Ophthal Physiol Opt 2011; 31: 225 – 232.
Snedecor GW & Cochran WG. Statistical methods. 7th Ed. Iowa State University Press, Ames Iowa, 1980.
Suttle C, Alexander J, Liu M, Ng S, Poon J & Tran T. Sensory ocular dominance based on resolution acuity, contrast sensitivity and alignment sensitivity. Clin Exp Optom 2009; 92: 2 – 8
Syed AB, Armstrong RA & Smith CUM. A quantitative study of optic nerve axons in elderly control subjects and patients with Alzheimer’s disease. Folia Neuropath 2005; 43: 1-6.
Tajbakhsh Z, Salouti R, Nowroozzadeh, MH, Aghazadeh-Amiri M, Tabatabaee S & Zamani M. Comparison of keratometry measurements using the Pentacam HR, the Orbscan IIz, and the TMS-4 topographer. Ophthal Physiol Opt 2012; 32: 539 – 546
Wu F, Yang Y & Dougherty PJ. Contralateral comparison of wavefront-guided LASIK surgery with iris recognition versus without iris recognition using MEL80 Excimer laser system. Clin Exp Optom 2009; 92: 320 - 327.
Yenice O, Temel A, Incili B & Tuncer N. Short-wavelength automated perimetry in patients with migraine. Graefes Arch Clin Exp Ophthalmol 2006; 244: 589 -595.
Yoo YC, Lee CM & Park JH. Changes in peripapillary retinal nerve fibre layer distribution by axial length. Optom Vis Sci 2011; 88: 4 - 11.
Table 1. Frequency of different methods of selecting the eye in studies employing one eye only in articles published in three optometry journals 2009 - 2012 (OPO = Ophthalmic and physiological optics, OVS = Optometry and vision science, CEO = Clinical and experimental optometry; N = number of articles).
Selection of eye
________________________________________________________________________ Journal N Right Left Random Better Worse Dominant No criteria
eye eye eye eye eye eye given
OPO 51 24 0 3 3 2 5 14
OVS 62 19 3 11 4 2 12 11
CEO 35 9 0 5 3 1 7 10
Totals 148 52 3 19 10 5 24 35
________________________________________________________________________ Chi-square (2) contingency table comparing journals: 2
Table 2. Frequency of different methods of analysis of data employing both eyes in articles published in three optometry journals 2009 - 2012 (OPO = Ophthalmic and physiological optics, OVS = Optometry and vision science, CEO = Clinical and experimental optometry; N = Number of articles).
Method of analysis
________________________________________________________________________ Journal N Data from Each eye Both eyes Both eyes Both eyes
one eye taken corrected (adjacent as uncorrected only separately for control) for
correlation correlation
OPO 19 3 5 2 3 6
OVS 32 9 3 5 4 11
CEO 31 6 2 3 8 12
Totals 82 18 10 10 15 29
________________________________________________________________________ Chi-square (2) contingency table: 2
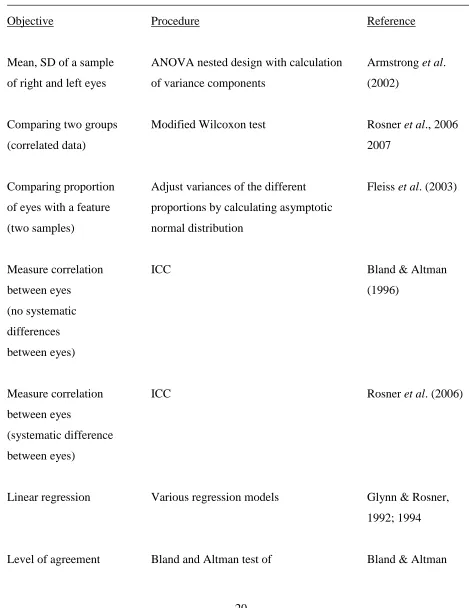
Table 3. Recommended procedures for the analysis of data from both eyes.
______________________________________________________________________________
Objective Procedure Reference
Mean, SD of a sample ANOVA nested design with calculation Armstrong et al. of right and left eyes of variance components (2002)
Comparing two groups Modified Wilcoxon test Rosner et al., 2006
(correlated data) 2007
Comparing proportion Adjust variances of the different Fleiss et al. (2003) of eyes with a feature proportions by calculating asymptotic
(two samples) normal distribution
Measure correlation ICC Bland & Altman
between eyes (1996)
(no systematic differences between eyes)
Measure correlation ICC Rosner et al. (2006)
between eyes
(systematic difference between eyes)
Linear regression Various regression models Glynn & Rosner, 1992; 1994
between eyes agreement (1986), McAlinden et al. (2011)
Treated eye, other as paired ‘t’ test Armstrong et al.
control (two-way) (2010)
Treated eye, other as ANOVA split-plot Armstrong et al.
control (factorial design) (2002)
Table 4. Mean axon densities per sample field (2000 µm2) in the right (R) and left (L) optic nerves
of twelve normal subjects and twelve subjects with Alzheimer’s disease (AD).
Control AD
_____________________________________________________________________
Subject R L R L
A 673 766 538 377
B 899 956 583 555
C 616 605 696 298
D 749 858 568 583
E 1078 1017 649 700
F 978 861 284 458
G 706 569 862 746
H 1005 991 848 774
I 1420 1258 716 698
J 1003 997 508 563
K 818 982 378 374
L 761 701 621 633
______________________________________________________________________________ Analyses:
(1) Nested analysis of variance (ANOVA) with calculation of components of variance for the control data only:
Source DF SS MS Components of variance
Subjects 11 912155 82923 2 + 22s = 39023
Eyes within subjects 12 58525 4877 2 = 4877
(2) A two-way ANOVA for the control data only:
Source DF SS MS F
Subjects 11 912155 82923 15.82 (P = 0.0003)
Error 11 57649 5241
(3) A two-factor split-plot ANOVA comparing control with AD patients:
Source DF SS MS F
Group 1 1097168 1097168 17.34 (P = 0.0004)
Main-plot error 22 1392056 63275
Eyes 1 8454 8454 1.11 (P = 0.30)
Group x Eyes 1 2509 2509 0.33 (P = 0.57)
Sub-plot error 22 167889 7631.3