warwick.ac.uk/lib-publications
A Thesis Submitted for the Degree of PhD at the University of Warwick
Permanent WRAP URL:
http://wrap.warwick.ac.uk/90151
Copyright and reuse:
This thesis is made available online and is protected by original copyright.
Please scroll down to view the document itself.
Please refer to the repository record for this item for information to help you to cite it.
Our policy information is available from the repository home page.
By
Submitted to the University of Warwick for the degree of
iii
Contents
1.1 Structure and applications of diamond ... 1
1.1.1 Classification of diamonds ………3
1.2 Motivation for study ... 5
1.3 Thesis outline ... 6
1.4 References ... 7
Diamond synthesis ... 9
2.1.1 HPHT ………..9
2.2.1 CVD ………12
Defects in diamond ... 14
2.3.1 Radiation damage ………14
Vacancies ……….14
〈001〉-split interstitial ………15
Other interstitial defects ………..16
2.4.1 Nitrogen in diamond ………..17
Single substitutional nitrogen ………17
Nitrogen related aggregates ………..19
Nitrogen vacancy……..……….……….19
𝑁3𝑉0………..………...21
2.5.1 Further impurities ………22
History of EPR ... 22
iv
3.1 Magnetic resonance ... 32
3.1.1 Magnetisation ………33
3.1.2 The resonance condition ………33
3.1.3 Bloch equations ……….35
3.1.4 Line shape ………37
3.1.5 EPR interactions ………..39
3.1.5.1 Electron Zeeman ……….……….39
3.1.5.2 Nuclear Zeeman ………41
3.1.5.3 Electron nuclear hyperfine interaction ………41
3.1.5.4 Nuclear quadrupole ………44
3.1.5.5 Zero-field splitting ………44
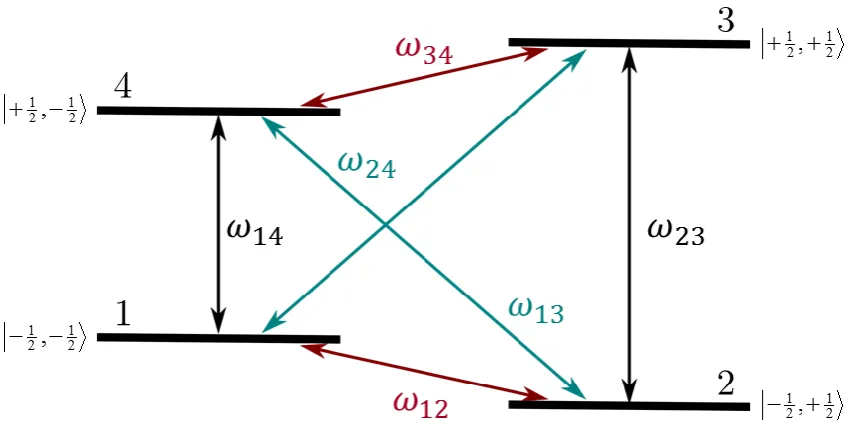
3.1.6 The (S=1/2, I=1/2) model system ……….45
3.1.6.1 Polarisation ………45
3.1.7 Dynamic nuclear polarisation ……….46
3.1.8 Time evolution of spin ………..49
3.1.8.1 Vector notation ………49
3.1.8.2 Echo decay ……….51
3.1.9 Multiple pulse T1 measurements ……….52
3.1.10 Rapid passage EPR ………53
3.2 Symmetry ... 55
3.3 Chemical kinetics ... 57
3.3.1 First order kinetics ………..57
3.3.2 Second order kinetics ……….58
3.4 Optical absorption ... 58
3.4.1 Absorption coefficient ………59
3.4.2 Sources of absorption ……….60
3.5 References ... 62
4.1 Quantitative EPR ... 63
4.1.1 Resonator quality factor ………...64
4.1.2 Filling factor ………..65
4.1.3 Saturation ………66
4.1.4 Simulation and fitting ………68
4.2 The EPR spectrometer ... 69
4.2.1 The static magnetic field ………..70
4.2.2 Modulation ………..71
4.2.3 The microwave bridge ………72
4.2.4 Resonators ………72
v
4.3 Pulsed electron paramagnetic resonance ... 76
4.3.1 Turning angle ………77
4.3.2 Phase cycling ………..77
4.4 Low temperature ... 78
4.5 EPR with in situ uniaxial stress ... 80
4.6 Infra-red absorption spectroscopy ... 83
4.7 References ... 84
Introduction ... 85
5.1.1 EPR detection limits ………..87
RP-EPR ... 89
5.2.1 Repeatability ………..91
Method for repeatability measurements ………..91
Results and analysis for RP-EPR(FM) repeatability ………92
5.2.2 Temperature ………94
Experimental: temperature dependence ………...95
Results for temperature dependence ………..96
5.2.3 Sweep rate ………100
Experimental: sweep rate investigation ……….101
Results of sweep rate investigation ……….103
5.2.4 Discussion ………106
Large samples ... 107
5.3.1 Cavity characterisation ………109
5.3.2 Diamond powder ………109
High nitrogen concentration ... 111
Conclusion ... 113
References ... 116
𝑵𝑺𝟎 6.1 Background ... 118
6.1.1 Reorientation of 𝑁𝑆0 ...118
6.1.2 Spin lattice relaxation ……….119
6.1.3 Measurement of 𝑇2 ...122
6.2 Experimental ... 123
6.2.1 Uniaxial stress ………123
6.2.2 Relaxation ……….124
6.2.3 𝑇2 measurements ………...124
6.3 Results and analysis ... 126
6.3.1 Relaxation times from RP-EPR(FM) ………126
6.3.2 Uniaxial stress of 𝑁𝑆0 ...128
vi
6.3.2.3 𝑇𝑚 ...132
6.3.2.4 𝑇2 ...134
6.3.2.5 Dipolar coupling ………135
6.3.2.6 𝑇1 ...137
6.3.3 Field dependence ………138
6.4 Conclusions ... 140
6.5 References ... 143
7.1 Introduction ... 144
7.1.1 Ns0……….146
7.1.2 Charge transfer of N3V ………..147
7.1.3 Electron structure of 𝑁3𝑉 ……….147
7.2 Sample history ... 149
7.3 Experimental detail ... 150
7.3.1 Optically excited magnetic resonance ……….150
7.3.2 Optically excited FT-IR ……….153
7.4 EPR measurements of spin population ... 153
7.4.1 Relaxation ……….154
7.4.2 Microwave power ………..155
7.4.3 Optical energy ……….156
7.4.4 Optical power ………..158
7.4.5 Temperature dependence………...160
7.4.6 Polarisation rates ………..161
7.4.7 Long lived nuclear polarisation ………..163
7.5 Nuclear polarisation ... 165
7.5.1 Polarisation rates ………..167
7.5.2 Optical power ……….168
7.6 IR measurements ... 168
7.7 Summary of additional samples ... 169
7.8 Discussion ... 171
7.8.1 Spin-correlated radical pairs ……… 173
7.9 Conclusions and further work ... 176
7.10 References ... 178
8.1 Introduction ... 182
8.1.1 Migration of R2 ……….183
8.2 Experimental ... 185
8.3.1 Sample history ………..185
vii
8.3.3 High temperature EPR ………..187
8.3 Results and analysis ... 188
8.3.1 Reorientation of the defect ………...188
8.3.2 Fitting ……….191
8.3.3 Isothermal anneal ………..193
8.3.4 Comparison with previous work ……….195
8.4 Conclusion ... 196
8.5 References ... 198
Quantification in diamond ... 199
Relaxation of 𝑁𝑆0 ... 201
Polarisation of 15𝑁𝑆0 and 𝑁 3 15 𝑉0 ... 202
Reorientation of the 〈001〉-split interstitial, R2 ... 203
References ... 205
Laser diodes ... 206
viii
List of Tables
Table 1-1 List of some properties of diamond. ... 3
Table 1-2 The classification of diamond ... 4
Table 3-1 The most common nucleus with I<0 found in diamond ... 42
Table 3-2 Common symmetries for point group distortions in diamond ... 57
Table 4-1 Typical spectrometer configuration for RP- and SP-EPR experiments. ... 69
Table 4-2 Conventional frequencies at which EPR is conducted. ... 70
Table 4-3 List of resonators used in this research. ... 73
Table 5-1 Table of SNR for different EPR techniques.]. ... 90
Table 5-2 Experimental parameters for investigating effect of temperature on RP-EPR(FM)95 Table 5-3 T1 times for 0577207-C(ii) ... 97
Table 5-4 The transition probabilities for transition for 𝑁𝑆0 with B0 aligned along [001]. ... 100
Table 5-5 Experimental parameters for the investigation into sweep rates ... 103
Table 5-6 Typical powers for peak signal of room temperature rapid scan experiments .... 104
Table 6-1 List of samples used for uniaxial stress investigation. ... 124
Table 6-2 Tm for samples under atmospheric conditions at 293K w ... 132
Table 6-3 Tm measurements on Syn93-391 comparing Tm and T2 at room temperature. .. 135
Table 6-4 Table of the T1 times measured under atmospheric conditions ... 138
Table 6-5 Parameters used for fitting multi frequency relaxation measurements. ... 140
Table 7-1 Review of 𝐶13 spin lattice relaxation in diamond ... 145
Table 7-2 Concentrations of defects in Syn339-5. ... 150
Table 7-3 Eigenstates for two different orientations of 𝑁15 𝑆0with 𝐵0 aligned along [111]. 152 Table 7-4 Time constants for polarisation build up and decay. ... 163
Table 7-5 Details of other samples tested for spin polarisation. ... 170
ix
List of Figures
Figure 1-1 Diagram of the unit cell of diamond. ... 2
Figure 2-1 The pressure temperature phase diagram of carbon ... 10
Figure 2-2 The structure of 〈001〉-split interstitial, R2, defect, ... 16
Figure 2-3 The structure of the 𝑁𝑆0. ... 18
Figure 2-4 The structure of NV. ... 20
Figure 2-5 Left, the structure of 𝑁3𝑉0defect. ... 21
Figure 3-1 a, The electronic Zeeman effect for an S=1/2 system ... 34
Figure 3-2 Free precession of the magnetisation, ... 36
Figure 3-3 The energy level diagram for a system with S=1/2 and I = 1/2. ... 46
Figure 3-4 Schematics of the primary echo. ... 51
Figure 3-5 Sequences used for measurement of T1 ... 53
Figure 3-6 Simulation of a characteristic stretched FID-like response seen in direct detected RP-EPR ... 54
Figure 3-7 Simulated road map and spectra of the principal directions for 𝑁𝑆0 ... 56
Figure 3-8 The zero phonon and phono aided transitions in absorption spectroscopy ... 60
Figure 4-1 Microwave power saturation curves ... 67
Figure 4-2 Schematic representation of the key components for an EPR spectrometer. ... 69
Figure 4-3 The effect of modulated detection, the absorption lineshape ... 71
Figure 4-4 Basic geometry of a TE011 cavity. ... 74
Figure 4-5 The cross section of a number of loop gap resonator designs ... 75
Figure 4-6 Schematic representation of the key components of a pulsed EPR spectrometer 77 Figure 4-7 Schematic of cryostats used in this work. ... 79
Figure 4-8 The uniaxial stress probe with key components labelled. ... 81
Figure 4-9 Cutaway diagram of the resonator housing with key components labelled. ... 82
Figure 5-1 The RP-EPR(FM) integrated intensity of the 𝑁𝑆0 signal plotted against the concentration determined by SP-EPR, ... 90
Figure 5-2 Histograms showing the reproducibility of quantitative measurements for RP-EPR(FM). ... 93
x
Figure 5-5 The intensities of the EPR transitions at different sweep rates ... 98
Figure 5-6 Distorted RP-EPR(FM) spectrum of 0572207-C(ii) at low temperature ... 98
Figure 5-7 RP-EPR(FM) on 097320P-A at 90 K with different starting poits. ... 99
Figure 5-8 Schematic of the RP-EPR(FM) equipment used for the increased sweep rates. .. 101
Figure 5-9 A typical calibration curve for the ER-4102ST RP coils. ... 102
Figure 5-10 The SNR found for the same acquisition time at different sweep rates. ... 104
Figure 5-11 SNR ratio found at different sweep rates at room temperature. ... 106
Figure 5-12 Experimental setup used to characterise a cavity.. ... 108
Figure 5-13 The measured concentration of 𝑁𝑆0for varying length of diamond grit ... 110
Figure 5-14 Photograph and DiamondView ™ image of Sample V. ... 111
Figure 5-15 EPR spectrum of Sample V fitted to two 𝑁𝑆0 simulations ... 112
Figure 6-1 The four unique orientations of 𝑁𝑆0. ... 119
Figure 6-2 Schematic representation of two of the four potential barriers for 𝑁𝑆0 with a local strain causing ΔE change in energy barrier. ... 121
Figure 6-3 Experimental procedure for the determination of T2 ... 125
Figure 6-4 RP-EPR(FM) signal of 𝑁𝑆0 recorded at different modulation phases at 100 kHz modulation frequency (blue lines) for 0743185-A.. ... 126
Figure 6-5 The tan of the modulation phase giving peak RP-EPR(FM) signal for 𝑁𝑆0 against modulation frequency. ... 127
Figure 6-6 Diagram of the orientations for 𝑁𝑆0and how they interact with the static magnetic field along and applied uniaxial stress ... 129
Figure 6-7 Sample Syn93-391 with applied stress along [110] ... 130
Figure 6-8 The ratio of intensities for the orientations that are depopulated and the intensities of the remaining orientations ... 131
Figure 6-9 T2 against uniaxial stress applied parallel to the [110] crystal direction at room temperature ... 133
Figure 6-10 𝑇𝑚 for samples 037821-A(ii) and Syn93-391 with increased uniaxial stress parallel to [110] crystallographic direction ... 133
xi
Figure 6-12 Variation in T1 against stress parallel to the [110] crystal direction for two
samples. ... 137
Figure 6-13 Temperature dependence of T1 for Syn93-07 with B0 aligned along the [001] crystallographic direction. ... 139
Figure 7-1 Energy level structure of 𝑁3𝑉: ... 149
Figure 7-2 Photograph of Syn339-5 ... 150
Figure 7-3 Example of an EPR spectrum for Syn339-5. ... 151
Figure 7-4 Example spectra of Syn339-5, recorded at non saturating powers with 𝐵0 aligned along the [111] crystallographic direction at 50 K. ... 153
Figure 7-5 The temperature dependence for 𝑁15 𝑆0 and 𝑁15 3𝑉0: ... 155
Figure 7-6 Power saturation curves of 𝑁15 𝑆0recoded with 𝐵 0 aligned along the [111] crystallographic direction at 50 K. ... 156
Figure 7-7 The excitation energy dependence of polarisation factor ε for 𝑁15 𝑆0 recorded with 𝐵0 aligned along the [111] crystallographic direction at 80K. ... 157
Figure 7-8 Spectra of Syn339-5 with increasing optical power at 50K ... 159
Figure 7-9 Polarisation dependence on optical power for 𝑁15 𝑆0 recorded with 𝐵 0 aligned along the [111] crystallographic direction at 50 K, using 520 nm excitation. ... 159
Figure 7-10 Temperature dependence of polarisation for 𝑁15 𝑆0recorded with 𝐵 0 aligned along the [111] crystallographic direction using 80 mW 520 nm excitation.. ... 161
Figure 7-11 Polarisation build and decay for 15𝑁𝑆0 ... 162
Figure 7-12 Long lived nuclear polarisation at 50K. ... 164
Figure 7-13 Single shot NMR experiment at 7.04 T of Syn339-5. ... 166
Figure 7-14 Polarisation of 13C in NMR at 7.04T at room temperature with B0 aligned along the [111] crystal direction with 520nm optical excitation. ... 167
Figure 7-15 Example FT-IR of change in charge state of 15𝑁𝑆 during with 100 mW of 520 nm optical excitation at 115 K.. ... 169
Figure 7-16 Syn339-B(ii) measured in non-microwave saturating condition at 80 K. ... 171
xii 𝑆
... 175
Figure 8-1 Model for the migration of R2 by reorientation.. ... 183
Figure 8-2 Schematic of the equipment used to perform uniaxial stressed anneals. ... 186
Figure 8-3 Schematic of the equipment used for high temperature EPR measurements .... 187
Figure 8-4 Examples of EPR spectra for 50013c. ... 189
Figure 8-5 The total EPR intensities for the individual scans. ... 190
Figure 8-6 Simplified model of the energy wells for R2 ... 191
Figure 8-7 Example reorientation of the R2 defect during an isothermal anneal at 320 °C. ... 192
Figure 8-8 Arrhenius plot for the reorientation of the R2 defect. ... 193
Figure 8-9 Isothermal anneal at 614 K with different order of rates simulations ... 194
xiii
Acknowledgements
Research of this extent is never truly the work of one person in isolation and was only possible due to the support I have received from a host of people. I would like to thank my supervisor Prof. Mark Newton for his supervision, guidance and patience over the course of this PhD and for sharing his infectious enthusiasm for research. I would also like to thank Dr. Gavin Morley for his support and willingness to offer advice whenever it was needed.
I would like to acknowledge Dr. Chris Wedge who has always been very generous with his time and experience. In additional I owe thanks to all the staff of the mechanical and electronic workshops for their excellent work. I would also like to thank Dr. Brad Cann, Dr. David Fisher and Dr. Philip Martineau from De Beers Technologies in Maidenhead who have all offered encouragement and thought provoking conversations during the last four years.
I also have to thank all the member of the Warwick diamond and EPR group students past and present, Ben (1), Chris H, Mika, Matt, Anton, Angelo, Claudio, Sinead, Colin, Phil, Guy and Enrik. You have all at one point over the past four years educated me, provided interesting debate and some good coffee. I would not have made it through without the emotional and practical support that you have all provided and I am eternally grateful to you all.
I would also like to thank my family. Mum and Dad, for their love and belief in me even when I did not believe in myself. Emma and John who have provided beer/tea, an interested ear and welcome distractions in equal measure not to mention the traffic tips. Of course, I must also thank my extended family Sue and J
ohn and the clan across the ocean who have all provided endless support and encouragement. (On a side note an average house brick has a Mohs hardness of approximately three.)
Finally, this thesis is dedicated to my wife Amy. You have consoled me during the dark days and celebrated on the good days. You have provided me with love support and the occasional motivational push, it is true to say I would not have achieved this without you.
xiv
Declaration and published work
I declare that the work presented in this thesis is my own except where stated otherwise, and was carried out entirely at the University of Warwick, during the period of October 2012 to September 2016, under the supervision of Prof. Mark Newton and Dr. Gavin Morley. The research reported here has not been submitted, either wholly or in part, in this or any other academic institution for admission to a higher degree. Some parts of the work reported and other work not reported in this thesis have been published, as listed below. It is anticipated that further parts of this work will be submitted for publication in due course.
Published Papers
1. M. A. Tamski, M. W. Dale, B. G. Breeze, J. V. Macpherson, P. R. Unwin, and M. E. Newton, Electrochemical electron paramagnetic resonance utilizing loop gap resonators and micro- electrochemical cells. Electrochim. Acta 213, (2016).
Subm itted papers
1. B. L. Green, B. G. Breeze, G. J. Rees, J. V. Hanna, J-P. Chou, V. Ivády, A. Gali, and M. E. Newton, All-optical hyperpolarization of electron and nuclear spins in diamond,
arXiv:1610.03823 (Submitted to Physical review letters. (2017))
2. B. L. Green, B. G. Breeze and M E. Newton, Electron paramagnetic resonance and photochromism of N3V0 in diamond, arXiv:1702.02959 (Submitted to Journal of condensed matter physics (2017))
Papers in preparation for subm ission
1. B. G. Breeze, S Liggins, M. W. Dale, Jon Goss and Mark E. Newton, Uniaxial stress investigation of substitutional nitrogen in diamond, (2017)
2. M.W. Dale, B. G. Breeze, J. Isoya and Mark E. Newton, Uniaxial stress and irradiation study of carbon interstitials in diamond, (2017)
Conference Presentations
1. B. G. Breeze, B. L. Green. G. J. Reese and M. E. Newton, Optical spin polarisation of the N3V and Ns0defects in diamond, 67th De Beers Diamond Conference,
xv
2. B. G. Breeze, M. W. Dale, B. L. Green. and M. E. Newton, Uniaxial stress of radiation defects in diamond, 67th De Beers Diamond Conference, University of Warwick, Coventry, United Kingdom, oral presentation (2016)
3. B. G. Breeze, M. W. Dale, B. L. Cann, B. L. Green and M. E. Newton, Electron paramagnetic resonance on point defects in diamond under uniaxial stress,
International Conference on Diamond and Related Material, Bad Homburg, Germany, poster presentation (2015)
4. B. G. Breeze, M. W. Dale, and M. E. Newton, In-situ EPR measurements under large uniaxial stress, IMR-CDT conference, University of Warwick, Coventry, United Kingdom, oral presentation (2015)
5. B. G. Breeze, M. W. Dale, and M. E. Newton, Electron paramagnetic resonance, diamond and stress, 66th De Beers Diamond Conference, University of Warwick, Coventry, United Kingdom, oral presentation (2015)
6. B. G. Breeze, M. W. Dale, and M. E. Newton, Rapid scan electron paramagnetic resonance, 65th De Beers Diamond Conference, University of Warwick, Coventry, United Kingdom, poster presentation (2014)
7. B. G. Breeze, B. L. Cann, and M. E. Newton, Rapid passage electron paramagnetic resonance, The 46th Annual International Meeting of the ESR Spectroscopy Group of the Royal Society of Chemistry, University of Dundee, Dundee, United Kingdom, poster presentation (2014)
8. B. G. Breeze, B. L . Cann, M.W. Dale, B. L. Green, C. B. Hartland and M. E. Newton, Improving the sensitivity of quantitative electron paramagnetic resonance,
64th De Beers Diamond Conference, University of Warwick, Coventry, United Kingdom, poster presentation (2013)
9. B. G. Breeze, B. L . Cann, M.W. Dale, B. L. Green, C. B. Hartland and M. E. Newton, Improving the accuracy of quantitative electron paramagnetic resonance,
The 45th Annual International Meeting of the ESR Spectroscopy Group of the Royal Society of Chemistry, University of Warwick, Coventry, United Kingdom, oral presentation (2013)
xvi
Abstract
This thesis reports research on point defects in synthetic single crystal diamond. The principal technique used for investigation is electron paramagnetic resonance, EPR. Nuclear magnetic resonance, NMR, and optical absorption spectroscopy have also been employed. Uniaxial stress has been used to investigate the properties and migration of defects under an applied perturbation.
The use of field modulated rapid passage EPR, RP-ERP(FM), for quantitative measurements of neutral single substitutional nitrogen, 𝑁𝑆0, in diamond has been investigated. Optimisation
of field sweep rate and experiment temperature have been shown to provide a factor of 5.6 improvent in signal to noise; a ×25 speed up on previous conditions. The repeatability of RP-EPR(FM) has been investigated by repeated measurements of the same sample (containing 𝑁𝑆0). These results indicate a random error of ±2.5%; a 50% reduction compared with slow passage EPR, SP-EPR. Careful cavity characterisation has been utilised to enable reliable quantitative measurements of diamond samples that are large compared to an EPR cavity. An EPR probe has been developed to deliver in situ large (>1 GPa) uniaxial stress whilst simultaneously performing measurements. This probe was used to investigate the effect of uniaxial applied stress on the paramagnetic relaxation of 𝑁𝑆0 in diamond. 𝑁𝑆0 is found to reorientate its principle <111> axis away from applied stress with an activation of 17(1) meV/GPa for a [111] applied stress. Unexpectedly the spin lattice relaxation, T1, was
found to be invariant with a pressure up to 1 GPa: this is inconsistent with the prevailing model for T1 relaxation of the defect in the literature which relies on the relies on the
reorientation of the defect. The phase memory time Tm of 𝑁𝑆0 was found to be tuneable using
uniaxial stress. This is modelled in terms of a reduction of spin diffusion and has potential to be used as a tuneable relaxation mechanism in future experiments in other defects which can be preferentially orientated with uniaxial stress.
Uniaxial stress was also used to investigate the migration of the 〈001〉 split-interstitial defect, R2, which is understood to migrate through the lattice by consecutive reorientation of the defect. The sample was annealed under [001] uniaxial stress to create an initially preferentially orientated population and the reorientation back to equilibrium was monitored by EPR during a second in situ anneal. An activation energy, 2.0(1) eV and an attempt frequency 3×10¹³ Hz for the migration of the defect was measured.
The electron and nuclear spin polarisation of 15𝑁𝑆0 and 𝑁
3
15 𝑉0 has been explored by use of
optically pumped EPR. The polarisation is found to be present for temperature up to 150 K and for optical excitation energies > 1.9 eV. Long lived nuclear polarisation of the nitrogen is found to continue after the optical excitation has ended. The decay of this polarisation allows measurement of a nuclear T1 of 40(3) minutes through EPR. Optically pumped NMR showed
xvii
Abbreviations
A & B Prefactors for relaxation rates
B Magnetic field
0
B
Static magnetic field1
B
Microwave fieldmod
B
Modulation fieldβ inhomogeneity parameter
Magnetic susceptibly
CVD Chemical vapour deposition
CW-EPR Continuous wave electron paramagnetic resonance DNP Dynamic nuclear polarisation
A
E
Activation energyELDOR Electron electron double resonance ENDOR Electron nuclear double resonance EPR Electron paramagnetic resonance
Polarisation factor
Filling factor
FID Free induction decay
FT-EPR Fourier transform electron paramagnetic resonance FT-IT Fourier transform infra-red
g g-factor i
Gyromagnetic ratio of iHPHT High pressure high temperature
I Quantum number for the nuclear spin B
k
Boltzmann constant LGR Loop gap resonatorB
Bohr magnetonMP-CVD Microwave plasma chemical vapour deposition NMR Nuclear magnetic resonance
ij
Transition between energy levels i and jB
Larmor frequency PCD Polycrystalline diamond ppb Parts per billionppm parts per million
Q Resonator Quality factor RP-EPR Rapid passage EPR
xviii
1
T
Electron spin lattice relaxation1n
T
Nuclear spin lattice relaxation2
T
Electron spin spin relaxation mT
Electron phase memory UV-Vis Ultraviolet - visible ZPL Zero phonon line[hkl] Crystallographic direction
<hkl> Set of equivalent crystallographic directions (hkl) Crystallographic plane
Chapter 1. Introduction
1
Chapter 1
“They don’t make diamonds the size of bricks.”
-traditional1
1
Introduction
For much of history diamond has been of interest as a decorative item. Diamond's clarity and sparkle along with their scarcity have led them to become associated with wealth and power. The largest natural diamonds have become part of the crown jewels of royalty. The world’s largest gem quality example, the 3106 ct Cullinan diamond, is part of the British crown jewels and the largest pink diamond, the 182 ct Daria-i-Noor, is part of the Iranian crown jewels. Alongside this there is an industry built around exploiting diamond for its mechanical properties, and growing industries surrounding its electrical and optical properties.
1.1
Structure and applications of diamond
Diamond, like graphite and graphene, is an allotrope of carbon [1]. All of these allotropes have very different properties, to understand the atomic and electron structure must be considered. The ground state of a carbon atom is the 2 2 2
1s 2s 2 p electronic configuration. In graphite and
graphene, the 2s and 2p orbitals form sp2 hybridised orbitals, creating strong covalent bonds between neighbouring carbon in a hexagonal pattern. In the case of graphene these sheets exist as a 2D layer but in graphite, weak van der Waals forces attract layers together. For diamond the carbon orbitals are sp3hybridised orbitals and form bonds with four nearest neighbours in a tetrahedral geometry. The electron promotion in this process is energetically expensive, but the resultant electron sharing gives a completed electron shell making the final product energetically favourable [2].
2
The resulting crystal structure, shown in Figure 1-1, is described as two face centred cubic cells with one lattice displaced by a0/4. The cubic unit cell constant, a0, is 0.357 nm and the
average C-C bond length is b=0.154 nm. This close packing creates an atomic density of 1.76×1023 cm-3 the highest of any solid. It follows that an impurity with concentration 1.76×1017 cm-3 has a concentration a 1 part per million (ppm).
The structure of diamond gives it unique properties, some of which are outlined in Table 1-1; it is these properties that make diamond a suitable material for many applications. The first industrial application of diamond was as an abrasive where it was bonded to grinding wheels at the start of World War Two [4] and abrasive applications remain the main market for synthetic diamond. Intrinsic diamond is an electronic insulator but a good thermal conductor making it an ideal material for a heat spreader in high power electronic devices [5].
Diamond is transparent over a wide range of frequencies and as such is often employed for optical windows [5]. There is also growing interest in the use of diamond in Raman lasers [6,7]. The potential for biocompatibility has led to research into the use of diamond as a scaffold for the reconstruction of bones [8,9]. Research into biological applications of diamond is at an early stage but diamond scalpels have been used for eye surgery for many years.
Figure 1-1 Diagram of the unit cell of diamond with side length of a0 = 0.357 nm. The tetrahedral lattice
Chapter 1. Introduction
[image:22.595.112.483.73.329.2]3
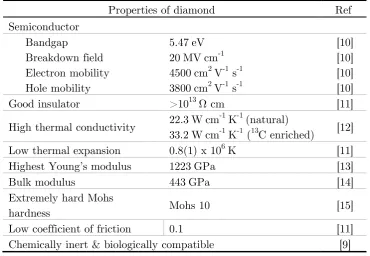
Table 1-1 List of some properties of diamond.
The electronic properties of diamond have come under increased interest in recent years, boron doping is used to increase the conductivity of diamond opening up many applications. High breakdown voltage and hole mobility may be employed to create efficient high power active electronics [16,17]. Diamond’s radiation hardness makes devices capable of working for long periods, under heavy doses of radiation without degradation in performance and this has been harnessed to create radiation detectors [18]. Its chemically stable nature offers potential in becoming a reliable sensor in extreme environments for temperature, pH and in electrochemistry [19–21]. The potentially low spin density in the diamond lattice provides long paramagnetic relaxation times [22–24], and can be used as a host material for point defects that can be used as quantum qubits or in high resolution magnetometry [25,26].
1.1.1
Classification of diamonds
The perfect diamond lattice consists only of carbon atoms arranged in a crystal structure, anything deviating from this is considered a defect. Defects fall broadly into two categories: point defects and extended defects [27]. For the purposes of this thesis a point defect will be considered to be any defect which does not significantly exceed the unit cell; structures such as a vacancy site, substitutional impurity or cluster of impurities are considered point defects. An extended defect is one that is significantly larger than the unit cell; large voids, dislocations
Properties of diamond Ref Semiconductor
Bandgap 5.47 eV [10]
Breakdown field 20 MV cm-1 [10] Electron mobility 4500 cm2 V-1 s-1 [10] Hole mobility 3800 cm2 V-1 s-1 [10] Good insulator >1013Ω cm [11] High thermal conductivity 22.3 W cm
-1 K-1 (natural)
33.2 W cm-1 K-1 (13C enriched) [12] Low thermal expansion 0.8(1) x 106 K [11] Highest Young’s modulus 1223 GPa [13]
Bulk modulus 443 GPa [14]
Extremely hard Mohs
hardness Mohs 10 [15]
4
and grain boundaries are part of this category. This thesis is concerned with the properties of point defects.
It is a truth universally acknowledged that not all diamonds are created equal. In the early part of the 20th century it was noticed that a set of absorption lines in the IR spectra of diamonds was not always present. Robertson et al proposed that diamond could be classified according to this property; referring to diamonds with these IR features as Type I, and the smaller set which did not, Type II [28]. These features were later identified as being caused by the presence of nitrogen.
This system was later refined by Sutherland to include the aggregated state of the nitrogen and later to include the presence of boron in the lattice [29]. Diamonds could now be classified into five categories depending on the nature of the impurities they contain as outlined in Table 1-2. The first sub division, Type I, splits into samples with aggregates of nitrogen, Type Ia, and Type Ib containing substitutional nitrogen or C-centres, (Ns). Type Ia is further refined
by the nature of the aggregates present: Type IaA has next neighbours pairs (A-centres) [30] and Type IaB where the nitrogen forms B-centres (four nitrogen atoms about a vacancy) [31]. Samples containing significant concentrations of A- and B-centres are referred to as Type IaAB diamonds. The purer Type II samples can be subdivided into two categories depending on the detectable presence of boron in the sample. If substitutional boron is detected the sample is classified as a Type IIb. When neither nitrogen or boron are detectable the sample is a Type IIa.
D iam ond Type D escription
Type I contain nitrogen concentration measurable by IR (> ~ 1 ppm) Ia Nitrogen forms aggregate clusters
IaA Contains nitrogen as A-centres IaB Contains nitrogen as B-centres
Ib Contains single substitution of nitrogen.
Type II contain nitrogen concentration not measurable by IR (<~1 ppm) IIa No detectable boron
[image:23.595.56.539.75.218.2]Chapter 1. Introduction
5
1.2
Motivation for study
The primary impurity in synthetic diamond is nitrogen. Measurement of the incorporation of impurities aids the understanding of nitrogen’s effect on the properties of the final material [32] and furthermore offers insight into growth conditions [33,34]. The recent improvements in the production of highly pure synthetic diamonds have challenged the detection limits of classical techniques [35]. Material with nitrogen concentrations below 100 ppb are impossible to reliably measure with non-destructive optical techniques and even destructive techniques such as SIMS and combustion are unable to provide accurate results [36–41]. Optically detected magnetic resonance is capable of single detection of some defects [42,43] but these are an exciting exception rather than the rule.
Electron paramagnetic resonance, EPR, offers an attractive solution to detection at these low concentration limits. In Type IIa samples nitrogen is predominately substitutional and in the neutral charge state, due to the lack of electron acceptors, therefore paramagnetic. EPR is non-destructive and offers potential detection of sub ppb concentrations. In practice the stiff, spin diffuse lattice of diamond creates long relaxation times, therefore saturation effects limit the measureable concentrations well above 1 ppb. The work presented here will build on the use of field modulated rapid passage EPR, RP-EPR(FM), previously shown to be
quantitative [44,45], as a technique to negate saturation effects and assess low concentrations.
The drive towards using diamond for quantum devices has centred around a number of functional defects that show optically effected spin polarisation states [46,47]. Long relaxation times that are a problem for EPR measurement are excellent potential sources of coherent memory in quantum applications. As such, the understanding of relaxation mechanisms is important to enable the tailoring of defect properties. In this work, uniaxial stress is used as a perturbation to investigate the relaxation mechanisms of 0
S
N and the migration of R2. The
possibilities offered by coupled systems, either as a gate in quantum devices or as a method for reading out spin states of a separate defector, are of interest [48]. Optically pumped magnetic resonance will also be used to investigate the properties of two potentially coupled systems 15 0
S
6
1.3
Thesis outline
The remainder of this thesis contains three background chapters and four chapters of results:
In addition to the background information in this chapter, Chapter 2 provides a synopsis of relevant previous work. It covers the production of diamond and the history of pertinent defects.
Chapter 3 provides the theoretical basis for experiments performed and outlines the theory underpinning magnetic resonance and optical techniques used in the results chapters. A brief history of EPR is also presented.
The final background chapter, Chapter 4, provides information regarding the experimental aspects of EPR and other techniques used. The spectrometers and equipment used in this work are detailed and key points regarding experimental procedures are outlined.
Chapter 5 explores the quantification of nitrogen in diamond using EPR. The use of RP-EPR(FM) to lower detection limits is presented. Some of the challenges posed by large or high concentration samples are also investigated.
The use of high pressure EPR to investigate 0 S
N is presented in Chapter 6. The
work focuses on the rotation of the defect within the lattice and its impact on relaxation times.
Chapter 7 covers the optically induced spin polarisation of the 15 0 S
N and 15 0 3
N V
defects. This work not only investigates the conditions required for optimal electron spin polarisation but also demonstrates that this spin polarisation is transferred to the bulk 13
C
matrix of the sample by use of NMR. The final experimental chapter discusses the migration of the R2 defect in diamond. Chapter 8 covers the use of annealing under uniaxial stress to create a preferentially oriented population which can then be used to measure the energy associated with reorientation and migration.
Chapter 1. Introduction
7
1.4
References
[1] A. Hirsch, Nat. Mater. 9, 868 (2010).
[2] G. Davies and T. Evans, Proc. R. Soc. London 328, 413 (1972).
[3] A. M. Edmonds, Magnetic Resonance Studies of Point Defects in Single Crystal Diamond - PhD Thesis, University of Warwick, 2008.
[4] K. Anderson, MRS Bull. Septem ber, 66 (1994).
[5] R. S. Balmer, J. R. Brandon, S. L. Clewes, H. K. Dhillon, J. M. Dodson, I. Friel, P. N. Inglis, T. D. Madgwick, M. L. Markham, T. P. Mollart, N. Perkins, G. Scarsbrook, D. J. Twitchen, A. J. Whitehead, J. J. Wilman, and S. M. Woollard, J. Phys. Condens. Matter 21, (2009).
[6] A. Sabella, J. Piper, and R. P. Mildren, Opt. Lett. 35, 3874 (2010).
[7] H. Liu, S. Reilly, J. Herrnsdorf, E. Xie, V. G. Savitski, A. J. Kemp, E. Gu, and M. D. Dawson, Diam. Relat. Mater. 65, 37 (2016).
[8] K. Fox, J. Palamara, R. Judge, and A. D. Greentree, J. Mater. Sci. Mater. Med. 24, 849 (2013).
[9] R. J. Narayan, R. D. Boehm, and A. V. Sumant, Mater. Today 14, 154 (2011). [10] S. Hadlington, IEE Rev. 51, 30 (2005).
[11] J. E. Field, The Properties of Natural and Synthetic Diamond (Academic Press, London, 1992).
[12] T. R. Anthony, W. F. Banholzer, J. F. Fleischer, L. Wei, P. K. Kuo, R. L. Thomas, and R. W. Pryor, Phys. Rev. B 42, 1104 (1990).
[13] S. F. Wang, Y. F. Hsu, J. C. Pu, J. C. Sung, and L. G. Hwa, Mater. Chem. Phys. 85, 432 (2004).
[14] H. J. McSkimin, J. Appl. Phys. 24, 988 (1953).
[15] S. Mukherjee, Applied Mineralogy: Application in Industry and Enviroment (Springer Science & Business Media, 2012).
[16] S. Shikata, Diam. Relat. Mater. 65, 168 (2016).
[17] O. A. Williams, R. B. Jackman, C. Nebel, and J. S. Foord, Diam. Relat. Mater. 11, 396 (2002).
[18] M. Franklin, A. Fry, K. K. Gan, S. Han, H. Kagan, S. Kanda, D. Kania, R. Kass, S. K. Kim, R. Malchow, F. Morrow, S. Olsen, W. F. Palmer, L. S. Pan, F. Sannes, S. Schnetzer, R. Stone, Y. Sugimoto, G. B. Thomson, C. White, and S. Zhao, Nucl. Inst. Methods Phys. Res. A 315, 39 (1992).
[19] P. Neumann, I. Jakobi, F. Dolde, C. Burk, R. Reuter, G. Waldherr, J. Honert, T. Wolf, A. Brunner, J. H. Shim, D. Suter, H. Sumiya, J. Isoya, and J. Wrachtrup, Nano Lett. 13, 2738 (2013).
[20] Z. J. Ayres, A. J. Borrill, J. C. Newland, M. E. Newton, and J. V. Macpherson, Anal. Chem. 88, 974 (2016).
[21] J. Svítková, T. Ignat, Ľ. Švorc, J. Labuda, and J. Barek, Crit. Rev. Anal. Chem. 46, 248 (2016).
8
Appl. Phys. Lett. 101, (2012).
[24] L. J. Rogers, K. D. Jahnke, M. H. Metsch, J. M. Binder, T. Teraji, H. Sumiya, J. Isoya, M. D. Lukin, P. Hemmer, and F. Jelezko, Phys. Rev. Lett. 113, 1 (2014).
[25] H. Clevenson, M. E. Trusheim, T. Schroder, C. Teale, D. Braje, and D. Englund, Nat. Phys. 11, 393 (2015).
[26] J. R. Maze, P. L. Stanwix, J. S. Hodges, S. Hong, J. M. Taylor, P. Cappellaro, L. Jiang, M. V. G. Dutt, E. Togan, A. S. Zibrov, A. Yacoby, R. L. Walsworth, and M. D. Lukin, Nature 455, 644 (2008).
[27] M. Lannoo and J. Bourgoin, Point Defects in Semiconductors I: Theoretical Aspects, 1st ed. (Springer, 1981).
[28] R. Robertson, J. J. Fox, and A. E. Martin, Philos. Trans. R. Soc. London 23253, 463 (1934).
[29] G. B. B. M. Sutherland, D. E. Blackwell, and W. G. Sinmeral, Nature 174, 901 (1954). [30] G. Davies, Whitehall Pap. 3, 35 (1976).
[31] R. M. Chrenko, R. E. Tuft, and H. M. Strong, Nature 270, 141 (1977). [32] H. Godfried, WO 2004.0464271 (2004).
[33] Y. V. Babich, B. N. Feigelson, D. Fisher, A. P. Yelisseyev, V. A. Nadolinny, and J. M. Baker, Diam. Relat. Mater. 9, 893 (2000).
[34] Z. Yiming, F. Larsson, and K. Larsson, Theor. Chem. Acc. 133, 1 (2014).
[35] A. Tallaire, A. T. Collins, D. Charles, J. Achard, R. Sussmann, A. Gicquel, M. E. Newton, A. M. Edmonds, and R. J. Cruddace, Diam. Relat. Mater. 15, 1700 (2006). [36] A. T. Collins, Phys. B Condens. Matter 185, 284 (1993).
[37] F. De Weerdt and A. T. Collins, Diam. Relat. Mater. 17, 171 (2008).
[38] N. Fujiyama, A. Karen, D. B. Sams, R. S. Hockett, K. Shingu, and N. Inoue, Appl. Surf. Sci. 203–204, 457 (2003).
[39] J. E. Butler, Diam. Conf. (2015).
[40] S. R. Boyd, A. Rejou-michel, and M. Javoy, 6, 297 (1995).
[41] K. Ohno, F. Joseph Heremans, L. C. Bassett, B. A. Myers, D. M. Toyli, A. C. Bleszynski Jayich, C. J. Palmstrom, and D. D. Awschalom, Appl. Phys. Lett. 101, (2012).
[42] E. Neu, D. Steinmetz, J. Riedrich-Muller, S. Gsell, M. Fischer, M. Schreck, and C. Becher, New J. Phys. 13, (2011).
[43] F. Jelezko and J. Wrachtrup, J. Phys. Condens. Matter 16, R1089 (2004).
[44] D. G. Mitchell, M. Tseitlin, R. W. Quine, V. Meyer, M. E. Newton, A. Schnegg, B. George, S. S. Eaton, and G. R. Eaton, Mol. Phys. 111, 2664 (2013).
[45] B. L. Cann, Magnetic Resonance Studies of Point Defects in Diamond - PhD Thesis, University of Warwick, 2005.
[46] C. Wang, C. Kurtsiefer, H. Weinfurter, and B. Burchard, J. Phys. B At. Mol. Opt. Phys. 39, 37 (2006).
[47] M. W. Doherty, V. V. Struzhkin, D. A. Simpson, L. P. McGuinness, Y. Meng, A. Stacey, T. J. Karle, R. J. Hemley, N. B. Manson, L. C. L. Hollenberg, and S. Prawer, Phys. Rev. Lett. 112, 47601 (2014).
Chapter 2. Introduction
9
Chapter 2
Equation Chapter 2 1
2
Introduction
purpose of this chapter is to offer a brief historical perspective on diamond research and the field of electron paramagnetic resonance, EPR. An exhaustive review is beyond the scope of this thesis but this chapter aims to cover the background necessary to understand later results and put them into context. An overview of synthetic diamond production is followed by a more in-depth look at the defects that are studied in this thesis. Finally, a brief history of EPR and its key techniques is presented.
Diamond synthesis
Under atmospheric conditions the lowest energy state of carbon is graphite (Figure 2-1 The pressure temperature phase diagram of carbon showing the relevant area for diamond growth adapted from [4]. The pressure of CVD growth has been exaggerated for clarity adapted from [2].). Therefore, for diamonds to be grown either the pressure and temperature need to be altered so that the diamond structure becomes thermodynamically stable, or chemical kinetics must be altered to allow diamond to be produced in the graphite stable region. The first approach is used in high pressure high temperature, HPHT, and the latter is employed in chemical vapour deposition, CVD, synthesis. Diamonds may also be produced through detonation and impact (HPHT for a short time) but these approaches will not be discussed here [1]. This work considers only growth of single crystal diamond; reviews of polycrystalline diamond and nanocrystalline diamond are available [2].
2.1.1
HPHT
10
be seen in Figure 2-1 The pressure temperature phase diagram of carbon showing the relevant area for diamond growth adapted from [4]. The pressure of CVD growth has been exaggerated for clarity adapted from [2].; the conditions of growth typically used in the commercial growth of HPHT diamonds using metal solvent are highlighted.
During synthetic diamond growth temperatures in the range of 1200-1700 °C and pressures of 5-6 GPa are typically used [5,6], but higher temperatures and pressures can be employed [7]. For single crystal HPHT growth, seeds are placed inside a capsule containing a metal solvent along with a source of high purity carbon. Either a temperature or a solubility gradient is used to transfer the high purity carbon to the seed. The advantage of the metal solvent is that it allows a lower temperature to be used in diamond growth than could be achieved through non-catalytic growth [4]. The solvents used are typically transition metals; iron, nickel, cobalt or alloys of these metals [4,8].
[image:29.595.117.475.70.340.2]To achieve the high pressures required a number of different types of apparatus are available, including belt presses, split sphere presses and cubic presses. It is beyond the scope of this review to fully cover HPHT growth and in depth reviews are available [8].
Chapter 2. Introduction
11
Diamonds grown by the HPHT method are prone to the incorporation of nitrogen during growth. Nitrogen is incorporated into the growth chemistry from a number of sources; impurities in the growth media (graphite, metal solvent), from atmospheric gases or from adsorbates on the capsule [6]. Unless efforts are made to control nitrogen content, concentrations of 100-300 ppm are typical, although concentrations up to 3000 ppm have been reported [9]. Nitrogen is predominantly incorporated substitutionally in the diamond lattice as
N
S. When the growth temperature is high enough aggregation into nitrogen pairs, A-centres, occurs [10].The growth morphology of the diamond is determined not only by the growth chemistry but by temperature and pressure [11]. Morphology is important when considering impurities, as incorporation rates alter between growth sectors; for example, under normal growth conditions highest nitrogen incorporation is found in {111} growth sectors followed by the {001}, {113} and {110} growth sectors [12]. Thus incorporation of nitrogen has a temperature dependence with higher temperatures increasing uptake in the {111} and {001} growth sectors [13]. The uptake of nitrogen was investigated through growth zoning experiments, where the conditions of growth were modified during the growth process. These experiments linked growth rate with uptake of nitrogen samples showed increased nitrogen levels in the faster growing sectors [14]. The amount of nitrogen in the final lattice can be controlled by the addition of a nitrogen “getter” into the capsule, typically Ti or Al which have a strong affinity to nitrogen [15]. This reduces the uptake of nitrogen at the cost of potential inclusion of the “getter” into the end product [16]. This approach has been used to create 10 ct synthetic colourless gemstones [17].
It is also possible to control incorporation impurities by evacuation and outgassing the sealed growth capsule before growth begins [6]. This process can be used to reduce the nitrogen uptake in diamonds and may also be exploited for intentional doping of the material. An example of this doping would be the creation of isotopically enriched samples by using isotopically enriched material in the growth capsule. Diamonds with ≥95% 15
12
demonstrated [18,19].
2.2.1
CVD
Where HPHT attempts to mimic the natural process of diamond creation, CVD operates in conditions far outside the thermodynamically stable region for diamond growth (Figure 2-1). To achieve growth CVD utilises chemical kinetics which favour sp3 growth over sp2. This process was first demonstrated in 1962 [20]. During CVD growth source gases containing carbon and hydrogen are disassociated to form radicals. Typical gases are
H
2andCH
4 with a much higher percentage ofH
2 [21]. The carbon radicals are laid down epitaxially onto a seed material forming both sp3 and sp2 material. The hydrogen radicals help growth, stabilising the sp3 growth by terminating the surface. The growth surface is then reactivated by hydrogen mediated abstraction of a surface hydrogen, exposing a carbon which may then bond to an incoming carbon radical or another hydrogen radical [22].There are a number of methods for dissociating the source gases including direct heating with a hot filament and microwave plasma heating, MP-CVD. Hot filament is the simplest method of CVD growth. A filament, classically tungsten, is heated to 2000 °C and the source gases, typically methane and hydrogen, flow over it and are dissociated before deposition of diamond on a cooler plate below. There are problems associated with this growth method: growth rates are reduced if the tungsten reacts with the methane, inhibiting the disassociation of source gases and slowing growth rates, and samples are susceptible to incorporation of the filament material [23].
MP-CVD of diamond is the focus of much modern research and has produced the highest purity material [24]. MP-CVD operates in a wide parameter space with source gasses, temperature, pressure, plasma shape, power density, dopant gasses and substrate material all influencing growth [25]. A typical growth uses microwaves of frequency 2.45GHz, using H2
Chapter 2. Introduction
13
growth are typically between 1-150µm/h with the high growth rates producing lower quality material. Reviews of the current state of MP-CVD of diamond are available [25,27].
Single crystal diamond is normally grown on a diamond substrate, homoepitaxial growth. This approach gives high quality crystal but limits the size of samples grown due to the availability of large single crystal diamond substrate; typically, the maximum size of a sample is 1 cm across. An alternative approach is to grow onto layered non-diamond material, heteroepitaxial growth. These materials need to have a close match to the diamond lattice parameter and must not melt during CVD growth, for example an iridium layer on silicon Si [28]. This process allows much larger wafers, 100mm diameter [29], to be produced but the material is highly strained [30]. A further approach to creating larger substrates is to clone a sample and create a mosaic of samples with the equivalent crystalline states which have a homoepitaxial layer grown on top. This has produced samples 25mm across with reduced mechanical strain compared to heteroepitaxial grown samples but the substrate boundaries cause dislocations into the material [31].
The material used for the substrate has a large effect on the grown material. Any surface defects on the substrate propagate through the grown material creating a high density of dislocations [32]. The strain of these dislocations causes birefringence greatly affecting the optical properties of the material [33]. Plasma etching the material prior to growth can greatly reduce the density of dislocations, as can growth of low strain HPHT substrates [34]. The highest quality optical grade material is currently grown {001} HPHT material and with a small amount of nitrogen in the growth chemistry. These conditions reduce the dislocation density and therefore reduces the lattice strain [35].
As with HPHT, nitrogen remains the main impurity incorporated during CVD growth despite a low incorporation probability, ~0.01-0.001% [36]. Although, in theory, it is possible to control all the gases used in CVD growth, it is a great challenge to exclude all nitrogen from the growth chamber and source gases. The purest reported samples have a <0.2 ppb concentration of 0
S
14
used during growth have been shown to have an unfavourable effect on the material grown [38].
Defects in diamond
Any structure or impurity that deviates from the perfect diamond lattice is a defect. These defects can be large structures such as dislocations, inclusions or twinning or may be point defects such as impurities, vacancies and interstitials. This work is focused on point defects in diamond. There is a myriad of such defects and this section will cover the background for defects that are relevant to later work.
2.3.1
Radiation damage
When the diamond lattice is irradiated with particles of sufficiently high energy, carbon atoms can be displaced from the lattice site. The exact nature of the damage caused by the irradiation depends on the conditions of irradiation and the starting material but in general vacancy interstitial pairs are created in the lattice. The study of the defects created in this manner has been conducted with many spectroscopic techniques and a large number of defects have been identified.
Vacancies
The neutral vacancy, 0
V , has a zero phonon line, ZPL, that is observed as a doublet at
1.673 eV (741.1 nm) and 1.665 eV (744.6 nm) which are collectively labelled GR1 along with the vibronic side band [39]. There is also a series of features between 2.880-3.010 eV labelled GR2-8 that have been assigned to electronic transition of the neutral vacancy [40,41]. Uniaxial stress measurements of GR1 in combination with theoretical analysis determined the defect had
T
d symmetry and the doublet corresponded to transitions between a 1E
ground state and a 12
T
excited state [42,43].Chapter 2. Introduction
15
state of the vacancy, V, by comparison to GR1 in nitrogen rich diamonds [45]. Vhas a 4
A
2 ground state that is S=3/2 and is EPR active [46]. The ground state of 0V is S=0 [47] and as
such is EPR silent. With optical illumination of energy greater than 3.1 eV the 5 2
A
excited state of the defect that is S=2 has been observed in EPR [48].The migration energy of both V and V0 has been determined as 2.3(3) eV through isothermal
anneals [49,50]. The anneals revealed an intermediate step at 1.7(2) eV that corresponded to a 15% drop in GR1; this was interpreted as the recombination of vacancies with local interstitials [50,51]. Once the vacancy becomes mobile it can aggregate with other impurities and with itself forming divacancies, in high purity low strain material. The divacancy has been identified as the source of the EPR spectrum called R4/W6 and has been correlated to the TH5 optical absorption band [52,53].
〈
001
〉-split interstitial
There is potentially a family of self-interstitial related defects that could occur in diamond but theory suggested that the 〈001〉-split interstitial, 0
001
I
, is the configuration with the lowest energy [54].The R2 EPR spectrum was initially reported as the c system, in electron irradiated Type IIa diamonds by Faulkner in 1962 [55]. The spectrum has broad EPR lines and is axially symmetric around 〈111〉 unlike many irradiation related defects. An S = 1 defect, the EPR signal has an unusually large zero field splitting, D/h = ±4173(3)MHz. The spectrum arises from an excited triplet state 50meV above the ground singlet state [56].
R2 also has very large line widths, up to ~8mT, but a narrow line width on the
M
s
2
16
in
N
S, but no evidence of this has been witnessed between 77 K and 650 K. Temperature measurements are impossible below this range due to the depopulation of the excited state that gives rise to R2, and above this range the defect is destroyed.The geometric structure of the defect that gave rise to the R2 spectrum remained a subject of debate for 40 years with two proposed models: the compressed vacancy [54] and 0
001
I
[57]. The 0001
I
was supported by ab initio calculations using local-density-functional pseudopotential theory predictions that it was the only stable structure for the interstitial [58]. The 0001
I
configuration was eventually confirmed experimentally by Hunt using the angular dependence of the EPR spectrum [56]. The 0001
I
can be seen in Figure 2-2 and is a D2d defect that consists of two central carbon atoms sharing a site. These two carbons have a sp2 bond between them and non-bonding π orbitals normal to the plane of the sp2 bond. In addition to the R2 EPR spectrum, 0001
I
also has two associated optical absorption features at 1.685 eV (735.8 nm) and 1.859eV (666.9 nm) [56,59,60].Other interstitial defects
The di-〈001〉-split interstitial can be created through the aggregation of mobile interstitials during irradiation [61]. R1 was first observed in EPR in electron irradiated type II diamonds [55] but has also been seen in type I material but at a lower production rate [62].
Figure 2-2 Left, the structure of 〈001〉-split interstitial, R2, defect, the interstitial atoms are darker and highlighted in red. Right. An EPR spectrum of an irradiated diamond with the R1 and R2 spectra highlighted. 200 250 300 350 400 450 500
E
P
R (
au)
Field (mT)
R2
Chapter 2. Introduction
17
R1 was assigned as the nearest neighbour di-〈001〉-split interstitial by study of the 13
C EPR
spectrum. The R1 defect has
C
1h symmetry and is S=1. It has electrons in parallel non-bonding orbitals perpendicular to the {110} plane of the defect.R1 is formed even if irradiation is carried out at temperatures below 100 K [63] indicating that interstitials are mobile during irradiation even at low temperatures. To explain this a hypothetical highly mobile interstitial, *
I
, was assumed to be present during the anneal [50].As well as the nearest neighbour di-〈001〉-split interstitial there is also the Humble or next nearest neighbour configuration of the di-〈001〉-split interstitial. DFT calculations predict that the Humble interstitial is a lower energy configuration than R1 by 0.7 eV [64]. The Humble interstitial is
S
0
but has been correlated with the optical absorption spectrum, 3H, which has a ZPL at 2.465 eV (503.4 nm) [64]. 3H is created by electron irradiation and its production increases linearly with concentration of A-centres and linearly decreases with concentration of B-centres [65]. There is increased production of 3H with irradiation at 80 K compared to room temperaturee irradiation [66].2.4.1
Nitrogen in diamond
Single substitutional nitrogen
Single substitutional nitrogen in the neutral charge state, 0 S
N , is possibly the most common
impurity in synthetic diamond. Nitrogen enters the lattice substitutionally during growth, having been present during the growth process. Nitrogen is either intentionally used in growth chemistry to increase growth rates [38,67,68] or is incorporated from impurities in the growth gases.
The geometric structure of 0 S
N is simple with the nitrogen replacing carbon on a lattice site
18
is elongated by approximately 25-28% and the remaining C-N bonds shrink by ~3% [69–71]. The consequent reduction of symmetry from
T
d toC
3v was confirmed by EPR [72,73]. The unpaired electron is accommodated into any one of the four possible C-N bond anti bonding orbitals and can relax into any of the 〈111〉 directions. In the absence of local lattice strain, the energy of each orientation of the defect will be equivalent, therefore an equal population in all orientations is found. It is possible for the elongated C-N bond to reorient between sites either by hopping at high temperatures or tunnelling at moderate/low temperatures between sites [74–76].Initial EPR reports of 0 S
N , commonly known as P12, were from work using natural diamonds
in 1959 by Smith et al. [73]. The EPR signals of both the 13C structure and “forbidden” transitions were later identified in EPR by Loubser [77]. Subsequently 8 different 13C sites
have been identified experimentally showing good agreement to predictions from ab initio
calculations [72,78,79].
Substitutional nitrogen can also be found in the positive charge state, NS. NS0 creates a deep
lying donor state and can donate an electron to nearby defects. NS is a S=0 defect and as
such cannot be assessed with EPR, however, it does give rise to an absorption line at 1332 cm-1, and is associated with two additional features at 905 cm-1 and 1046 cm-1 [80]. There is also
2 Poughkeepsie one/Paramagnetic one
Figure 2-3 Left, the structure of the 𝑁𝑠0. Nitrogen atom is represented in blue. Right, An experimental spectrum of a diamond containing 1 ppm of 𝑁𝑠0with 𝐵0aligned along the [001] crystalline direction.
343 344 345 346 347 348 349 350 351 352
E
P
R (
au)
Chapter 2. Introduction
19
some evidence of the existence of NS but it remains unclear if this a stable charge state for
the defect [81].
Nitrogen related aggregates
Annealing of the diamond above 1950 K for extended periods creates A-centres; a complex of two neighbouring nitrogen atoms [10]. The A-centre has features between 1050-1330 cm-1 with a prominent peak at 1282 cm-1. The rate of aggregation of nitrogen is increased by the presence of vacancies in the lattice allowing the formation of A-centres at lower temperatures [82].
There is a family of vacancy nitrogen complexes (
N V
m n) in diamond. One of the more common is the B-centre which is found after further heat treatment of samples containing A-centres. The B-centre consists of four nitrogen atoms surrounding a vacancy,N V
4 , and has a prominent feature at 1332 m-1 [70]. The 0NVN defect has been observed in EPR [48] as well
as the H3 optical absorption feature, and the H2 optical has been confirmed as arising from
NVN [83].
Nitrogen vacancy
The most well-known nitrogen related point defect in diamond is probably the nitrogen vacancy centre, NV (Figure 2-4). Du Preez observed that an absorption band around 1.945 eV
(637 nm) appeared in samples that had been irradiated and annealed to 900 K [84]. Uniaxial stress measurements determined that the defect had
C
3v symmetry and ZPL at 1.945 eV originated from a transition between an A ground state and excited E state [85]. Theabsorption was suggested as originating from a vacancy next to a substitutional nitrogen.
EPR of diamonds that had received similar treatment to that used by du Preez, found a new EPR centre. This centre was S=1, I=1 with a zero field splitting of 2.88 GHz. A
C
3v symmetry was determined for the defect by assignment of three equivalent carbon atom positions from the 1320
the NV defect. This assumption was confirmed by two laser hole burning experiments which
found antiholes at ±2.88 GHz of the EPR signal with the 1.945 eV line [87].
A further absorption band at 2.156 eV (575 nm) was observed in type Ib diamond that had undergone similar irradiation and anneal treatments [88]. Uniaxial stress measurement of the 2.156 eV ZPL determined it was from a transition between an E to A state of a
C
3v symmetrydefect [89]. A correlation was established between the 1.945 eV and 2.156 eV features and it was reported that an increase in radiation led to a sudden increase in the 2.156 eV [90]. The 1.945 eV and 2.156 eV features were assigned to NV and NV0 respectively. The argument
behind this was that at low irradiation doses after the combination of 0
V and NS0 into NV0
centres there was still a population of 0
S
N present which could donate an electron such that:
(1.1) 0 0
S S
N NV NNV
Eventually with increased radiation a critical point would be reached where there was no longer an excess of 0
S
N , allowing NV0 to be produced. Although the ground state of NV0
has not been observed in EPR, an excited state has been reported [91]. Both charge states of the defect have been reported as grown CVD material indicating that it grows in as a unit, and has been shown to be grown in with preferentially oriented populations [92,93].
Figure 2-4 Left, the structure of NV. Nitrogen atoms are shown in blue and the dotted feature represents a vacancy. Right, an experimental EPR spectrum of 𝑁𝑉−with 𝐵0aligned along [111] crystallogrpahic direction. Inset shows a zoom- in of the lone site and shows the nitrogen hyperfine splitting.
250 300 350 400 450
Ns
E
P
R (
au)
Field (mT)
-Chapter 2. Introduction
21
𝑵
𝟑𝑽
𝟎0 3
N V was amongst the first defects observed optically in diamond with a ZPL at 415 nm
reported by Walter in 1891 [94]. The defect consists of three nitrogen atoms adjacent to a vacancy (Figure 2-5). This feature, later named N3 (naturally occurring 3), was found to be very common in natural yellow diamonds and consists of a ZPL at 2.985eV (415.2 nm) and a large vibrionic structure. Studies involving irradiation and annealing of samples showed that additional broad features at 2.596eV (477.6 nm) and 3.603 eV (344.2 nm), N2 and N4 respectively, were also associated with the defect [39]. The nature of the association is still a subject of research; with the thermochromic behaviour of N2 being inconsistent with that of N3 and N4 [95].
0 3
N V was first reported in EPR in 1959 [73] as P2, but the spectrum was incorrectly assigned
to substitutional aluminium, which was thought to be a good candidate for substitutional inclusion and had previously been reported [96], also incorrectly. Poor fits to the data prompted further investigation and ENDOR revealed that the P2 spectrum was indeed the result of three equivalent nitrogen atoms [97]. Later the unique 13
C
interaction was observed using ENDOR by van Wyk [98] who later used advances in techniques to improve the parameters of the defect [99]. Correlation between N3 and P2 has been demonstrated over a range of concentrations and substantiated by similar behaviour under photo excitation [100]. The extremely complicated EPR spectrum meant a poor fit was still seen away from the [001]Figure 2-5 Left, the structure of 𝑁3𝑉0defect. Nitrogen atoms are represented in blue and The dotted feature depicts the vacancy. Right, an experimental EPR spectrum of 𝑁3𝑉0 with 𝐵0aligned along the [001] crystallographic direction.
347.0 347.5 348.0 348.5 349.0 349.5
E
P
R (
au)
Field (mT)
![Table 1-2 The classification of diamond adapted from [29].](https://thumb-us.123doks.com/thumbv2/123dok_us/9489721.455011/23.595.56.539.75.218/table-classification-diamond-adapted.webp)
![Figure 2-1 The pressure temperature phase diagram of carbon showing the relevant area for diamond growth adapted from [4]](https://thumb-us.123doks.com/thumbv2/123dok_us/9489721.455011/29.595.117.475.70.340/figure-pressure-temperature-diagram-showing-relevant-diamond-adapted.webp)
![Table 3-1 The most common nucleus with I<0 found in diamond. Natural abundancies from [5], gyromagnetic ratios from [3,6]](https://thumb-us.123doks.com/thumbv2/123dok_us/9489721.455011/61.595.129.468.73.279/table-common-nucleus-diamond-natural-abundancies-gyromagnetic-ratios.webp)


![Table 4-3 List of resonators used in this research. All resonators detailed are manufactured by Bruker expect for the LGR, adapted in part from [13]](https://thumb-us.123doks.com/thumbv2/123dok_us/9489721.455011/92.595.69.525.171.417/table-resonators-research-resonators-detailed-manufactured-bruker-adapted.webp)