http://wrap.warwick.ac.uk
Original citation:
Ahmad, Mussawar, Alkan, Bugra, Ahmad, Bilal, Vera, Daniel, Harrison, Robert,
Meredith, James O. and Bindel, Axel (2016) The use of a complexity model to facilitate
in the selection of a fuel cell assembly sequence. In: 6th CIRP Conference on Assembly
Technologies and Systems (CATS), Gothenburg, Sweden, 16-17 May 2016. Published
in: Procedia CIRP pp. 1-6.
Permanent WRAP url:
http://wrap.warwick.ac.uk/77843
Copyright and reuse:
The Warwick Research Archive Portal (WRAP) makes this work of researchers of the
University of Warwick available open access under the following conditions.
This article is made available under the Creative Commons
Attribution-NonCommercial-NoDerivatives 4.0 International (CC BY-NC-ND 4.0) and may be reused according to the
conditions of the license. For more details see
http://creativecommons.org/licenses/by-nc-nd/4.0/
A note on versions:
The version presented in WRAP is the published version, or, version of record, and may
be cited as it appears here.
Available online at www.sciencedirect.com
ScienceDirect
Procedia CIRP 00 (2016) 000–000
www.elsevier.com/locate/procedia
2212-8271 © 2016 The Authors. Published by Elsevier B.V.
Peer-review under responsibility of the organizing committee of the 6th CIRP Conference on Assembly Technologies and Systems (CATS).
6th CIRP Conference on Assembly Technologies and Systems (CATS)
The use of a complexity model to facilitate in the selection of a fuel cell
assembly sequence
Mussawar Ahmad
a*, Bugra Alkan
a, Bilal Ahmad
a, Daniel Vera
a, Robert Harrison
a,
James Meredith
b, Axel Bindel
c,
aAutomation Systems Group, WMG, University of Warwick, CV4 7AL, Coventry, West Midlands, UK bMechanical Engineering, University of Sheffield, South Yorkshire, S10 2TN
cHSSMI, Marsh Way, Rainham, RM13 8EU
* Corresponding author. Tel.: +44 (0) 2476 573413; E-mail address: [email protected]
Abstract
Various tools and methods exists for arriving at an optimised assembly sequence with most using a soft computing approach. However, these methods have issues including susceptibly to early convergence and high computational time. The typical objectives for these methods are to minimise the number of assembly change directions, orientation changes or the number of tool changes. This research proposes an alternative approach whereby an assembly sequence is measured based on its complexity. The complexity value is generated using design for assembly metrics and coupled with considerations for product performance, component precedence and material handling challenges to arrive at a sequence solution which is likely to be closest to the optimum for cost and product quality. The case presented in this study is of the assembly of a single proton exchange membrane fuel cell. This research demonstrates a practical approach for determining assembly sequence using data and tools that are used and available in the wider industry. Further work includes automating the sequence generation process and extending the work by considering additional factors such as ergonomics.
© 2016 The Authors. Published by Elsevier B.V.
Peer-review under responsibility of the organizing committee of the 6th CIRP Conference on Assembly Technologies and Systems (CATS).
Keywords: Assembly sequence planning; complexity management; proton exchange membrane fuel cell
1.Introduction
Global market pressures continuously force manufacturers to develop new and varied products to maintain a competitive edge [1]. Assembly sequence planning (ASP) is just one of the many considerations that need to be made to realise a new product [2]. This problem establishes and rationalises a sequence of component liaisons to most efficiently achieve the final assembly of a product. Importantly, the correct mechanical relationships between components attain product functionality. As the number of components increases there are an increased number of viable assembly sequences [3]. Furthermore, the complexity of component interactions also has a tendency to increase as the number of components increase, although there are exceptions to this rule. As a result of the complex component interactions, constraints are introduced such as
accessibility and geometric interference which allow assembly sequences not feasible in the real world to be disregarded [4, 5].
2 Ahmad et al./ Procedia CIRP 00 (2016) 000–000
product knowledge, make incorrect conclusions with regards to the assembly sequence, choosing what may be felt as the intuitive approach. However, this simple approach may not be the optimal solution.
To solve this problem, this research examines an approach to determine an assembly sequence based on the difficulty of achieving assembly liaisons through design for assembly (DfA) metrics coupled with considerations for product performance.
2.Review of literature and knowledge gap
This section presents the literature from various research domains to identify where gaps exist and how this research aims to fill them. First, a short examination of DfA methods is presented. Then approaches that have been used in the literature for generating ASP are critiqued. Finally, literature associated with assembly sequence complexity is discussed.
2.1.DfA Approaches
Considerations for assembly can be made at the product design stage using design for assembly methodologies [6]. Common methods include: Design for Assembly and Manufacture (DFMA), the Lucas Method, and the Hitachi Assembly Evaluation Method (AEM) [7-9]. Although the approaches that these methods take are varied, the outcomes to are similar i.e. part count reduction, optimizing part picking, handling and placing, and penalizing designs considered inefficient. These methods are not designed to identify an optimal assembly sequence, instead they attempt only to optimise the product design based on the aforementioned criteria. However, some of the considerations and criteria developed by these methods can be utilised to assess the complexity of an assembly sequence. In this research, the criteria from the Lucas Method are used.
2.2.ASP Approaches
Attempting to automatically and efficiently solve the ASP problem has resulted in the emergence of three main categories of approaches in the literature: graph/matrix-based, metaheuristics-based, and knowledge/artificial intelligence (AI) based [10,11]. A fourth type of approach, which has recently started to trend, is Product Lifecycle Management (PLM) based i.e. to use existing PLM tools such as CAD or create add-ons to concurrently design products and generate feasible, optimised assembly sequences [11, 12]. However, this could be considered a subset of knowledge/AI-based as rules are used to enrich data in PLM tools to transform it from information to knowledge.
The graph-based approach to ASP uses simple, undirected graphs to represent topological structures represented by nodes (components) and edges (connections) [13,14]. These developed into precedence or directed graphs that showed the direction of the connection adding some constraints to ASP [4]. Based on these graphs, “cut-set” i.e. assembly by disassembly, methods were used to generate all possible assembly sequences, typically represented using AND/OR graphs [15]. Although the complete set of assembly options is presented by
this approach, the number of nodes grows exponentially as the number of components increases [16]. The matrix can represent the information in both the undirected and directed graph, with the addition of component interference, but in a more machine readable format. These approaches, particularly the graphs, form the foundation of modern ASP methodologies in the literature.
To reduce the large workspace associated with products that have many components, several metaheuristic approaches have been extensively researched in the literature. Common methods include genetic algorithms (GA) , ant colony optimisation (ACO) , particle swarm optimisation (PSO) , and simulated annealing (SA) [3]. These approaches do not guarantee the optimal solution, but have been considered successful. In general, these approaches transform information in the graph, combine them with objectives such as minimising assembly direction changes and tool changes, and add constraints such as precedence, to form a multi-criteria objectives that are solved to find the optimum. Common challenges ascribed to soft-computing metaheuristic approaches are high computational time, tedious data entry and premature convergence [3]. Many of the works present limited insight on the quality of the results and have a tendency to discuss and conclude about how a given approach makes headway in the aforementioned challenging areas.
The final major category is the knowledge-based/AI approach. These approaches are developed to facilitate concurrency between product and manufacturing system design. However, the literature typically reports a lack of robustness and knowledge available at the early design stage preventing the full potential of these approaches to be realised, especially within the industrial environment [11,17]
2.3.Assembly sequence complexity
The literature presents some works that determine an optimal assembly sequence by searching for the minimal assembly sequence complexity. Common criteria and their reasoning have been extracted from the literature and presented below [18-20] :
Directional Changes require extra processes and equipment resulting in additional set-up times and operational costs. Re-orientations increase the sequence complexity and thus
cost as this is typically slow and may require additional expensive fixtures.
Assembly sequence depth considers parallelism and, depending on application, may or may not be favourable. This also corresponds to the number of steps to free a critical part from the rest of the product.
Degree of freedom refers to how constrained the component is at a given step and thus assesses assembly stability and the potential need for fixturing.
2.4.Summary and proposed contribution
study which gives attention to how an assembly sequence could affect a product’s performance and penalising according to potential impact, or the use of DfA approaches to support ASP. This research therefore aims to bridge the gap between the product and process domain by using criteria from the product domain i.e. DfA, and the process domain i.e. sequence optimization criteria, and combine them with product performance considerations to produce a unique complexity measure for an assembly sequence. The contribution to knowledge are the assumptions made, the criteria chosen and the rationale for the weighting factors to produce a more representative and holistic model than has been presented in previous works. A diagram for knowledge gap to be addressed in this research is presented in Fig. 1.
3.Methodology
Nomenclature
Ci the ith component of an assembly
CC,i complexity of Ci
Cf,i flexibility of Ci
E,i Young’s modulus of Ci
dx,i, dy,i, dz,i external dimensions of Ci
dzmin,brittle of all brittle components in the assembly,
the minimum z dimension
Mb,i brittleness of material of Ci
Cb,i brittleness of Ci
Crc,i relative cost of Ci
CA ambiguity of Ci
Cd,i diversity of Ci
Ncommon number of similar components in assembly
Ncomp number of components in assembly
COC,i orientation clarity of Ci
Oα,i, Oβ,i rotational symmetry of Ciwith respect to α
and β respectively
Ce,i exposure sensitivity of Ci
T sensitivity to temperature
RH sensitivity to relative humidity
D sensitivity to dust
Lj the jth liaison of an assembly
LC,j complexity of Lj
Lcr,j component complexities of Lj
La,j assemblability of Lj
Cstat, Csubstat static component, static subassembly
Cdyn, Csubdyn dynamic component, dynamic subassembly
Lpfm,j part fastening method of Lj
Lad,j assembly difficulty of Lj
Ls safety consideration of Lj
Sm the mth sequence in a set being evaluated
SC,m complexity of Sm
Nsteps,m total number of steps in Sm
n,m step number in Sm
Sexp,m component exposure at sequence level
Sdyn Dynamic assembly penalty in Sm
Svis,m Visibility penalty in Sm
NTC,m Number of tool changes in Sm
NAD,m Number of direction changes in Sm
The starting point for this work is that the process planner has already determined a set of viable sequences for a “simple” product, but cannot decide which is the optimal due to lack of obvious constraints. In this section the criteria and objectives that determine the optimal assembly sequence are described and the rationale behind them discussed. This research does not present a method for automatically generating viable assembly sequences or an algorithm to reduce search space. It best aligns with research associated with solving ASP using knowledge-based approaches. A diagram of the model is presented in Fig. 2. The following assumptions have been made in this research:
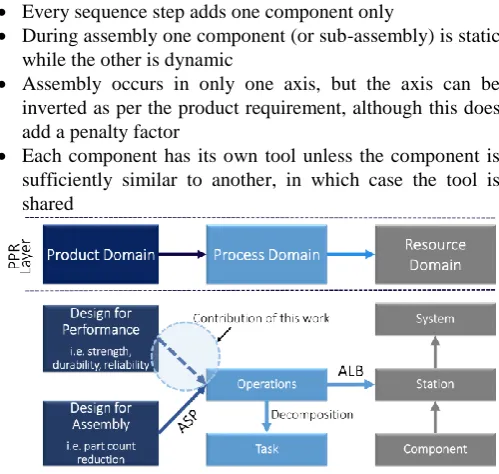
Parallel assembly operations are allowed Every sequence step adds one component only
During assembly one component (or sub-assembly) is static while the other is dynamic
Assembly occurs in only one axis, but the axis can be inverted as per the product requirement, although this does add a penalty factor
[image:4.595.312.562.224.461.2] Each component has its own tool unless the component is sufficiently similar to another, in which case the tool is shared
Fig. 1. Product realisation process presented through a PPR model and highlighting the contribution of this work
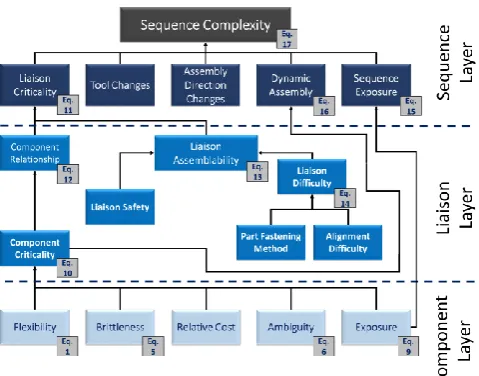
3.1.Component complexity
CC is composed of several considerations: flexibility,
brittleness, relative cost, ambiguity and exposure, that are properties of component, Ci. Component flexibility, Cf, uses
component information, and combines this with material properties to provide a metric of the mechanical compliance of the component being handled. A more flexible component is generally more difficult to handle as it may need more support, thus more complex tooling. This factor is calculated in axes that are not the assembly axis (Fig. 3) (Eq. 1). As the range of flexibility values may be quite large, and thus mask complexity arising from other considerations, the values are normalized with respect to the most flexible component in the assembly, 𝑘𝑎𝑣𝑔,𝑚𝑖𝑛.
𝐶𝑓,𝑖 = 𝑘𝑎𝑣𝑔,𝑚𝑖𝑛
𝑘𝑎𝑣𝑔,𝑖 (1)
𝑘𝑎𝑣𝑔,𝑖 =𝑘𝑥+𝑘𝑦
4 Ahmad et al./ Procedia CIRP 00 (2016) 000–000
where kx and kyare spring constants given by Eq.3 and Eq.4
respectively:
𝑘𝑥,𝑖 = 𝑑𝑦,𝑖 𝑑𝑧,𝑖 𝐸,𝑖
𝑑𝑥,𝑖 (3)
𝑘𝑦,𝑖 = 𝑑𝑥,𝑖 𝑑𝑧,𝑖 𝐸,𝑖
𝑑𝑦,𝑖 (4)
[image:5.595.303.549.63.257.2]Next, the brittleness of the component is considered. Although brittle materials are stiff, there is a risk of damage as a result of shocks, thus there is a criticality associated with their handling. There is no universally accepted method for determining the brittleness of a material [21]. Furthermore, even if one did exist, it would be necessary to determine whether the component itself was brittle, based on geometry, temperature or humidity.
Fig. 2 Assembly sequence complexity model
In this research, the author’s assume that the designer or process planner have a basic, engineering understanding of material properties and determine materials to be either brittle or not. If the material is brittle, then thickness of the thinnest brittle component in the assembly is divided by the lowest average thickness of Ciwith respect to x, y or z. In this case of
this work, the z-axis is always thinnest, Cbis thus defined as per
Eq. 5:
𝑀𝑏∈ (0,1): 𝑖𝑓 1 𝑡ℎ𝑒𝑛 𝐶𝑏,𝑖= 𝑑𝑧𝑚𝑖𝑛,𝑏𝑟𝑖𝑡𝑡𝑙𝑒
𝑑𝑧,𝑖 (5)
Cost (Crc) is typically difficult to define at the early product
design stage. In this approach, the cost is considered by identifying component costs as a percentage of product costs. In this research this data has been extracted from [22, 23]. If only a subassembly is examined using the model, then the cost is calculated relative to the most expensive component in the assembly. Ambiguity, CA (Eq. 6),is a combination of two
factors: Cd, a measure of the commonality of the components
in the assembly (Eq. 7) and COC,a geometric property of the
component(Eq. 8). In this instance, diversity is beneficial i.e.
it reduces complexity as it is easier for an operator or an automated system to discern between components. Orientation clarity is a principle introduced in DfA methods associated with component symmetry and indicates how clear it is that a component should be placed in a given orientation [8, 9].
𝐶𝐴,𝑖= 𝐶𝑂𝐶,𝑖3+𝐶𝑑,𝑖 (6)
𝐶𝑑,𝑖= 𝑁𝑐𝑜𝑚𝑚𝑜𝑛𝑁
𝑐𝑜𝑚𝑝 (7)
[image:5.595.39.279.251.439.2]𝐶𝑂𝐶,𝑖= 𝑂𝛼,𝑖+𝑂𝛽,𝑖 (8)
Fig. 3. Coordinate system of arbitrary component as assumed in this model Where Oα,i, and Oβ,i are given by: rotational symmetry = 0,
easy to see rotational orientation = 0.5 and difficult to see rotational orientation = 1 (adapted from Lucas method). Ce (Eq.
9), is a factor which considers a component’s sensitivity to environmental conditions. This property is also penalized when the component is exposed during assembly (Eq. 15) i.e. it is unwise to expose components sensitive to exposure if a parallel assembly approach used. All of these parameters are then summed (Eq. 10).
𝑇, 𝑅𝐻, 𝐷 ∈ (0,1): 1 if true for 𝐶𝑖, 𝐶𝑒,𝑖= 𝑇+𝑅𝐻+𝐷3 (9)
𝐶𝐶,𝑖=𝐶𝑓,𝑖+𝐶𝑏,𝑖+𝐶𝑟𝑐,𝑖+𝐶𝐴,𝑖+𝐶𝑒,𝑖
5 (10)
3.2.Liaison complexity
The complexity, LC (Eq. 11), of liaison, Lj, is defined by i)
the relationship between two components, Lcr(Eq. 12) and ii)
the nature of the relationship, La(i.e. coincident, concentric,
perpendicular) (Eq. 13) [24]. Therefore, the contributing factors of a liaison’s complexity are influenced in part by CC
and in part by the difficulty of achieving a given liaison and its impact on the assembly i.e. liaison assemblability (Eq. 11).
𝐿𝐶,𝑗=𝐿𝑐𝑟,𝑗+𝐿𝑎,𝑗
2 (11)
𝐿𝑐𝑟,𝑗 =
𝐶𝑠𝑡𝑎𝑡+𝐶𝑑𝑦𝑛
2 (12)
𝐿𝑎,𝑗=𝐿𝑠,𝑗+𝐿𝑑,𝑗
2 (13)
The safety aspect considers the role the liaison plays in preventing external gas leakage and the nature of the gas that could leak. Although the safety factor is quite specific to the fuel cell, it is entirely plausible to replace this with considerations specific to a different product. Lsis given one of
three values: no risk of gas leakage = 0, risk of reactant air leakage = 0.5, risk of hydrogen leakage = 1. Ld is given by Eq.
14, with Lpfm, and Lad being metrics adapted from the Lucas
method [8].
𝐿𝑑,𝑗=𝐿𝑝𝑓𝑚,𝑗+𝐿𝑎𝑑,𝑗
In this research the Lpfm can either be: self-holding = 0.33,
adhesive based = 0.67 or no fastening = 1. The rationale for penalizing adhesive based fastening is a risk that misalignment will cause scrappage. The Lad can either be easy to align = 0,
difficult to align = 0.7 or no alignment feature = 1. The combination of these factors make it possible to consider how the characteristics of the components in a product, and the characteristics of the relationships of the components impact upon the complexity of an assembly sequence.
3.3.Sequence complexity
Component and liaison complexity as well as the traditional criteria that have been used in existing literature are combined to find SC(Eq. 17). The sequence complexity examines the state
of the assembly prior to executing a liaison and then if appropriate, adds a penalty factor if there is a change that increases the sequence complexity. An exponent function is used to amplify and assess the effect of NTC, and NAD, averaged
over the number of steps in the sequence. The precedence impact is calculated by determining Sexp (Eq. 15), whether the
component being assembled is visible, Svis, and the sum of Sdync
(Eq. 16) (negating component complexities of the liaison in the step being assessed). The vision metric is calculated by finding the difference of the dimensions of the components being assembled, direct vision = 0, partial vision=0.2 and restricted vision = 0.5, based on component geometry. Note that when two liaisons are achieved in a single assembly step, then the mean LC is used for that step.
𝑆𝑒𝑥𝑝,𝑚= ∑ 𝑒
[(∑𝑁𝑠𝑡𝑒𝑝𝑠𝑛=1 𝑛𝑒𝑥𝑝,𝑛)(𝐶𝑒,𝑖)] 𝑁𝑐𝑜𝑚𝑝
𝑖=1 (15)
𝑆𝑑𝑦𝑛𝑐,𝑚= 𝑒2[∑𝑁𝑠𝑡𝑒𝑝𝑠𝑖=1 [∑ 𝐶𝐶,𝑖−(𝐶𝑑𝑦𝑛,𝑖+𝐶𝑠𝑢𝑏𝑠𝑡𝑎𝑡,𝑖)]] (16)
𝑆𝐶,𝑚= ∑ 𝐿𝐶,𝑚+ 𝑒∑ 𝑁𝑇𝐶,𝑚𝑛,𝑚 + 𝑒∑ 𝑁𝐴𝐷,𝑚𝑛,𝑚 + 𝑆𝑒𝑥𝑝,𝑚+ 𝑆𝑑𝑦𝑛𝑐,𝑚+ ∑ 𝑆𝑣𝑖𝑠,𝑚 (17)
4.Case study and Results
The case study for this research is a single fuel cell, an exploded view of the product and an undirected graph showing is presented in Fig. 4. A table of the component and liaison complexities are presented in Table 1 and Table 2, respectively. The sequences assessed to validate this model and the resulting sequence complexity values are described in Table 3 and Table 4, respectively. Sequence 1 is the approach that the authors’ believe would be taken for an assembly planner with zero product knowledge. Sequence 2, 3 and 4 have been designed with suboptimal approaches in mind, to check whether the intuitively suboptimal approach is reflected in the complexity model i.e. excessive parallelism causing prolonged exposure of sensitive components (Seq. 3). Sequence 5 and 6 are the two common industrial approaches for fuel cell assembly used today. This knowledge is based on a combination of author expertise, review of literature and discussions with fuel cell manufacturers. The hypothesis is that suboptimal sequences will have a higher complexity value than the optimal ones. If this is found to be untrue, then the model would need modification.
Fig. 4. a) Exploded view of fuel cell b) undirected graph of fuel cell assembly Table 1 Component complexity
i Cf Cb Cd COC CA Ce Crc Cc 1 0.000 0.167 0.286 0.000 0.095 0.000 0.310 0.114
2 0.628 0.000 0.286 0.500 0.262 0.333 0.100 0.265
3 0.706 1.000 0.286 1.000 0.429 0.000 0.170 0.461
4 1.000 0.000 0.143 1.000 0.381 1.000 1.000 0.676
5 0.706 1.000 0.286 1.000 0.429 0.000 0.170 0.461
6 0.628 0.000 0.286 0.500 0.262 0.333 0.100 0.265
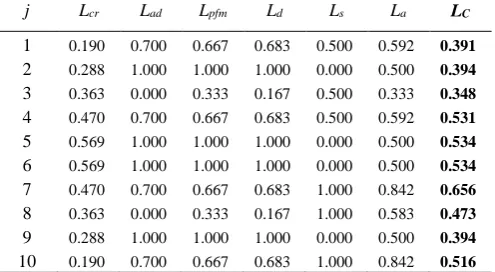
[image:6.595.319.557.67.197.2]7 0.000 0.167 0.286 0.000 0.095 0.000 0.310 0.114 Table 2 Liaison complexity
j Lcr Lad Lpfm Ld Ls La LC
1 0.190 0.700 0.667 0.683 0.500 0.592 0.391
2 0.288 1.000 1.000 1.000 0.000 0.500 0.394
3 0.363 0.000 0.333 0.167 0.500 0.333 0.348
4 0.470 0.700 0.667 0.683 0.500 0.592 0.531
5 0.569 1.000 1.000 1.000 0.000 0.500 0.534
6 0.569 1.000 1.000 1.000 0.000 0.500 0.534
7 0.470 0.700 0.667 0.683 1.000 0.842 0.656
8 0.363 0.000 0.333 0.167 1.000 0.583 0.473
9 0.288 1.000 1.000 1.000 0.000 0.500 0.394
[image:6.595.312.560.240.345.2]10 0.190 0.700 0.667 0.683 1.000 0.842 0.516 Table 3 Evaluated assembly sequences
m Sequence name Steps
1 Intuitive approach -L10, -L9, -L6,7, -L5, -L4, -L1,2
2 Assumed sub-optimal - 1 -L1, -L9, L10, L2, -L6,7, L4,5
3 Assumed sub-optimal - 2 L3, L8, L9,10, -L1,2, L4,5, -L6,7
4 Assumed sub-optimal - 3 L2, L1, L4,5, -L9, -L10, L6,7
5 Industrial approach – 1 -L5, -L6, L7, L4, L9,10, -L1,2
6 Industrial approach – 2 L1, -L10, -L5, -L6, -L2,4 , L7,9
Table 4. Sequence complexity m ΣLc 𝑒
∑ 𝑁𝑇𝐶
𝑛 𝑒∑ 𝑁𝐴𝐷𝑛 Sexp Sdync Svis SC
1 2.892 2.301 1.000 7.396 1.000 2.5 16.089
2 2.822 2.301 1.649 9.114 8.481 2 26.366
3 2.796 1.948 1.649 10.437 6.746 2 25.575
4 2.822 2.301 1.396 15.107 1.257 1 23.883
5 3.103 1.396 1.649 7.948 3.867 1 18.961
[image:6.595.313.561.372.508.2]6 Ahmad et al./ Procedia CIRP 00 (2016) 000–000 5.Discussion
The assembly sequence with the lowest complexity value was that obtained by the intuitive approach. This demonstrates that the sequence deemed to be the least complex by an assembly planner is, as suggested by the model, truly the least complex. However, in the introduction to this paper, the author’s highlighted that the intuitive approach may not necessarily be the optimum. This research therefore requires further case studies to test the model and find whether the intuitive approach continues to be the least complex. For more complex assemblies there typically does not exist an easy to identify approach (although natural precedence is more likely to exist), thus future case studies would likely focus on simple assemblies. Sequences 2, 3 and 4 were designed to be sub-optimal to test the model based on truly complex approaches. In each case the sub-optimal approaches resulted in SCvalues
greater than either the intuitive or the industrial approaches. This is largely attributed to Sexpand Sdync, with these factors
contributing an average of 46% and 21% towards the final complexity value of these sequences, respectively. Furthermore, Sexp is 31% greater than the average Sexp for the
optimal assembly sequences and 56% greater for the intuitive sequence. Sexp is essentially an indication of components that
are in state of work in progress (WIP), with penalties being applied for components that are sensitive to this condition. Thus, reducing states of WIP reduces sequence complexity, aligning with principles developed in production management. In this case study, the average impact and standard deviation of tool changes and assembly direction changes on the sequence complexity are only 9%±2% and 7%±1%, respectively. As these factors are used most commonly to determine the optimal sequence in the literature, future iterations of this model may require a stronger penalty factor to ensure this factor is better considered. The contribution of ΣLc, is limited as it similar for
all sequences. It is hypothesized that this factor would prove more useful if different designs were to be compared, where component relationships would be achieved using different types of liaison. However, the liaison and component complexity information does contribute significantly via the
Sexpand Sdync factors.
6.Conclusion
In this research, a hierarchical “bottom up” approach that represents the considerations which can affect the complexity of an assembly sequence, and thus a basis on which to determine the optimal, is defined. Automating the process is outside the scope of this research, however in order to facilitate concurrency between product designers and process planners it is necessary to develop this in the future. Many of the criteria could automatically be extracted from a PLM tools such as CAD. The aim of this research was to consider additional factors, not traditionally included in the existing literature to solve the ASP problem. Although not all of the factors contributed significantly to the sequence complexity value, it is hypothesized that extension of the research can help realize their impact, especially when considering alternative designs. In this way, the impact of design changes on assembly
sequence can be quickly evaluated, even if the change is as nuanced as a change in material properties or geometry. This can reduce the time to product realization, reducing costs and increasing the efficiency of the business. One of the main shortcomings of this work is the tedious data entry which consumes a significant amount of time and due its manual nature can result in errors, thus providing an additional incentive for automating the process.
References
[1] Y. Koren and M. Shpitalni, "Design of reconfigurable manufacturing systems," Journal of manufacturing systems, vol. 29, pp. 130-141, 2010. [2] Q. Su, "A hierarchical approach on assembly sequence planning and
optimal sequences analyzing," Robotics and Computer-Integrated Manufacturing, vol. 25, pp. 224-234, 2009.
[3] M. F. F. Rashid, W. Hutabarat, and A. Tiwari, "A review on assembly sequence planning and assembly line balancing optimisation using soft computing approaches," The International Journal of Advanced Manufacturing Technology, vol. 59, pp. 335-349, 2012.
[4] A. C. Sanderson, L. S. H. de Mello, and H. Zhang, "Assembly sequence planning," AI Magazine, vol. 11, p. 62, 1990.
[5] Y.-K. Choi, D. Lee, and Y. Cho, "An approach to multi-criteria assembly sequence planning using genetic algorithms," The International Journal of Advanced Manufacturing Technology, vol. 42, pp. 180-188, 2009/05/01 2009.
[6] R. M. Marian, "Optimisation of assembly sequences using genetic algorithms," 2003.
[7] G. Boothroyd, P. Dewhurst, and W. A. Knight, Product design for manufacture and assembly: CRC Press, 2010.
[8] V. Chan and F. A. Salustri, "DFA: The Lucas Method," Ryerson University, 2005.
[9] G. Boothroyd and L. Alting, "Design for assembly and disassembly," CIRP Annals-Manufacturing Technology, vol. 41, pp. 625-636, 1992.
[10] W.-C. Chen, Y.-Y. Hsu, L.-F. Hsieh, and P.-H. Tai, "A systematic optimization approach for assembly sequence planning using Taguchi method, DOE, and BPNN," Expert Systems with Applications, vol. 37, pp. 716-726, 1// 2010.
[11] F. Demoly, X.-T. Yan, B. Eynard, L. Rivest, and S. Gomes, "An assembly oriented design framework for product structure engineering and assembly sequence planning," Robotics and Computer-Integrated Manufacturing, vol. 27, pp. 33-46, 2// 2011.
[12] X. Li Da, W. Chengen, B. Zhuming, and Y. Jiapeng, "AutoAssem: An Automated Assembly Planning System for Complex Products," Industrial Informatics, IEEE Transactions on, vol. 8, pp. 669-678, 2012.
[13] A. L. Bourjault, A;, "Modelling an assembly process," presented at the Int Conf Autom Manuf Ind, 1986.
[14] T. L. De Fazio and D. E. Whitney, "Simplified generation of all mechanical assembly sequences," Robotics and Automation, IEEE Journal of, vol. 3, pp. 640-658, 1987.
[15] L. S. Homem de Mello and A. C. Sanderson, "A correct and complete algorithm for the generation of mechanical assembly sequences," Robotics and Automation, IEEE Transactions on, vol. 7, pp. 228-240, 1991. [16] J. Xu, B. Liang, J. Wang, X. Xu, and B. Zhang, "An approach to automatic
assembly sequences generation," in Proceedings of 2nd Asian Conference on Robotics and its Application, 1994, pp. 612-615.
[17] T. Dong, R. Tong, L. Zhang, and J. Dong, "A knowledge-based approach to assembly sequence planning," The International Journal of Advanced Manufacturing Technology, vol. 32, pp. 1232-1244, 2007.
[18] T. C. Woo and D. Dutta, "Automatic disassembly and total ordering in three dimensions," Journal of Manufacturing Science and Engineering, vol. 113, pp. 207-213, 1991.
[19] R. H. Wilson and J.-C. Latombe, "Geometric reasoning about mechanical assembly," Artificial Intelligence, vol. 71, pp. 371-396, 1994.
[20] M. Goldwasser, J.-C. Latombe, and R. Motwani, "Complexity measures for assembly sequences," in Robotics and Automation, 1996. Proceedings., 1996 IEEE International Conference on, 1996, pp. 1851-1857.
[21] R. Altindag, "Correlation of specific energy with rock brittleness concepts on rock cutting," Journal of the South African Institute of Mining and Metallurgy, vol. 103, pp. 163-171, 2003.
[22] I. Bar-On, R. Kirchain, and R. Roth, "Technical cost analysis for PEM fuel cells," Journal of Power Sources, vol. 109, pp. 71-75, 2002. [23] S. K. Kamarudin, W. R. W. Daud, A. Md.Som, M. S. Takriff, and A. W.
Mohammad, "Technical design and economic evaluation of a PEM fuel cell system," Journal of Power Sources, vol. 157, pp. 641-649, 2006. [24] A. T. Mathew and C. Rao, "A novel method of using API to generate