University of Warwick institutional repository: http://go.warwick.ac.uk/wrap
A Thesis Submitted for the Degree of PhD at the University of Warwick
http://go.warwick.ac.uk/wrap/64223
This thesis is made available online and is protected by original copyright. Please scroll down to view the document itself.
The effect of visibility in the
integration of lean and agile for
supply chains
By
Xin Wang
A Thesis Submitted in Partial Fulfilment of the requirement for the Degree of Doctor of Philosophy in Engineering
University of Warwick
Warwick Manufacturing Group
Xin Wang Page ii
Table of Contents
Introduction ... 1
1.1 Research motivation ... 2
1.2 Research gap ... 6
1.3 Research question and objectives ... 8
1.4 Thesis structure ... 9
Literature Review ... 11
2.1 Identifying a LeAgile supply chain ... 12
2.1.1 Demand uncertainty and product variety ... 13
2.1.2 Market qualifiers and market winners ... 14
2.2 LeAgility approaches ... 15
2.2.1 The Pareto curve approach ... 15
2.2.2 Separation of “Base” and “Surge” demands ... 16
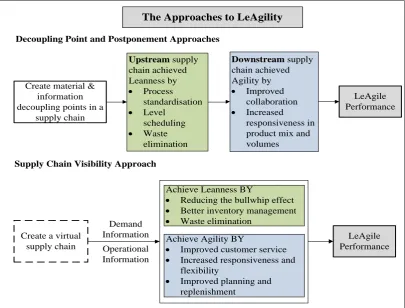
2.2.3 The decoupling point approach... 18
2.2.4 Late customisation (postponement) approach ... 21
2.2.5 The disadvantage of the four approaches ... 22
2.3 Supply chain visibility – A roadmap to LeAgile ... 23
2.3.1 What is supply chain visibility? ... 24
2.3.2 Information sharing, visibility and improved supply chain performance ... 26
2.3.3 The issues related to visibility in supply chains ... 30
2.3.4 Establishing the value of visibility... 31
2.3.5 Technologies for implementing visibility ... 32
2.4 The difference between the visibility approach and the decoupling point approach ... 38
2.5 Summary ... 39
Research Methodology... 40
3.1 Research method ... 41
3.1.1 Three types of simulation in supply chain management... 42
3.1.2 Simulation objective ... 46
Xin Wang Page iii
3.1.4 Simulation Model Design ... 48
3.1.5 Scenario design ... 55
3.1.6 Performance measurement framework ... 57
3.2 Discussion and evaluation ... 62
3.3 Summary ... 62
Simulation Design ... 63
4.1 Supply chain structure of simulation ... 64
4.2 Simulation parameters and variables ... 65
4.2.1 Demand Pattern... 65
4.2.2 The lead time of supply chain ... 65
4.2.3 Capacity ... 66
4.2.4 Forecasting ... 66
4.2.5 Inventory management ... 67
4.2.6 Unexpected events ... 67
4.2.7 Cost Management ... 69
4.3 Information sharing method ... 70
4.3.1 Planned Demand Transferring Method (PDTM) ... 70
4.3.2 Forecasted Demand Distributing Method (FDDM)... 70
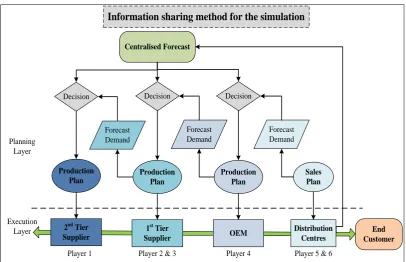
4.3.3 The information sharing method for the simulation ... 72
4.4 The simulation tool ... 73
4.4.1 Data input portal and central database ... 73
4.4.2 Dashboard ... 74
4.5 Three experiments and their scenarios ... 75
4.5.1 Experiment One - Demand Visibility experiment ... 76
4.5.2 Experiment Two - Operational Visibility experiment ... 77
4.5.3 Experiment Three - Decoupling Point & Postponement experiment .. 78
4.6 Performance measurement framework ... 80
4.6.1 Bullwhip effect measurement ... 81
4.6.2 Trust analysis ... 82
4.6.3 Leanness measurement ... 83
4.6.4 Agility measurement ... 84
Xin Wang Page iv
4.7 Summary ... 87
Simulation Results ... 88
5.1 Visibility and bullwhip effect ... 89
5.2 Visibility and leanness ... 97
5.2.1 Reduced inventory ... 98
5.2.2 Reduced overproduction ... 100
5.2.3 Reduced costs ... 101
5.2.4 Reduction in other types of waste ... 103
5.3 Visibility and agility ... 104
5.3.1 Customer satisfaction ... 105
5.3.2 Flexibility ... 107
5.4 Visibility and LeAgility ... 108
5.4.1 Supply chain total value ... 109
5.4.2 Synthesis graph analysis ... 111
5.5 The advantages of the supply chain visibility approach ... 116
5.5.1 Bullwhip effect ... 117
5.5.2 Leanness... 119
5.5.3 Agility ... 121
5.5.4 LeAgility ... 124
5.5 Summary ... 127
Discussion ... 128
6.1 Visibility and supply chain performance ... 130
6.1.1 Information sharing frequency (heartbeat) ... 131
6.1.2 Sharing more information or at a higher frequency ... 132
6.1.3 Summary ... 133
6.2 Visibility and individual performance ... 134
6.3 Visibility and trust ... 136
6.4 Supply chain visibility benefits ... 141
6.5 The impact of implementing visibility in the current business environment ... 145
6.5.1 Economic fluctuation ... 145
Xin Wang Page v
6.6 Comments from the Journal of Operations Management ... 151
6.7 Data reliability ... 152
6.8 Evaluation ... 153
6.8.1 Case One – the visibility module on WMCCM ... 154
6.8.2 Case Two – The EU IMAGINE Project ... 155
6.9 Research limitations ... 158
6.9.1 Visibility and supply chain type ... 158
6.9.2 The impact of profit visibility ... 159
6.9.3 Other technologies ... 160
Conclusions and Future Work ... 161
7.1 Conclusions ... 162
7.2 Future work ... 164
References ... 165
Bibliography ... 178
Appendix 1 ... 182
Appendix 2 ... 184
Appendix 3 ... 186
Appendix 4 ... 188
Appendix 5 ... 190
1. Demand Visibility experiment ... 190
1.1 Scenario configuration ... 190
1.2 The results from the Demand Visibility experiment ... 191
2. Operational Visibility experiment ... 195
2.1 Scenario configuration ... 195
2.2 The results from the Operational Visibility experiment ... 195
3. Discussion ... 197
Xin Wang Page vi
List of Figures
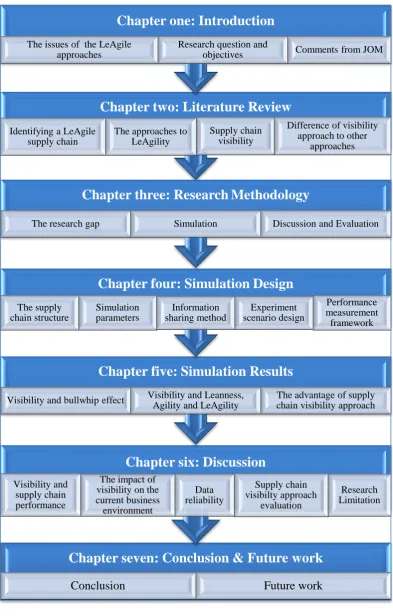
Figure 1.1: Thesis structure ... 10
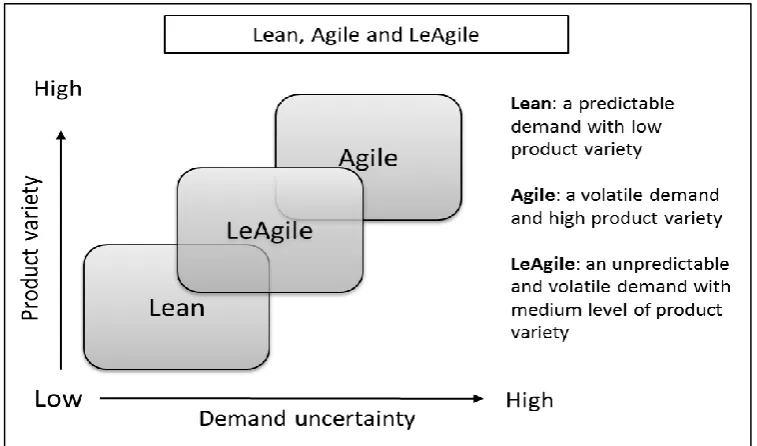
Figure 2.1: Lean, Agile or LeAgile ... 13
Figure 2.7: The difference between the supply chain visibility approach and the decoupling point approach ... 39
Figure 3.1: The simulation design flowchart ... 47
Figure 3.2: Supply chain selection ... 51
Figure 4.3: The information sharing method for the simulation ... 72
Figure 4.4: The data flow of the simulation ... 74
Figure 4.5: A dashboard example ... 75
Figure 4.6: the modified supply chain structure in Experiment Three ... 79
Figure 4.7: An example of synthesis graph analyse for the simulation ... 86
Figure 5.1: Causes of bullwhip effect ... 91
Figure 5.2: The average demand amplification ratio for Demand Visibility and Operational Visibility experiments ... 92
Figure 5.3: the forecast accuracy for Demand Visibility experiment ... 93
Figure 5.4: Centralized forecast and participants’ forecast for Demand Visibility experiment ... 96
Figure 5.5: Overproduction in the supply chain for the Operational Visibility Experiment ... 101
Figure 5.6: The total costs for the Demand Visibility and Operational Visibility experiments ... 102
Figure 5.7: Customer service levels for the Demand Visibility and Operational Visibility experiments ... 106
Figure 5.8: the supply chain total value for the Demand Visibility and Operational Visibility experiments ... 110
Figure 5.9: The result for the Demand Visibility experiment ... 112
Figure 5.10: the result for the Operational Visibility experiment ... 114
Xin Wang Page viii
List of Tables
Table 2.1: the market qualifiers and market winners of lean, agile and LeAgile
supply chain ... 14
Table 2.2: The advantages and disadvantages of the four approaches ... 23
Table 2.3: Shared information for improving visibility ... 29
Table 3.1: the comparison of the three research methods in this research ... 42
Table 3.3: Performance frameworks and their measures in literature ... 58
Table 3.5: The performance measurement framework ... 61
Table 4.1: Five types of cost in the simulation ... 69
Table 4.2: Scenarios for Experiment One - Demand visibility experiment ... 77
Table 4.3: Scenarios for Experiment Two - Operational Visibility experiment .. 78
Table 4.4: scenarios for Experiment Three - Decoupling Point & Postponement experiment ... 80
Table 5.1: The total inventory for the Demand Visibility and Operational Visibility experiments ... 98
Table 5.2: The backorders and number of disruption for the Demand Visibility and Operational Visibility experiments ... 107
Table 5.3: Supply chain visibility and LeAgility ... 115
Table 5.4: scenarios of Experiment Three - Decoupling Point & Visibility Experiment ... 116
Table 5.5: Total inventory for decoupling point & visibility experiment ... 121
Table 5.6: The backorders and numbers of disruption occurrences for Decoupling Point & Postponement Experiment ... 123
Table 5.7: the advantages of decoupling point, postponement and visibility approaches ... 126
Table 6.1: Total value of each participant in Operational Visibility Experiment ... 136
Xin Wang Page ix
Acknowledgement
I would like to present my thankfulness to all those who helped me. This work
could not have been completed without their support.
1. I would like to express gratitude to Dr. Jay Bal, my supervisor, for his
guidance, support and friendship.
2. I also would like to thank for the staff of Warwick Manufacturing Group
who provided the opportunity and support for this research.
3. I really appreciate the participation and contribution of the following MSc
students of Warwick manufacturing Group: Feng Luo, Markos Serifios,
Perizat Zholdybekova, Yue Yu, Ziyue Feng, Ajibola Akano, Asad Raza,
Jiang Tao, Jonathan Sing, and Zhuowei Deng.
4. I would like convey my sincere thanks to my parents Feng Wang and
Ruiqin Wang and my sister Yiqian Wang for their endless support and
encouragement during this research.
5. And I would like to say ‘thank you’ to my friends, Xiao Ma, Yang Yu,
Honghong Dai, Santhosh Vijaykumar, Mohammad Nabavieh, Ahmad
Issa and other staff of Warwick Manufacturing Group for their interest,
support and valuable advice.
6. Especially, I would like give my special thanks my wife, Jie Chu whose
Xin Wang Page x
Declaration
I, Xin Wang, hereby declare that the work presented in this thesis is my original
research. Other sources of information used in this research have been
acknowledged. The efforts of the participants in the research have been indicated
clearly.
Xin Wang Page xi
Abstract
Over the last two decades, supply chain researchers have sought to find appropriate ways of achieving lean and agile “LeAgile” supply chains. However, the differences in the priorities of the lean and agile paradigms multiply the challenges in lean and agile combinations. The most discussed approaches in the literature are the decoupling point and the late customisation (postponement) strategies. Supply chain visibility as a solution is less frequently discussed though the ‘Smarter Supply Chain of the Future’ report states that ‘70% of supply chain leaders view Supply Chain Visibility as their number one challenge... the need to ‘see’ and act on the right information’ (IBM, 2010). Technologies such as EDI and RFID have been implemented to improve visibility, have not gained general acceptance. Newer, low cost ‘Cloud’ solutions may be able to address the need better.
Previous research has suggested that increasing information visibility improves supply chain performance, though the relationship between the degree of visibility and resulting performance does not appear to have been addressed. Therefore, a role playing simulation methodology was devised to evaluate the effect of supply chain visibility on improved LeAgile supply chain performance. Role playing simulations better emulate the human control actions in supply chains, but can also suffer/benefit from traits such as learning.
A low cost Web and Cloud based system was devised to enable visibility and communication in the simulation. Different information sharing configurations (visibility levels) were evaluated for a typical four-echelon supply chain. The results show a correlation in improved supply chain LeAgility with the degree of visibility of demand and/or operational information, but this was not a linear relationship. A degree of ‘digital’ waste eroded performance with increasing levels of visibility.
Xin Wang Page xii
List of Abbreviations
BI Business Intelligence
CF Centralised Forecast
CPFR Collaborative Planning, Forecasting and Replenishment
DC Distribution Centre
DCF Direct Customers’ Forecast
DMN Dynamic Manufacturing Network
DP Decoupling Point
EDI Electronic Data Interchange
EIS Executive Information System
ERP Enterprise Resource Planning
EU Europe
FAT Final Assembly and Test
FDDM Forecasted Demand Distributing Method
FDI Foreign Direct Investment
FG Finished Goods
FGI Finished Goods Inventory
HA Humanitarian Aid
HP Hewlett-Packard
ICT Information and Communications Technology
IMAGINE Innovation end-to-end Management of Dynamic
Xin Wang Page xiii
IT Information Technology
KPI Key Performance Indicator
MES Manufacturing Execution Systems
MIT Massachusetts Institute of Technology
MRP Materials Requirement Planning
MSc Master of Science
PDTM Planned Demand Transferring Method
RD Real Demand
RFID Radio Frequency Identification
RM Raw Material
SCOR Supply Chain Operations Reference
SCV Supply Chain Visibility
SME Small and Medium Enterprises
SOA Service Oriented Architecture
US United States
VMI Vendor-Managed Inventory
WMCCM West Midlands Collaborative Commerce Marketplace
WS Web Services
Xin Wang Page xiv
Accompanying Materials
Chapter 1 Introduction
Xin Wang Page 1
1
Chapter 1 Introduction
Xin Wang Page 2
1.1 Research motivation
In the course of global economic fluctuation, companies are facing an
increasingly complex business environment. The increased complexity in supply
chains has caused longer lead times and lead-time variability, more pipeline
inventory, and the increasing need of logistics control (Heaney, 2011). This has
significantly increased supply chain management costs in the current highly
uncertain environment. Increasingly demanding customer requirements
exacerbate this situation. Customers are looking for complete solutions at lower
prices, but with higher quality and faster lead times, and they have the internet
and IT systems to help them find alternative suppliers if necessary. Companies
increasingly need to be ‘LeAgile’ in order to reduce costs whilst responding
swiftly to the rapid changes in both demand and supply.
Scholars have sought to find appropriate ways of achieving a LeAgile supply
chain. Christopher and Towill (2000) summarised four practical approaches for
creating a LeAgile supply chain: the Pareto curve approach, separation of ‘Base’
and ‘Surge’ demands approach, the decoupling point approach and the late
customisation (postponement) approach. And the decoupling point approach and
the late customisation approach are the most discussed approaches in literature.
The decoupling point approach can be defined as the boundary between lean
operation and agile operation in a supply chain, where lean principles can be
adopted upstream from the boundary and agility is applied downstream from the
Chapter 1 Introduction
Xin Wang Page 3 identify its appropriate position in supply chain networks (Mason-Jones and
Towill, 1999; Olhager et al., 2006; Stevenson and Spring, 2007; Rahimnia and Moghadasian, 2010). For example, the material decoupling point should be
placed as close to the market as possible (Mason-Jones and Towill, 1999), and
the information decoupling point should be held as far upstream as possible in
the supply chain, in order to enable as many members as possible to access
demand data (Stevenson and Spring, 2007). The positioning of the decoupling
point can be viewed as identifying a balance between competitive advantages,
and cost and complexity. There are many factors which could influence the
positioning of the decoupling point in a supply chain network. Such factors
include the market, production lead time, demand variance and delivery time
(Olhager, 2003).
Results of many researchers, such as Olhager et al. (2006), Fan et al. (2007), and Sun et al. (2008) have suggested that the decoupling point approach is capable of satisfying customer needs in the current volatile business environment, in both
conceptual and real supply chains. Rahimnia and Moghadasian (2010) extended
the decoupling point strategy to professional services, such as hospitals, and
showed that more patients were given care due to the reduced lead times and
costs, after the decoupling points in healthcare supply chains were identified.
However, one common issue revealed by their research is the great difficulty of
deriving the correct and suitable strategic inventory at the decoupling points to
balance the operational stability and the market requirement in both theory and
Chapter 1 Introduction
Xin Wang Page 4 The late customisation (postponement) strategy, which is related to the
decoupling point strategy, is recognised as an effective agile strategy which has
been widely adopted (e.g. Dell). Having a postponed configuration allows a “mass customisation” strategy, and presents numerous advantages. Christopher
and Towill (2000) summarised the benefits of implementing a postponement
strategy as lower inventory, improved flexibility and higher forecasting accuracy.
Chen and Lee (2009) suggested that sharing information together with an order
postponement strategy reduces the bullwhip effect. Additionally, Graman and
Sanders (2009) showed that a late customisation strategy is more appropriate
than accurate forecasting in achieving agility in terms of inventory reduction
whilst maintaining a level of customer service; however, their results also shown
significant costs of increasing capacity at the postponement stage. Therefore, it is
suggested that a LeAgile supply chain is only achieved through late
customisation strategy when the supply chain focuses on the lean principle to
eliminate waste (Fan et al., 2007; Graman and Sanders, 2009; Sehgal, 2010).
Previous research has demonstrated the impact of these approaches for achieving
supply chain LeAgility (Olhager, 2006; Sun et al, 2008; Chen and Lee, 2009;
Graman and Sanders, 2009; Rahimnia and Moghadasian, 2010). However, it has
not examined how to design those approaches in practice, since the application
may vary from situation to situation according to the extent to which leanness or
agility is desired. This research discusses disadvantages of the LeAgility
approaches in literature in the context of the current business environment, and
suggests that their limitations have obstructed their business applications. In life,
Chapter 1 Introduction
Xin Wang Page 5 and increasingly technology is deployed to provide increased visibility. For
example the internet can tell us where we can find a product cheaper, or quicker
or more locally. In this research the author explores supply chain visibility
enabled by the internet as an approach to addressing the needs for LeAgility.
LeAgility through supply chain visibility is achieved by creating an information
driven supply chain. Supply chain partners in this virtual supply chain can access
shared demand and operational information, and make their operational decisions
after ‘seeing’ what is happening. An analogy to explain supply chain visibility:
Imagine you are in a room full of objects, and that your mission is to find a path
to the exit as quickly as possible. However, the room is dark because the light is
turned off. Logically, the first move in this situation is to turn the light on and
then find a possible way to clear a path to the exit, once you are able to see
everything. This is the so-called supply chain visibility.
The definition of supply chain visibility is ill-defined and in the literature,
however majority of the research defines supply chain visibility from the
perspective of information sharing (Barratt and Oke, 2007; Francis, 2008;
Holcomb et al, 2010; Goh et al, 2009). Achieving visibility requires sharing
information related to all aspects of supply chain activities with supply chain
partners (Holcomb et al., 2010). Supply chain members are able to ‘see’ and act according to the current status of the supply chain through sharing critical
information in real time. This research defines supply chain visibility an IT
Chapter 1 Introduction
Xin Wang Page 6 key characteristics of visibility to tackle the core issues of uncertainty and
improving LeAgility in a supply chain (Chapter 2.3.1)
1.2 Research gap
This research reviews the four approaches (the Pareto curve approach, separation
of ‘base’ and ‘demand’ approach, the decoupling point approach and the late
customisation approach) in literature for creating LeAgile supply chains (Chapter
2.2). However, the method with which to implement those methods was not
clearly defined, since they may vary from situation to situation according to the
extent to which leanness or agility is desired. The author discusses their
disadvantages in the context of the current business environment and addresses
the gap by exploring supply chain visibility as an approach.
Previous research has suggested that increasing information visibility improves
supply chain performance by using different methodologies. Simulation and
modelling are the most used methods in the literature to measure visibility and its
impact on supply chain performance (Chen et al, 2000; Lee et al 2000; Yu et
al,2001; Gavirneni, 2002; Croson and Donohue, 2003; Disney and towill,2003;
Ryu et al,2009; Sahin and Robinson, 2005). The results of these authors
demonstrated the contributions to qualify the effect of increased visibility on
improving supply chain performance; Other researchers focused on empirical
studies, most of them are relied on surveys and case studies (Frohlich and
Westbrook, 2002; Zhao et al., 2002; Kim et al., 2006; Kim, 2009; Zhou and
Chapter 1 Introduction
Xin Wang Page 7 Oke, 2007; Bartlett et al., 2007; Bailey and Francis, 2008; Holcomb et al, 2010).
For example, Barratt and Oke (2007) suggested that achieving high level of
visibility on demand, process and inventory levels could bring competitive
advantage to supply chains by analysed five case studies; Holcomb et al. (2010) identified the competitive advantage granted by improving visibility as reduced
operation costs and increased customer service level by analysed the 278 surveys
from North American and European firms. However, most authors focused
mainly on simplified supply chains (i.e. two-tier supply chain) and failed to
provide a quantification of the benefits of increased visibility in complex supply
chains or networks. In fact, real supply chains are more complex and a
comprehensive measure of the effect of visibility to complex supply chains or
networks is lacking (Caridi et al, 2010).
More importantly, the majority research attempted to explore the relation
between the increased visibility and improved supply chain performance in many
dimensions based on the definitions of visibility (e.g. information sharing,
information accuracy, quality of exchange information, timeliness) (Simatupang
and Sridharan, 2005; Kaipia and Hartiala, 2006; Barratt and Oke, 2007; Zhou
and Benton, 2007; Caridi et al, 2010). There are two key elements of achieving
supply chain visibility: shared information content and information sharing
frequency. The majority of the research focused on the impact of the shared
information on the supply chain performance. However, the information sharing
frequency and its impact on supply chain performance, especially supply chain
LeAgilty, has been little explored. Thus the focus of this research is to explore
Chapter 1 Introduction
Xin Wang Page 8 resulting improvement supply chain LeAgility for a complex supply chain (a
four-tier supply chain).
1.3 Research question and objectives
Logic suggests that improved visibility will lead to “better” supply chain
performance. Is this “better” performance LeAgile in nature? The following
research question was phrased to address this:
To what extent can a LeAgile supply chain be achieved through improved supply chain visibility?
This question can be broken down into a number of resulting subquestions that
have been addressed in this research. These are:
1. To what extend can the supply chain LeAgility be improved after sharing
the customer demand related information?
2. To what extend can the supply chain LeAgility be improved after sharing
the operational related information?
3. What are the advantages of supply chain visibility approach for creating a
LeAgility supply chain versus the decoupling point and postponement
Chapter 1 Introduction
Xin Wang Page 9
1.4 Thesis structure
The research gap was identified in chapter two by reviewing the four approaches
in the literature for creating LeAgile supply chains. Supply chain visibility was
then proposed as a solution to address this gap. A role playing simulation
methodology was adopted to evaluate the effect of supply chain visibility on
improved LeAgile supply chain performance (chapter three). The detailed
simulation design and different information sharing configurations (visibility
levels) for a typical supply chain were presented in chapter four. The results from
the simulations were analysed in chapter five in order to access the extent of
supply chain LeAgility with increased visibility, and explore the advantages of
visibility over the decoupling point and postponement approaches. Chapter six
discussed the correlation between visibility and supply chain LeAgility, and
evaluated its business implications. The conclusion and future work were
Chapter 1 Introduction
[image:25.595.119.513.83.700.2]Xin Wang Page 10 Figure 1.1: Thesis structure
Chapter seven: Conclusion & Future work
Conclusion Future work
Chapter six: Discussion
Visibility and supply chain performance
The impact of visibility on the current business environment Data reliability Supply chain visibilty approach evaluation Research Limitation
Chapter five: Simulation Results
Visibility and bullwhip effect Visibility and Leanness, Agility and LeAgility
The advantage of supply chain visibility approach
Chapter four: Simulation Design
The supply chain structure Simulation parameters Information sharing method Experiment scenario design Performance measurement framework
Chapter two: Literature Review
Identifying a LeAgile supply chain
The approaches to LeAgility
Supply chain visibility
Difference of visibility approach to other
approaches
Chapter three: Research
Methodology
The research gap Simulation Discussion and Evaluation
Chapter one: Introduction
The issues of the LeAgile approaches
Research question and
Chapter 2 Literature Review
Xin Wang Page 11
2
Literature Review
The four approaches, known as the Pareto curve approach, separation of ‘Base’
and ‘Surge’ demands approach, the decoupling point approach, and the late
customisation (or postponement) approach, suggested in the literature for
creating LeAgile supply chain were reviewed. However, they are no longer
effective in the current highly uncertain business environment. Supply chain
visibility was proposed as an attempt to address this gap. The definition of supply
chain visibility and its issues were then discussed to establish its values. The
information sharing structures and current technologies for enabling visibility
Chapter 2 Literature Review
Xin Wang Page 12
2.1 Identifying a LeAgile supply chain
The concept of LeAgile has been developed, in both manufacturing and services
contexts, by many researchers (Vorst et al., 2001; Aitken et al., 2005; Mistry, 2005; Sanderson and Cox, 2008; Rahimnia and Moghadasian, 2010). A LeAgile
supply chain is generally agreed by many researchers to be an agile supply chain
which adopts many lean principles in supply chain management (Narasimhan et al., 2006; Scholten et al., 2010). A LeAgile supply chain should have both lean and agile characteristics. It attempts to combine low cost from lean principles
with the flexibility provided by agile ones.
According to Agarwal et al. (2006), LeAgility is the improvement in supply chain performance related to the ability of supply chains to quickly respond to
volatile market changes whilst keeping costs low. It focuses on solving the
problem of how to quickly respond to customer needs with the lowest cost in an
unpredictable market.
Out of the lean, agile and LeAgile strategies, there is not one that is better or
worse than the others. They each address different market opportunities based on
their individual characteristics. The following sections review their
Chapter 2 Literature Review
Xin Wang Page 13
2.1.1 Demand uncertainty and product variety
The lean paradigm is generally considered as the ideal solution for supply chains
which have the predictable demand with low product variety, such as Coca Cola
(Naylor et al., 1999; Christopher and Towill, 2000; Mason-Jones et al., 2000a; Mason-Jones et al., 2000b). On the opposite, the agile paradigm is considered the best to be used for a less predictable demand with high product variety, such as
fashion clothes (Naylor et al., 1999). Figure 2.1 shows the lean, agile and LeAgile strategies in the matrix of demand uncertainty vs. product variety. The
vertical axis shows the production variety from low to high; the horizontal axis
shows the demand uncertainty. Figure 2.1 illustrates that a LeAgile supply chain
has the advantage of dealing with a volatile customer demand with a medium
level of product variety. The LeAgile strategy balances the lean and agile
[image:28.595.120.499.511.734.2]paradigm to meet unpredictable demands whilst reducing cost (Bruce et al., 2004).
Chapter 2 Literature Review
Xin Wang Page 14
2.1.2 Market qualifiers and market winners
Lean and agile supply chains have also been compared from the point of view of
market qualifiers and market winners (Mason-Jones et al., 2000a). They were found to share the mutual qualifiers of quality and lead time. However, the lean
supply chain focused on reducing the cost, whilst the agile supply chain pursued
customer service satisfaction (availability) as the market winner. In the case of
LeAgile supply chains, they win the market by focusing to obtain both paradigms
in a balanced relationship within one supply chain (Christopher and Towill,
2001). Table 2.1 illustrates the market qualifiers and market winners of lean,
agile and LeAgile paradigms. The LeAgile supply chain seeks to satisfy the most
customers, with the lowest cost, as its market winner.
Table 2.1: the market qualifiers and market winners of lean, agile and LeAgile supply chain
Lean Agile LeAgile
Market winners Cost Service level Cost and Service level
Market qualifiers
Quality, Lead time, Service level
Quality, Lead time and Cost
Quality and Lead time
Achieving LeAgility means achieving the best of both lean and agile strategies.
Figure 2.1 and Table 2.1 highlight that the lean and agile paradigms have
different priorities to meet with different opportunities. Therefore, the challenges
in the lean and agile combination are multiplied. Over the last two decades,
Chapter 2 Literature Review
Xin Wang Page 15 a LeAgile supply chain. The following section discusses the four main
approaches discussed in the literature for implementing supply chain LeAgility in
the context of the current business environment.
2.2 LeAgility approaches
Four practical approaches were summarised by Christopher and Towill (2001)
for combining lean and agile paradigms in one supply chain. They are known as
the Pareto curve approach, separation of ‘Base’ and ‘Surge’ demands approach,
the decoupling point approach, and the late customisation (or postponement)
approach.
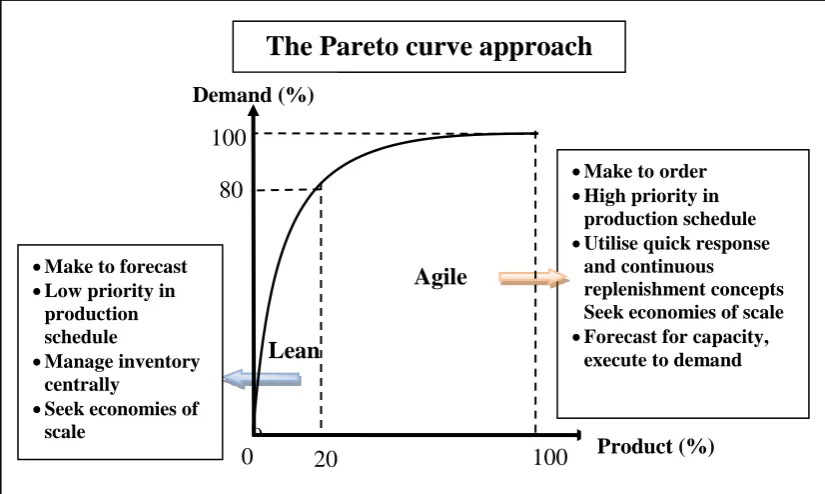
2.2.1 The Pareto curve approach
Organisations who manufacture or distribute a large range of products may find
that the Pareto Law (80/20 or similar) can be applied to develop supply strategies
(Christopher and Towill, 2001). The 80/20 rule can be applied on the basis of
business analysis: 80% of overall volume will be generated from 20% of the total
product line (Koch, 1998). The management strategies for the 20% and the
remaining 80% should be very different. For instance, in some cases, 20% of the
production volume is likely to be predictable and the lean paradigm may be
exploited; on the other hand, the remaining 80% may be less predictable and the
agile paradigm can be applied. Figure 2.2 illustrates a generic method by which
the LeAgile strategy may be achieved by applying leanness for the 20% of
Chapter 2 Literature Review
[image:31.595.113.526.85.332.2]Xin Wang Page 16 0
Figure 2.2: The Pareto Curve Approach to LeAgile (Source: Christopher and Towill, 2001)
In reality, the Pareto Law is very difficult to implement in supply chain
management. It requires well defined market conditions and operational
environments such as high levels of product variety and proportionate levels of
demand in the product range. Furthermore, applying lean and agile strategies at
the same time increases the complexity of operational management, which may
cause the abuse of resources (Christopher and Towill, 2001).
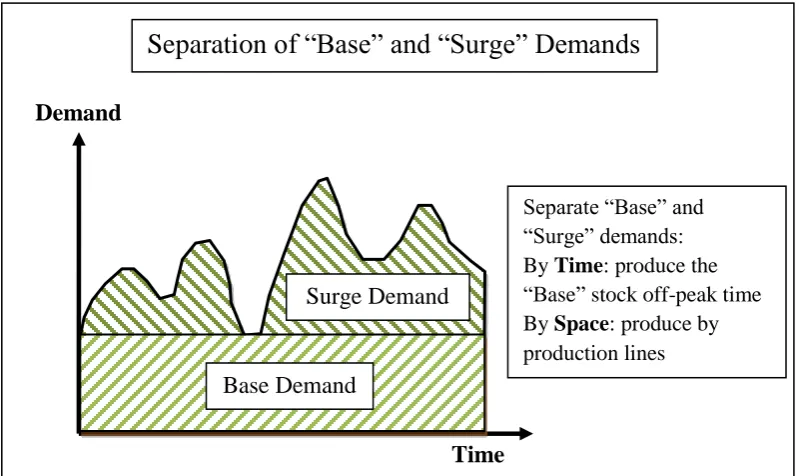
2.2.2 Separation of “Base” and “Surge” demands
Another approach to combining lean and agile is known as the separation of
“Base” and “Surge” demands. It also achieves supply chain LeAgility from the
demand patterns by separating demand into “Base” and “Surge” elements. This
The Pareto curve approach
0 20 100
100
80
Lean
Make to order
High priority in
production schedule
Utilise quick response
and continuous
replenishment concepts Seek economies of scale
Forecast for capacity,
execute to demand
Demand (%)
Make to forecast
Low priority in
production schedule
Manage inventory
centrally
Seek economies of
scale
Agile
Chapter 2 Literature Review
Xin Wang Page 17 strategy has been proven to be a successful approach for implementing a LeAgile
strategy, particularly for the fashion industry (Goldsby et al., 2006). Figure 2.3 shows a possible approach to separating the demand into “Base” and “Surge”
(Christopher and Towill, 2001). The “Base” demand can often be predicated by
using the demand history, whereas the “Surge” demand normally cannot. In this
way, the smooth base demand is ideal for applying a lean paradigm, and the
flexible agile paradigm can be used for the surge demand fluctuation. Some
fashion companies like Zara won the supply chain advantages by focussing on
reducing the cost of “Base” demand. More importantly, supply chain executives
can deal with both “base” and “surge” demands either by separation in time
(produce the “Base” stock in off-peak time) or in space (produce by production
lines). However, the significant cost reduction in outsourcing and increasing
visibility in transportations overcame these benefits (Christopher and Towill,
Chapter 2 Literature Review
[image:33.595.114.514.85.323.2]Xin Wang Page 18 Figure 2.3: Separation of “Base” and “Surge” Demands (Source: Christopher and
Towill, 2001)
2.2.3 The decoupling point approach
The most discussed LeAgile methodology in the literature is known as the
decoupling point approach. The decoupling point is generally described as the
point at which strategic inventory is held to deal with downstream demand
variation; between order fluctuation and/or product variety and smooth product
output (Mason-Jones and Towill, 1999; Christopher and Towill, 2000). The
decoupling point acts as a strategic buffer, upstream from which point lean
principles can be applied, and downstream from which agility is optimised
(Mason-Jones and Towill, 1999; Rahimnia and Moghadasian, 2010). This is also
sometimes known as the material decoupling point.
Demand
Time
Base Demand
Surge Demand
Separation of “Base” and “Surge” Demands
Chapter 2 Literature Review
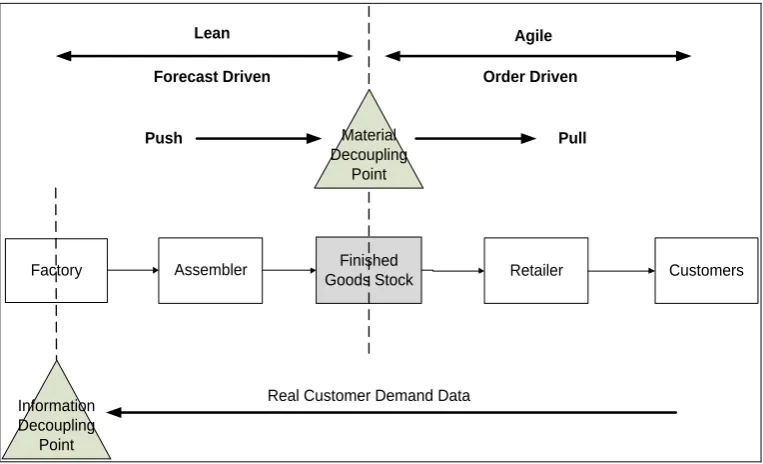
Xin Wang Page 19 An information decoupling point can also exist, and is the real demand
penetration point (Christopher and Towill, 2000). The original definition for the
information decoupling point is the point in the information pipeline to which the
marketplace order data penetrates without modification (Mason-Jones and Towill,
1999). It is the point where the forecast information and customer demand
information meet. It is placed as far upstream as possible in order to enable as
[image:34.595.119.501.482.714.2]many members as possible to access real customer demand data, as shown in
Figure 2.4. Usually through the implementation of Information Technology (IT),
supply chain partners can access greater shared information such as inventory
level, order size, and production status to support their decision making. The
concept of visibility in this research is based on information sharing. It focuses
on making the production and operational information available for all the supply
chain partners.
Factory Assembler Finished
Goods Stock Retailer Customers
Information Decoupling
Point
Material Decoupling
Point
Push Pull
Real Customer Demand Data
Lean Agile
Forecast Driven Order Driven
Chapter 2 Literature Review
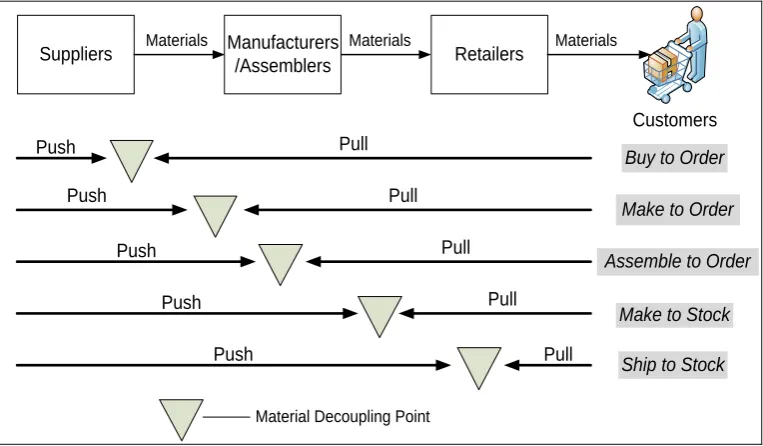
Xin Wang Page 20 The material decoupling point is critical as it will determine when and where to
adopt lean or agile manufacturing techniques (Naylor et al., 1999). Figure 2.5 illustrates the position of the material decoupling point in different supply chain
strategies; of which “Assemble to Order” is generally recognised as an
appropriate strategy to achieving LeAgility (Huang et al., 2002). Previous research suggested that, in order to maximise performance, the material
decoupling point should ideally be set close to the customer (Mason-Jones and
Towill, 1999); on the contrary, the information decoupling point should be
placed as far upstream as possible (Scholten et al., 2010) to enable as many members as possible to access real customer demand data, and therefore to
[image:35.595.119.501.491.714.2]reduce supply chain uncertainty (Stevenson and Spring, 2007), as shown in
Figure 2.5. Supply chain executives should not concentrate solely on improving
one flow (e.g. the material pipeline), but should combine both flows (material
and information) in order to improve the performance of the supply chain.
Suppliers Manufacturers
/Assemblers Retailers
Customers
Materials Materials Materials
Material Decoupling Point
Pull
Pull
Pull
Pull
Pull Push
Push
Push
Push
Push
Buy to Order
Make to Order
Assemble to Order
Make to Stock
Ship to Stock
Chapter 2 Literature Review
Xin Wang Page 21 The concept of the decoupling point has been applied in many areas, and the
results confirmed its ability to satisfy the customer needs in high variety
environments (Donk, 2001; Huang et al., 2002; Sun et al., 2008; Rahimnia and Moghadasian, 2010). Donk (2001) developed a framework based on the concept
of the decoupling point, which is useful in helping managers to make critical
decisions about which products to make to order or stock in the food industry.
Sun et al. (2008) extended the decoupling point research from a single supply chain to supply chain networks by applying multiple decoupling points to
partition a supply chain network. Their results indicated that placing multiple
decoupling points had positive effect on cost and customer delivery time
reduction. A study from Rahimnia and Moghadasian (2010) suggested that
implementing three decoupling points in a hospital supply chain reduced the lead
time and costs, and resulted in more patients being assisted. However, one
common issue revealed by their research is that it is very difficult to derive the
correct and appropriate strategic inventory at decoupling points to balance the
operational stability and the market requirement in both theory and practice. In
addition, compared with other approaches, higher inventory costs are a common
consequence for the decoupling point strategies.
2.2.4 Late customisation (postponement) approach
Late customisation (postponement) is linked to the decoupling point approach in
the supply chain. In the late customisation approach, products are no longer fully
completed for stock, or made to order, but produced part completed for stock,
Chapter 2 Literature Review
Xin Wang Page 22 decoupling point nearer to the consumer increases effectiveness, since the supply
chain is then better able to produce the products actually required by the market,
and reducing the production of unwanted product types (Naylor et al., 1999). Having a delayed configuration (or postponement strategy) allows a “mass
customisation” strategy and this presents numerous advantages (Mason-Jones
and Towill, 1999; Christopher, 2000): lower inventory, an increase in flexibility
and forecasting accuracy. More importantly, postponement strategy is often
viewed as an effective approach to achieve agility (Hoek, 2000; Graman and
Sanders, 2009). However, LeAgility through postponement is only achieved as
long as the supply chain focuses on waste elimination and fast responses.
2.2.5 The disadvantage of the four approaches
Previous research has demonstrated the impact of the decoupling point and
postponement approaches on supply chain LeAgility (Hoek, 2000; Olhager et al., 2006; Sun et al., 2008; Graman and Sanders, 2009; Rahimnia and Moghadasian, 2010; Scholten et al., 2010). However, the method with which to implement those methods was not clearly defined, since they may vary from situation to
situation according to the extent to which leanness or agility is desired.
Additionally, Table 2.2 highlights the research gap in the four LeAgility
approaches in the context of the current business environment. This research
addresses this gap by exploring supply chain visibility as an approach which
offers advantages over those four approaches when creating a LeAgile supply
chain, or can act as a tool to better enable these approaches.
Chapter 2 Literature Review
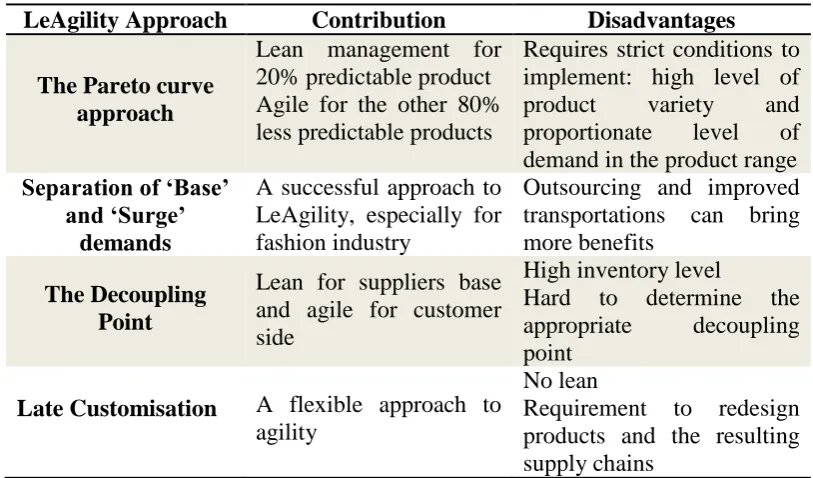
[image:38.595.105.512.110.349.2]Xin Wang Page 23 Table 2.2: The advantages and disadvantages of the four approaches
LeAgility Approach Contribution Disadvantages
The Pareto curve approach
Lean management for 20% predictable product Agile for the other 80% less predictable products
Requires strict conditions to implement: high level of
product variety and
proportionate level of demand in the product range
Separation of ‘Base’ and ‘Surge’
demands
A successful approach to LeAgility, especially for fashion industry
Outsourcing and improved transportations can bring more benefits
The Decoupling Point
Lean for suppliers base and agile for customer side
High inventory level
Hard to determine the appropriate decoupling point
Late Customisation A flexible approach to
agility
No lean
Requirement to redesign products and the resulting supply chains
2.3 Supply chain visibility – A roadmap to LeAgile
Companies are under great pressure to eliminate disruptions from their supply
chain in the current volatile business environment, however bad weather, labour
disputes, shortages, defective materials and transportation issues can all be
disasters for smooth operations. Better and quicker re-planning is the usual
solution to these issues. Planning the best solution for every eventuality is nigh
on impossible with complex operations, and secondly, the “best solution”
depends on one subjective point of view. An individual member may well have
to lose so that the whole system can win. The author believes supply chain
visibility offers a much better solution, allowing the best decisions to be made,
and thus the supply chain to be run to its best ability in a complex changing
Chapter 2 Literature Review
Xin Wang Page 24
2.3.1 What is supply chain visibility?
Visibility in general is defined as the fact of being easy to see according to the
Oxford Advanced English Dictionary. In the context of Supply Chain
Management (SCM), visibility means all seeing in supply chain. It is well
accepted as a crucial constituent for effective supply chain management;
however there is no precise definition of supply chain visibility which captures
all its characteristics. Lamming et al. (2001) and Swaminathan and Tayur (2003) shared the same views about visibility; they emphasised the importance of
information sharing and defined visibility as the ability to share information in
the supply chain in real time. According to Francis (2008), supply chain visibility
can be defined as “the identity, location and status of entities transiting the
supply chain, captured in timely messages about events, along with the planned and actual dates/times for the events”. This definition focuses on describing the
visibility of a hierarchy of entities and the linkages between them.
However, Penfield (2008) argued that visibility in supply chains is not just the
track-ability of products (or parts of product) within the supply chain; it is the
increase in available data that help analyse situation, make decisions, and
determine strategies concerning improvements in the supply chain. To maximise
the benefit of this data, information about business strategies and operations
should be shared between partners (Eisman, 2008). Other aspects of supply chain
visibility like real demand, quality of information, relatedness, and status are
Chapter 2 Literature Review
Xin Wang Page 25 There is always the risk of digital waste, information that does not directly relate
to achieving the determined goals and metrics (Abbott et al., 2005). Barratt and Oke (2007) highlighted that it is not only the information which matters but also
the extent to which the information is accurate, useful, timely, trustworthy, and
readily usable. Thus, real supply chain visibility requires that the applied
information must be accurate and up-to-date for the critical activities and
processes in the supply chain.
To sum up, some key characteristics of supply chain visibility are:
Actual end customer demand
Track and trace the transactions of the supply chain in real or suitable
time intervals.
Accurate and up-to-date information related to the critical activities and
processes
Sharing of business strategies and operation information between partners;
alignment of business objectives
A supply chain visibility solution should capture all these characteristics to tackle
the core issues of uncertainty and balancing cost/service level in a supply chain.
A supply chain with good visibility should be able to respond effectively to the
customer demand trends, leverage the root cause to quickly identify and solve the
bottlenecks or issues; mitigate supply chain risks by monitoring and managing
Chapter 2 Literature Review
Xin Wang Page 26 In order to do so, supply chain executives must know what types of information
they need and by what means. The following section discusses the links between
information sharing, visibility, and improved performance, and identifies the
types of information needed to be shared for improving visibility.
2.3.2 Information sharing, visibility and improved supply chain
performance
Many supply chain managers realise that supply chain need to be assessed for its
performance in order to evolve an efficient and effective supply chain. The
performance of a supply chain can be measured from strategic, tactical and
operational levels by defining corresponding performance metrics. Many
researches have been done to improve the supply chain performance. The
majority of them in literature focus on investigating the impact of information
sharing on improving supply chain performance.
1. Closs et al. (1997) investigated the effect of information sharing on logistics and argued that information sharing helps to better manage and
coordinate the physical movement of the supply chain.
2. Dejonckheere et al. (2004) studied the impact of information sharing on the bullwhip effect, and suggested that sharing information at a higher
level significantly reduces the bullwhip effect in supply chains.
3. A simulation study from Huang and Gangopadhyay (2004) investigated
the effectiveness of information sharing and showed that it helps the
Chapter 2 Literature Review
Xin Wang Page 27 However, these studies did not investigate the link between sharing
information and increased visibility.
4. Barratt and Oke (2007) identified visibility as the missing link of this
research investigating the impact of information sharing on improving
supply chain performance.
5. Holcomb et al. (2010) supported their statement and suggested a three-stage process to describe the linkage between information sharing and
visibility:
a) Visibility can only be achieved when the recipient believes the
shared information is timely and accurate, useful and meaningful.
b) The shared information needs to be incorporated into the
recipient’s decision-making process to allow better decisions to be
made.
c) Making better decisions logically leads to improved performance.
6. Sharing information through supply chain partners is generally agreed to
be the key to improving supply chain visibility (Christopher and Lee,
2004).
7. The shared information can be classified in various ways. Huang et al.
(2002) divided the production information into six categories: product,
process, resource, inventory, order, and planning. Many studies have been
Chapter 2 Literature Review
Xin Wang Page 28 8. Sharing the customer demand information is an effective approach to
mitigate the bullwhip effect (Chen et al., 2000; Croson and Donohue, 2003; Disney and Towill, 2003; Byrne and Heavey, 2006);
9. Sharing the order status for tracing can reduce payment cycles and
improve the quality of customer service (Chen et al., 2000; Byrne and Heavey, 2006);
10.Sharing forecasts has a positive influence on the products which have
unpredictable demand (Angulo et al., 2004; Byrne and Heavey, 2006). 11.Holweg et al. (2005) noted that sharing end customer demand caused a
major improvement on the forecast at the supplier side.
12.In addition, the experiment by Byrne and Heavey (2006) showed up to
9.7% of total supply chain cost savings after demand information was
shared completely.
13.Barratt and Oke (2007) identified that a high level of visibility on demand,
process and inventory levels can bring a sustainable competitive
advantage to supply chains;
14.Camerinelli (2005) noted that sharing financial information is very useful
for developing partner relationships.
15.Additionally, Eisman (2008) and Omar et al. (2010) shared a view that sharing information of operations and business strategies across supply
chains would increase supply chain visibility and improve performance.
Chapter 2 Literature Review
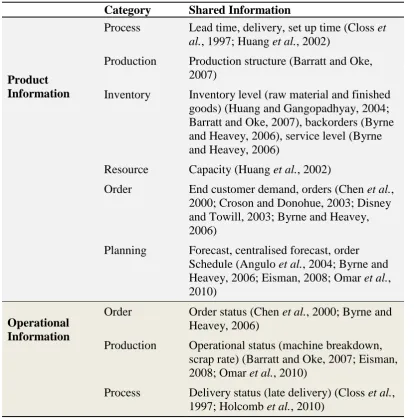
[image:44.595.106.521.110.530.2]Xin Wang Page 29 Table 2.3: Shared information for improving visibility
Category Shared Information
Product Information
Process Lead time, delivery, set up time (Closs et al., 1997; Huang et al., 2002)
Production Production structure (Barratt and Oke, 2007)
Inventory Inventory level (raw material and finished goods) (Huang and Gangopadhyay, 2004; Barratt and Oke, 2007), backorders (Byrne and Heavey, 2006), service level (Byrne and Heavey, 2006)
Resource Capacity (Huang et al., 2002)
Order End customer demand, orders (Chen et al., 2000; Croson and Donohue, 2003; Disney and Towill, 2003; Byrne and Heavey, 2006)
Planning Forecast, centralised forecast, order Schedule (Angulo et al., 2004; Byrne and Heavey, 2006; Eisman, 2008; Omar et al., 2010)
Operational Information
Order Order status (Chen et al., 2000; Byrne and Heavey, 2006)
Production Operational status (machine breakdown, scrap rate) (Barratt and Oke, 2007; Eisman, 2008; Omar et al., 2010)
Process Delivery status (late delivery) (Closs et al., 1997; Holcomb et al., 2010)
These discussions and observations addressed this question: what types of
information should be shared to improve supply chain visibility? In order to gain
the most benefits through sharing information, this research has summarised the
relevant information to be shared for improving supply chain visibility in the
literature as shown in Table 2.3. These types of information are shared in the
simulation of this research to investigate the impact of visibility on improving
Chapter 2 Literature Review
Xin Wang Page 30
2.3.3 The issues related to visibility in supply chains
Imagine a trip to your local shop to buy goods and bring them home. You could
try to complete the trip with your eyes shut, relying on your trip plan with
directions from your sat nav. This situation of no visibility is unlikely to be
successful, but many types of supply chain planning and operation rely on just
this. The environment for the trip is just too complex to totally predict in advance.
Or you could complete the trip with your eyes wide open all the time, full
visibility! This guarantees great agility and responsiveness, but is demanding in
resources and may well tire you unnecessarily. So you need to decide what rate
of eye blinking you should adopt for this trip, and whether it will be the same for
all parts of the trip, and for other similar trips. The blink rate trades off agility
against leanness. If we then say that a team of people have to complete the
shopping trip, each carrying out one part of the journey, the complications
multiply. In terms of visibility, the team need to know what is actually required
(demand visibility) and what the current situation is (operational visibility). How
this information is transmitted and acted upon determines the overall success of
the supply chain.
Although supply chains have already become leaner, there are still lost
opportunities when disruptions happen. The issues related to visibility in supply
chains can be grouped into these four areas:
1. goods in the wrong location or not available; transportation issues; lack of
Chapter 2 Literature Review
Xin Wang Page 31 2. lack of visibility in the order, shipments, inventory and transactions
(Sterling-Commerce, 2009).
3. Improved visibility encourages and enhances collaboration through trust
building.
4. Logically, the best way to infuse trust is to let partners understand what is
going on in other parts of the supply chain.
The next section establishes the value of visibility by sharing demand and
operational information.
2.3.4 Establishing the value of visibility
As discussed before, supply chain members need to know what the actual
demand is, as well as the current situation, in order to make better decisions.
Therefore, with respect to visibility, the author suggests the following two
requirements in the context of a supply chain:
1. Demand Visibility: seeing what is required
Visibility of demand allows each partner to access real demand
information in real time. This means giving each partner access to
demand information from as close as possible to the source, plus their
Chapter 2 Literature Review
Xin Wang Page 32 2. Operational Visibility: seeing what is the current operational situation
Shared operational information allows a better assessment of risk by each
partner, resulting in better overall optimisation. It also allows better
re-planning in the event of an unexpected disturbance in operations.
Increasing visibility in customer demand and operations allows the supply chain
to achieve two ultimate objectives: to improve customer satisfaction, and to
increase efficiency and effectiveness. Information technology (IT) plays an
important role in assisting supply chain managers to achieve these goals. The
next section examines the role of IT for implementing supply chain visibility.
2.3.5 Technologies for implementing visibility
The values of supply chain visibility are extensively accepted. A survey from
Global Chief Supply Chain Officer Study (IBM) interviewed nearly 400 senior
supply chain managers in 25 countries and indicated that 70% of them ranked
supply chain visibility as their top challenge and the second priority after cost
containment (Butner, 2010). However, most of supply chain managers still have
difficulties to achieve visibility even information nowadays is abundant and
easier to obtain than ever. So what is obstructing visibility deployment? The high
cost of IT may be one barrier.
Many researchers have shown a growing interest in identifying the impact of
Chapter 2 Literature Review
Xin Wang Page 33 Sridharan, 2002; Disney and Towill, 2003; Lee and Kim, 2006; Pereira, 2009;
Holcomb et al., 2010; Omar et al., 2010; Wang et al., 2010a). IT allows real time information sharing through supply chains, and facilitates the communications
between suppliers and customers. Simatupang and Sridharan (2002) stated that
IT such as the internet, software applications and decision support systems
allows supply chain managers to improve visibility in three areas:
Customer demand (price, customer information, location, quantity)
Resource planning (forecasting, product scheduling, transportation,
inventory, location, lead time, capacity)
Contract status (ordering, invoicing, price, payment, status tracking).
Technologies such as Electronic Data Interchange (EDI) and Vendor-Managed
Inventory (VMI) have demonstrated their abilities in improving demand
visibility. Iacovou et al. (1995) developed a framework of EDI for small businesses and demonstrated that EDI could provide a quality of information to
improve customer service and operation efficiency, and reduce cost on
transaction. EDI can also improve the delivery performance of suppliers, which
then eventually improves the supply chain performance (Lee et al., 1997). Yu et al. (2001) studied the benefits of information sharing and suggested that using EDI to support VMI for inventory management does not only reduce the
bullwhip effect, but also improves supply chain performance in terms of
Chapter 2 Literature Review
Xin Wang Page 34 VMI is often considered to be an inventory planning and fulfilment technology.
In a VMI system, suppliers are allowed to access the buying company’s database
to monitor and maintain inventory at an agreed level. VMI can better mitigate the
bullwhip effect than a traditional supply chain, since demand and inventory
information is shared between suppliers and customers. A simulation by Disney
and Towill (2003) showed that VMI performed better at responding to volatile
changes in demand. In addition, Yu et al. (2001) noted that VMI enables suppliers to speed up their decision-making on inventory control which results in
performance improvement.
A study by McCormack and Kasper (2002) investigated IT from the perspective
of the Internet. Using internet technology has significantly enabled the success of
Vender Managed Inventory (VMI), and Collaborative Planning, Forecasting and
Replenishment (CPFR). Holcomb et al. (2010) noted that internet technologies such as VMI, CPFR, Materials Requirement Planning (MRP) and Enterprise
Resource Planning (ERP) integrate and coordinate various phases of the supply
chain resource planning in real time which improves supply chain visibility.
It is believed that a high investment in IT seems to cause an obstacle for
information sharing (Omar et al., 2010). Internet technology offers a lower cost and rich content method to share information through supply chains. O’Donnell
and Glassberg (2005) suggested that web-based technology represents a relative
low investment in hardware and software, and less modification of the core
system, as compared with EDI. More importantly, web-based technology such as
web services (WS) and Service Oriented Architecture (SOA) addresses some of
Chapter 2 Literature Review
Xin Wang Page 35 different applications to interact (Lee and Kim, 2006). In SOA, services are
online and accessible to all supply chain members. In this way, customer demand
and current inventory level are visible for all members which result in improved
supply chain performance (Pereira, 2009). In particular, services in SOA can be
accessed via computers and mobile phones, allowing information about supply
chain disruptions to be sent in a timely fashion and automatically, via emails or
messages, by monitoring supply chain events (Folinas et al., 2006). However, Guah and Currie (2005) argued that security, reliability and vendor hype issues
obstruct the implementing of web services. Butner (2007) added that
implementing SOA requires a technological redesigning of a company’s IT
architecture.
Technologies like simulation modelling, Radio Frequency Identification (RFID)
and Business Intelligence (BI) are considered to be promising technologies to
complement supply chain management systems (Hugos, 2006). According to
Hugos (2006), these technologies can integrate with the existing system and
collect data to improve its data visibility. For instance, Goldsby et al. (2006) modelled the lean, agile or LeAgile strategy and indicated that simulation
modelling can better address "what if..." questions, by offering a comparison of
alternatives, which helps supply chain managers understand the realities of each
strategy before committing significant resources. Additionally, technologies such
as barcode and RFID make it possible for companies to track and trace material
or product flow at different stages in a supply chain. A simulation by Wang et al.
(2010a) compared the performance of RFID-enabled and non-RFID supply