http://go.warwick.ac.uk/lib-publications
Original citation:Edwards, R. S. (Rachel S.), Dutton, B., Clough, A. R. and Rosli, M. H. (2012) Scanning laser source and scanning laser detection techniques for different surface crack
geometries. In: Review of Progress in Quantitative Nondestructive Evaluation,
Burlington, VT, 17th-22nd July 2011. Published in: AIP COnference Proceedings, Vol. 1430 pp. 251-258.Permanent WRAP url:
http://wrap.warwick.ac.uk/50874
Copyright and reuse:
The Warwick Research Archive Portal (WRAP) makes the work of researchers of the University of Warwick available open access under the following conditions. Copyright © and all moral rights to the version of the paper presented here belong to the individual author(s) and/or other copyright owners. To the extent reasonable and practicable the material made available in WRAP has been checked for eligibility before being made available.
Copies of full items can be used for personal research or study, educational, or not-for-profit purposes without prior permission or charge. Provided that the authors, title and full bibliographic details are credited, a hyperlink and/or URL is given for the original metadata page and the content is not changed in any way.
Publisher’s statement:
Copyright (2011) American Institute of Physics. This article may be downloaded for personal use only. Any other use requires prior permission of the author and the American Institute of Physics.
http://dx.doi.org/10.1063/1.4716237
A note on versions:
The version presented here may differ from the published version or, version of record, if you wish to cite this item you are advised to consult the publisher’s version. Please see the ‘permanent WRAP url’ above for details on accessing the published version and note that access may require a subscription.
SCANNING LASER SOURCE AND SCANNING LASER DETECTION
TECHNIQUES FOR DIFFERENT SURFACE CRACK GEOMETRIES
R. S. Edwards, B. Dutton, A. R. Clough, and M. H. Rosli
University of Warwick, Department of Physics, Coventry CV4 7AL, U.K.
ABSTRACT. Standard test samples typically contain simulated defects such as slots machined normal to the surface. However, real defects will not always propagate in this manner; for example, rolling contact fatigue on rails propagates at around 25º to the surface, and corrosion cracking can grow in a branched manner. Therefore, there is a need to understand how ultrasonic surface waves interact with different crack geometries. We present measurements of machined slots inclined at an angle to the surface normal, or with simple branched geometries, using laser ultrasound. Recently, Rayleigh wave enhancements observed when using the scanning laser source technique, where a generation laser is scanned along a sample, have been highlighted for their potential in detecting surface cracks. We show that the enhancement measured with laser detector scanning can give a more significant enhancement when different crack geometries are considered. We discuss the behaviour of an incident Rayleigh wave in the region of an angled defect, and consider mode-conversions which lead to a very large enhancement when the detector is close to the opening of a shallow defect. This process could be used in characterising defects, as well as being an excellent fingerprint of their presence.
Keywords: Laser Ultrasound, Defect Characterization, Rayleigh Wave
PACS: 43.35.Yb, 43.38.Dv, 43.60.+d, 43.20.Gp, 81.70.Cv
INTRODUCTION
Surface defects in metals, such as rolling contact fatigue (RCF) on rails, and stress corrosion cracking (SCC), generally have a much more complicated geometry than is considered in test calibration blocks [1,2]. Typically, one considers a calibration based on a set of slots machined at 90° to the sample surface, and compares this to results from a real defect [3]. We have shown recently that, when considering the interaction of a Rayleigh wave with a surface-breaking defect, this is not always accurate [4-6]. For example, when considering a slot propagating at an angle to the surface, the reflection and transmission of Rayleigh waves show some angle dependence [5]. Furthermore, the signal enhancement as the incident and reflected wavemodes constructively interfere close to the defect shows a large dependence on the defect angle [4,6].
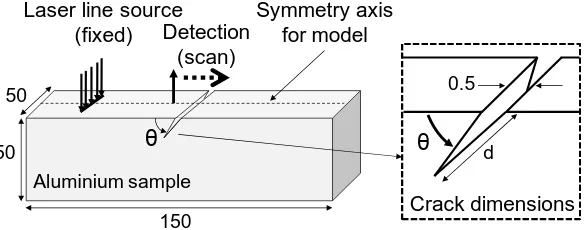
Crack dimensions
d θ
0.5
Aluminium sample
Laser line source
(fixed) Detection (scan)
150 50
50
θ
Symmetry axis for model
FIGURE 1. Experimental set-up. The laser generation and/or detection points are scanned across an aluminium sample containing a surface defect.
first step towards understanding the behaviour of ultrasound in the region of such cracking [2].
EXPERIMENT AND MODEL DETAILS
The interaction of laser generated surface waves with surface-breaking defects has been investigated using finite element method (FEM) modelling using PZFlex, and with experiments [5,8]. The measurement configuration is shown in figure 1; the generation laser is focussed into a line source, while the detection laser measures at a point. Rayleigh waves are generated and travel along the sample and are detected a certain distance from the generation point to allow transmission measurements to be carried out. When the generation laser is scanned over a defect and the detection point held fixed, this configuration is known as scanning laser line source, or SLLS [9,10]. When the detection point is scanned (and the generation laser held fixed) this is scanning laser detection (SLD) [4,6]. Several defect geometries in aluminium samples are considered, including simple angled defects (shown in figure 1), a wedge-shaped sample, and a set of thick samples containing branched defects (shown in figure 8).
The generation laser used for experiments is a pulsed Nd:YAG, with 1064 nm wavelength and a 10 ns pulse duration. This is focussed into a line of approximately 6 mm by 300 µm, oriented parallel to the surface defect, to allow good sensitivity to the defect as well as to give a directional signal in a suitable direction. The laser is filtered so that generation is in the thermoelastic regime to minimise damage. Such a generation pulse gives a broadband Rayleigh wave with a central frequency of 1.67 MHz [8]. Detection is performed using an IOS two-wave mixer interferometer which measures the out of plane displacement of the sample over a 200 µm diameter point [11]. This system was chosen due to the large bandwidth (125 MHz) and the fact that it will work on rough surfaces without the requirement of surface preparation.
The experimental set-up was modelled using PZFlex FEM software. For the wedge sample and the simple angled defects, the generation was modelled as a dipole loading force of 10 ns duration with boundary conditions set to prevent unnecessary reflections. This force was chosen to match the experimental results [5]. For the branched defects, we implemented a thermoelastic generation model, which considered the flow of heat and resulting expansion in the aluminium sample.
[image:3.595.155.449.74.189.2]ANGLED DEFECTS
It has been shown previously that, whilst reflection of Rayleigh waves has a dependence on crack angle, the transmission also has some angle dependence [3,12-14]. This means that measurement of the depth of a defect using Rayleigh wave transmission must consider the crack angle when choosing a suitable depth calibration profile. There are several ultrasonic surface wave methods with potential for measuring crack angle [4-7,13,14]; here, we consider the behaviour of the signal enhancement [4,6].
Rayleigh wave enhancement at a defect has been considered by several groups [9,10,14,15]. For a generation laser passing over the defect (SLLS), we observe enhancement due to constructive interference of the direct and reflected Rayleigh waves. Furthermore, the change in boundary conditions and shape of the generation area also lead to an enhancement. This has been highlighted as being useful for positioning defects [9,10]. For the detection laser scanning over a defect (SLD) the generation conditions remain constant. However, for a crack which propagates at 90° to the sample surface constructive interference occurs between the incident and reflected Rayleigh waves, and also with the mode-converted surface skimming longitudinal wave. This mode-converted wave travels into the bulk of the sample and is thus quickly attenuated, hence the SLLS measurement will not see its influence [12,15,16].
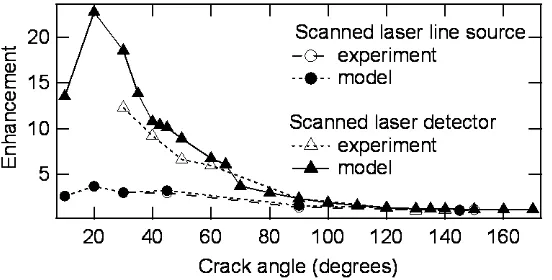
Enhancement is measured by considering the change in signal amplitude as a function of position [15]. For generation and detection points away from the defect the signal remains approximately constant, with some attenuation due to the changing separation between generation and detection. At the defect the signal is enhanced, and this amplitude can be compared to the reference amplitude away from the defect to give the signal enhancement. The behaviour of this enhancement with defect angle ( in figure 1) shows some interesting behaviour, which is illustrated in figure 2. For the SLLS measurement, the change in area of the generation laser remains the same for each angle. The boundary conditions will change slightly, as will the reflection coefficient, but this leads only to a small angle dependence of the signal enhancement. This is shown in figure 2 by circles (open for experiment, closed for model, showing excellent agreement), and can be explained by the change in reflection coefficient and concentration of the laser energy into a smaller thickness of sample [4].
[image:4.595.157.433.572.712.2]The enhancement of the signals for the SLD measurement, however, shows a much larger variation with crack angle (triangles in figure 2, calculated for a finite size detection point). Enhancements of up to 24 times the incident Rayleigh wave amplitude are observed
for shallow angled defects [6]. This cannot be explained simply by interaction of incident and reflected Rayleigh waves, plus a surface-skimming longitudinal, and hence we must consider the behaviour within an angled defect. A simple model is that of an infinite depth defect, or a wedge.
ALUMINIUM WEDGE SAMPLE
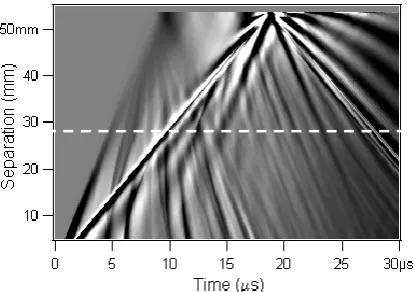
We consider here an aluminium wedge of apex angle 10°. The B-scan from a FEM model for scanning the detection laser from the generation point to the wedge tip is shown in figure 3. Below the dashed line (far-field, where the detection laser is away from the wedge tip) the incident Rayleigh wave and some reflected bulk wave modes are visible. In the near-field (above the dashed line) the wave pattern gets more complicated. We consider each section in turn.
Far-Field Behaviour
In the far-field, we can treat the wavemodes as simple Rayleigh and bulk wavemodes (longitudinal, shear) with the wedge modelled as having normal boundaries on top and bottom, and absorbing to the left (schematic shown in figure 4(a)). Wave arrival times can be calculated using simple geometry and consideration of the reflected angles for simple reflections and for mode-conversions. The thickness of the sample at each bounce can then be calculated for a 10° wedge angle;
10 tan tan
10 tan tan 1
a
T (1)
where variables are defined in figure 4(a). From this value, the distances d1, d2 etc. can be
[image:5.595.192.400.504.650.2]calculated, and hence, from knowledge of the wave velocity, the arrival times of the waves can be predicted. These arrival times are shown plotted on the B-scan in the far-field in figure 4(b); excellent agreement is shown between these predicted arrival times and the actual arrival times of the wavemodes.
w
1 w
2 T
1
d1 l1
d2 l2 l
a
x
Fixed generation
Scanned detection
(a) (b)
w
1 w
2 T
1
d1 l1
d2 l2 l
a
x
Fixed generation
Scanned detection
[image:6.595.93.517.74.210.2](a) (b)
FIGURE 4. (a) Calculation of arrival time of bulk wavemodes for a wedge. (b) Zoom-in section of the far-field in figure 3, showing the calculated arrival times.
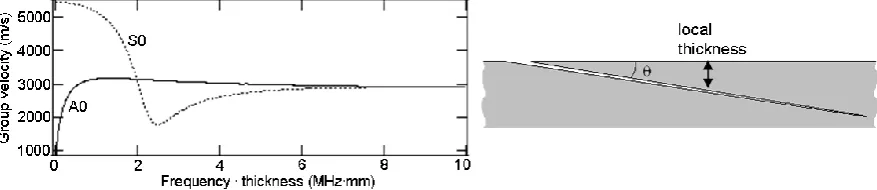
FIGURE 5. Variation in group velocity for waves incident on a wedge, as the local thickness changes.
Near-Field Behaviour
As the Rayleigh wave moves into a wedge-region, whether this is a wedge-shaped sample or an angled defect, the local thickness changes and this will affect what wavemodes can propagate. Figure 5 shows the dispersion curve for the group velocities of the fundamental A0 and S0 Lamb wave modes [12,16]. For the thick samples, the surface wave present can be approximated as a Rayleigh wave. However, once the wave has travelled into the wedge-shaped area we must consider how the velocity changes as a function of the changing local thickness [4,16-18].
In a wedge or angled defect the frequency-thickness product will be small near the tip. The group velocity (cg) can be calculated from the phase velocity (cp) using
1
2
) ( ) (
fd d
dc fd c
c
cg p p p (2)
where d is the local thickness [16]. This can then be used to predict arrival times for a surface wave as a function of frequency, f. For this, the sample is split into N sections of width x and thickness di. The travel time over a distance l N x is given by [4]
l N
i g
g c f d
x dx
x d f c f
t
0 ( , ( )) 0 ( , )
1 )
( (3)
[image:6.595.78.517.256.351.2]FIGURE 6. Calculated arrival times in the near-field of Lamb-wave like wavemodes at different frequencies.
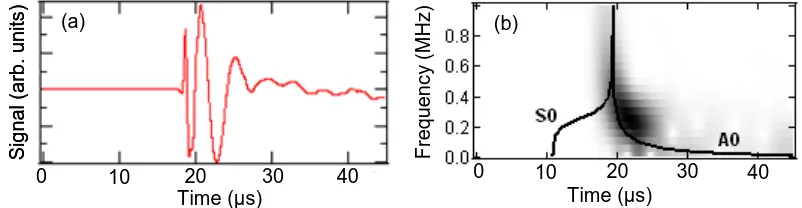
We can use similar analysis to consider the enhanced signal when the detection point is at the wedge tip. This A-scan is shown in figure 7(a), with the dispersive A0-like mode visible. This can be analysed using time-frequency analysis, with a sonogram shown in figure 7(b) with lines showing the calculated arrival times for each frequency. This clearly shows that the A0-like mode is detected, behaving as if the incident Rayleigh wave forms Lamb-like wavemodes as it propagates into a wedge or angled defect. This behaviour explains the wave pattern shown in figure 6, and also the angle dependence of the signal enhancement alongside the concentration of the wave energy into the defect point [4].
BRANCHED DEFECTS
An angled slot is an appropriate approximation for a number of surface defects. However, for defects such as stress corrosion cracking it is not clear how the branching of the defect will affect the signal transmission and enhancement. For this reason we have performed some initial studies of the reflection and transmission of Rayleigh waves with a defect consisting of a surface slot machined straight down into a sample, with a branch propagating at 45° to this crack, of various lengths, at either the opening or half way down the slot. A schematic of this sample is shown in the inset to figure 8(a).
S
ign
al
(
arb
. u
ni
ts
)
F
req
ue
nc
y
(
M
H
z
)
0 10 20 30 40 0 10 20 30 40
Time (µs) Time (µs)
(a) (b)
S
ign
al
(
arb
. u
ni
ts
)
F
req
ue
nc
y
(
M
H
z
)
0 10 20 30 40 0 10 20 30 40
Time (µs) Time (µs)
(a) (b)
[image:7.595.169.429.75.258.2] [image:7.595.98.499.582.686.2]S ign al ( arb . u ni ts ) Time (µs)
0 2 4 6 8 10 12
90°, no branch 90°, with branch
E nh an c e m e nt 2 4 6 8 10 12
Branch length (mm) 0.0 0.5 1.0 1.5 2.0
2 mm defect with 45° branch top left branch centre left branch
(a) (b) S ign al ( arb . u ni ts ) Time (µs)
0 2 4 6 8 10 12
90°, no branch 90°, with branch
E nh an c e m e nt 2 4 6 8 10 12
Branch length (mm) 0.0 0.5 1.0 1.5 2.0
2 mm defect with 45° branch top left branch centre left branch
S ign al ( arb . u ni ts ) Time (µs)
0 2 4 6 8 10 12
90°, no branch 90°, with branch
E nh an c e m e nt 2 4 6 8 10 12
Branch length (mm) 0.0 0.5 1.0 1.5 2.0
2 mm defect with 45° branch top left branch centre left branch
(a)
(b)
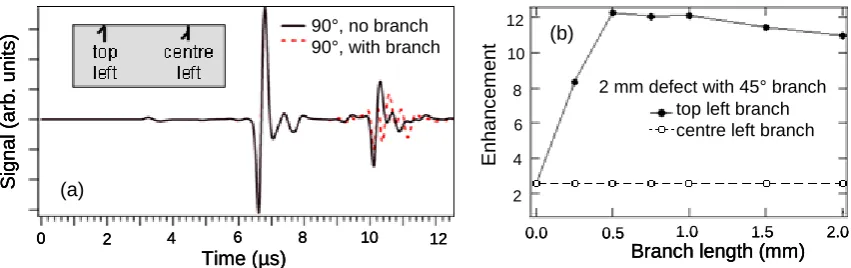
FIGURE 8. (a) A-scans for a normal surface breaking defect, and for a branched defect. (b) Signal enhancements at the crack opening as a function of position and size of the branch.
Figure 8(a) shows A-scans for the detection point a short distance from a surface breaking crack. In this case, we expect to see the large incident Rayleigh wave plus a reflected signal from the crack. This reflected signal will depend on the crack geometry; shown here is a comparison of the modelled signals for either a slot normal to the sample surface, or this same slot but with a branch on the left side. The change in reflected signal is clear.
Figure 9 shows B-Scans for (a) the slot machined normal to the surface, and for adding a very small branch to this, of 0.25 mm length and at 45° orientation. In (b), this branch is at the top left of the crack, i.e. from the opening. The effect is significant; in (b), where the branch grows from the crack opening, the defect now behaves like an angled defect, with a large enhancement and the typical extended time signal when the detector is at the crack opening. In (c), the branch is placed half way down the crack (see inset to figure 8(a)); in this case the enhancement looks similar to the 90° crack, whereas extra reflections from the branch can be seen. The enhancement as these branches grow is shown in figure 8(b) for each position; for a branch at the top of the crack, this enhancement behaves the same as for an angled defect.
CONCLUSIONS
The transmission of Rayleigh waves in the region of angled surface-breaking defects has a small dependence on the angle. Hence, to obtain an accurate depth profile, one must also have some knowledge of the internal geometry of the defect. We have shown that the signal enhancement when a laser detection point passes over such a defect has a significant angle dependence, and hence it may be possible to use this to gain an idea of a
22 20 24 26 28 S c a n p o s iti o n (m m ) Time (µs)
6 8 10 12 6 8 10 12 6 8 10 12
22 20 24 26 28 S c a n p o s iti o n (m m ) Time (µs)
[image:8.595.84.510.68.202.2]6 8 10 12 6 8 10 12 6 8 10 12
[image:8.595.83.492.609.721.2]correct calibration to use [13]. This enhancement for shallow angles is due to the concentration of wave energy into a small volume, with the pattern due to the dispersive behaviour of Lamb-wave-like modes as the local thickness changes.
The addition of branching causes extra complications. However, if the branch is close to the top surface of the sample its angle becomes important when considering signal enhancement. If it is within the sample, the position is important when considering reflections.
ACKNOWLEDGEMENTS
This work was funded by the European Research Council under grant 202735, Starting Independent Researcher Grant.
REFERENCES
1. Armitage P.R., Insight 44 (6) 369 (2002).
2. The National Physical Laboratory, Report on Stress Corrosion Cracking (2000). 3. Edwards R.S., Dixon S., and Jian X., Ultrasonics44 (1) 93 (2006).
4. Edwards R.S., Dutton B., Clough A.R and Rosli M.H., Applied Physics Letters99 094104 (2011).
5. Dutton B., Clough A.R., Rosli M.H. and Edwards R.S., NDT&E International44 (4) 353-360 (2011).
6. Dutton B., Clough A.R. and Edwards R.S., J. Nondestruct. Eval. 30 (2) 64-70 (2011). 7. Kinra V.K. and Vu B.Q., Journal of the Acoustical Society of America79 (6) 1688
(1986).
8. C.B. Scruby, L.E. Drain. “Laser ultrasonics: techniques and applications.” Adam Hilger, 1990.
9. Kromine A.K., Fomitchov P.A., Krishnaswamy S. and Achenbach J.D., Materials Evaluation58 (2) 173 (2000).
10. Arias I. and Achenbach J.D., Wave Motion39 (1) 61 (2004).
11. Klien M., Bacher G., Grunnet-Jepson A., Wright D. and Moerner W., Optics communications 162 79 – 84 (1999).
12. I.A. Viktorov. “Rayleigh and Lamb waves: physical theory and applications.” Plenum Press 1967.
13. Rosli M.H., Fan Y. and Edwards R.S., these proceedings.