A Relative Deviation Detection for Time
Series Data Based on Equality
Ching-an Hsiao, Hanxiong Chen, Kazutaka Furuse, and Nobuo Ohbo
Abstract— Outlier detection is an important problem in various fields. A lot of algorithms have been proposed, meanwhile a lot of definitions. Unsatisfying point is that definitions seem vague, which makes the problem an ad hoc one. We analyze the nature of outliers, and give a supplementary definition. Based on it, we develop an efficient relative deviation degree (RDD) algorithm to identify outliers, which converts outlier problem to pattern and degree problem. We give two type of application in time series data – line type and curve type and introduce a longest k -turn subsequence problem. We treat the structure of pattern as a kind of order, which is a novel view. We also present experimental results on synthetic and real datasets showing the efficiency of our technique.
Index Terms—Curve, Outlier, Pattern, Relative Deviation
Degree.
I. INTRODUCTION
Outlier problem could be traced to its origin in the middle of the eighteenth century ([21] p27), when the main discussion is about justification to reject or retain an observation. From then, most methods in the early work have been developed in the field of statistics. As the classic LS estimator is poor to outliers, different robust estimators were presented in turn. From L1 estimator [8] to M-estimators [10], then to S-estimators [18], robust estimators have good performance to resist outliers. But as robust estimators are also based on statistical models, which is that the statistician always has a statistical model in mind (explicitly or implicitly) when analyzing data, e.g., a model based on a normal distribution or some other idealized parametric model such as an exponential distribution [15], and in reality, the distribution of a data set is not always curtain, these methods have their limits. Besides statistical methods, many other kinds of algorithms have been proposed. From distance-based [6] to density-based [13]; from deviation-based[2][9] to neural network[11][16] and genetic algorithm [17], etc. Meanwhile a lot of ad hoc definitions are presented, and we are faced to the problem as Jagadish [9] stated that each of them gives a different answer, and none of them is conceptually satisfying. It is undoubtedly that we should make clear the definition of an outlier. But unfortunately, our general basic definition seemsto be a descriptive one rather than an exact one. Let’s
see awell-quoted intuitive definition of outlier by Hawkins [4].
An outlier is an observation that deviates so much from other observations as to arouse suspicions that it was generated by a different mechanism.
And a further definition from Barnett and Lewis [21]. An observation (or subset of observations) which appears to be inconsistent with the remainder of that set of data.
Barnett and Lewis stated that “the phrase ‘appears to be inconsistent’ is crucial. It is a matter of subjective judgement on the part of the observer whether or not some observation (or subset of observations) is picked out for scrutiny.”
Obviously, we can’t get a certain answer on these definitions. Some additive definition should be given. This paper originates from this problem and aims to detect outlier patches in time series data. We show a neglected hidden feature of outlier problem ─ pattern, which may be used to describe outlier problem in a more general view. Based on it, we present a simple relative deviation detection algorithm, which is equal to a simple robust regression. We then develop it to a general form and apply it to curve type. By giving a new concept “turn”, we extend what called longest increasing subsequence problem [3] to longest turn subsequence problem. Combining it with our general relative deviation detection algorithm, we identify outliers in curve type successfully, which is similar to the mechanism of human beings. Our solution is simple and fast, besides, is clear in definition.
We give related works in Section 2 and discuss the essence of outlier in Section 3 and present an additive definition, followed by our RDD algorithm in Section 4. In section 5, we present longest turn subsequence problem and give out outlier detection algorithm to curve type data. We will give complexity and experiments in section 6, conclusion and future work are in section 7.
II. RELATED WORKS
Identifying multiple outliers in linear models is not as simple as detecting a single outlier, owing to masking and swamping problems [19]. Multiple outliers, especially those which occur closely in time, often have severe masking effects that can render the usual outlier detection methods ineffective [1]. Ana Justel et al. [1] presented adaptive Gibbs sampling, which overcomes the inefficiency of standard Gibbs sampling to detect outlier patches. But among 200 cases, it failed in 13 cases. It seems not escaped from what Jagadish et al. evaluated the statistical methods, especially, “in the case of time series data, the situation is more murky.” [9] Jagadish et al. then proposed a technique for mining deviants in time series. Their proposal is to use the well
Manuscript received December 8, 2007. C.Hsiao, H. Chen, K. Furuse, N. Ohbo
Graduate School of Systems and Information Engineering University of Tsukuba
Tsukuba Ibaraki 305-8573, Japan Tel.: 029-853-5160
Fax: 029-853-5160
recognized information theoretic principle of representation length. Though their algorithm is of beautiful form, but two parameters, the total storage and the number of deviants, should be assigned in advance, which makes the definition of deviant, hence outlier, a dependent one.
In [7], Keogh et al. seemed treating outliers as individually surprising datapoints, and instead of processing outliers, they were interested in finding surprising patterns, i.e., combinations of datapoints whose structure and frequency somehow defies our expectations. Their novel definition about pattern surprising is that if the frequency of its occurrence differs substantially from that expected by chance, given some previously seen data. They believe the definition of surprise may be impossible to elicit from a domain expert and feel their new definition to be of advantage of not requiring an explicit definition of surprise. The use of “frequency” is also similar to human beings’ method, and forwarding one step, we could discover the essence of outlier. But neglecting characters of structure also brings shortage, which make the algorithm not so “general”. We may see this point easily from the random walk data experiment done in this paper. Furthermore, “TARZAN” algorithm has a threshold c that “can be identified by gathering statistics about the distribution of the scores and/or assuming the distribution of the scores to be normal, which indicates that finding surprising patterns in essence is also based on a kind of “deviation degree”, which, holds true in outlier detection, motivates our new RDD (relative deviation degree) algorithm.
III. ESSENCE OF OUTLIER
In their first edition ([20] p1), Barnett and Lewis quoted from Ferguson, “It is rather because…, that the loss in the accuracy of the experiment caused by throwing away a couple of good values is small compared to the loss caused by keeping even one bad value. The problem, then, is to introduce some degree of objectivity into the rejection of the outlying observations”. Outlier problem tends to be treated as an uncertain problem but measured by an objective quantity. After giving the definition of outlier ([21] p7), they drew a conclusion that “more fundamentally, the concept of an outlier must be viewed in relative terms”. Though this conclusion was made in statistical field, it could be reasonably extended to other fields. And the attitude to relativity leads to the distinction of our approach from all the others. Barnett and Lewis seem to seek “a more appropriate model”, and Keogh et al. gave an “absolute” relative definition to “surprise”. In contrast, we accept and emphasize relativity, thus develop a supplementary definition.
Definition 1: An outlier is an observation with a degree greater than a threshold in comparison with other observations referred to or associated with a specified pattern.
In this way, outlier problem changes to pattern problem. Here we distinguish two kinds of patterns to make clear the definition of outlier. One is known and of certainty, the other is unknown and of some certainty or uncertainty. The latter is like the classic “black swan” problem [5,12], if and only if a
0 1 2 3 4 5 6 7 8 9
[image:2.595.321.518.63.259.2]0 1 2 3 4 5 6 7 8 9 10 11 12 13 14 15 16 17 18 19 20
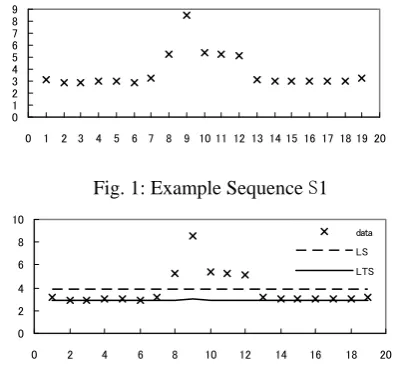
Fig. 1: Example Sequence S1
0 2 4 6 8 10
0 2 4 6 8 10 12 14 16 18 20
data LS LTS
Fig. 2: Regression line for S1
black swan is discovered, it won’t be an outlier then. To the former, outlier problem is “yes or no” problem; while to the latter, it is probability problem. Since even to former, we can measure outliers by a degree away from normal ones, we may generalize outlier problem to pattern and degree problem. That is, when we talk about outlier, we can’t separate it from a specified pattern and a deviant degree. In application, the accuracy of outlier degree is up to the accuracy of expression of the chosen patterns.
IV. RELATIVE DEVIATION DEGREE(RDD)
We present our RDD algorithm by a simple example, then generalize it.
Problem 1: Given a time series data S1 as Fig. 1, suppose data match linear model, find out outliers.
S1 = (3.1, 2.9, 2.85, 3, 3.05, 2.9, 3.2, 5.2, 8.5, 5.4, 5.3, 5.1, 3.1, 3.05, 3, 2.99, 3, 3.02, 3.2)
By classic LS regression, we get a line y=3.79-0.001x; and by robust LTS regression, line y=2.907+0.007x, as shown in Fig. 2. Now based on the above definition, we present our novelty RDD algorithm.
Given a time series data S = d1d2……dN, denote point (i,di) by pi, and ∠pjpipk by ∠jik.
Relative Deviant Degree Algorithm 1
Input: time series data S
Output: outliers of S
• Specify a similarity function sim(pk,(pi,pj))=
exp(-∠jik^2/50), denoted by
• Specify an offset function off(pk,(pi,pj)): distance of k to line Lij, denoted by
for ( i from 1 to N ) {
Xi= Yi=
}
∑∑
∑∑
ij k
s
ij
o
k≠ = = N
i p p
N
k pi k
s 1 1
≠ = = N
i p p
N
k ip k
[image:2.595.306.555.657.789.2]for( i, j from 1 to N, j≠i ) wij = Xi
×
YjRDDk= -ln
if RDDk> c then output k Notes
• Similarity function is used to evaluate the similar degree of point k related to the system of i and j, which is the pattern “line” in this case.
• Offset function calculates the real distance between
k and system of i and j.
• wijis the weight of system of ij, denotes the relative effective degree.
• Relative deviant degree combines two aspects of views from similarity and real distance.
• c is the threshold, can be identified by the same way as [7].
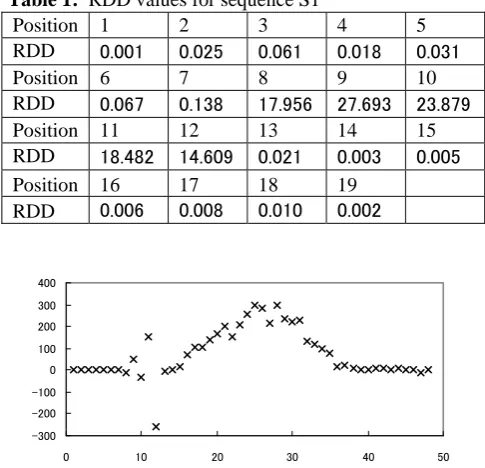
By our algorithm, to problem 1 we get RDD measure to each element in Table 1. Points at 8, 9, 10, 11 and 12 are identified as outliers.
Though RDD algorithm has commons in form with robust regression, our algorithm differs from robust one at the point that we approach from the inside structure of the pattern and stress on the whole effect, thus with more balance. Note that RDD algorithm is same as robust regression, can be possible with a highest breakdown point (50%). Now we modify our algorithm 1 to a general form. First, we introduce definition of view V.
Definition 2: Given a time series data S, a sub-series of S is also a time series where each element of it is an element of S. We denote e
p
S when e is a sub-series of S.Definition 3: Aview of S, Vα, is a set of sub-series of S of
same length
α
, that is Vα = { e| ep
S, |e|=α
} Algorithm 1’
V. CURVE-TYPE OUTLIER
[image:3.595.311.554.57.291.2]In this section, we extend RDD algorithm to curve type. In real application, curve-pattern data are general. So we give following problem.
Table 1: RDD values for sequence S1
Position 1 2 3 4 5
RDD 0.001 0.025 0.061 0.018 0.031
Position 6 7 8 9 10
RDD 0.067 0.138 17.956 27.693 23.879
Position 11 12 13 14 15
RDD 18.482 14.609 0.021 0.003 0.005
Position 16 17 18 19
RDD 0.006 0.008 0.010 0.002
∑ ∑ ∑
∑
= =
= =
× × ×
n
j i
ij N
j i
ij ij k n
j i
ij N
j i
ij ij k
w w o
w w s
1 ,
-300 -200 -100 0 100 200 300 400
0 10 20 30 40 50
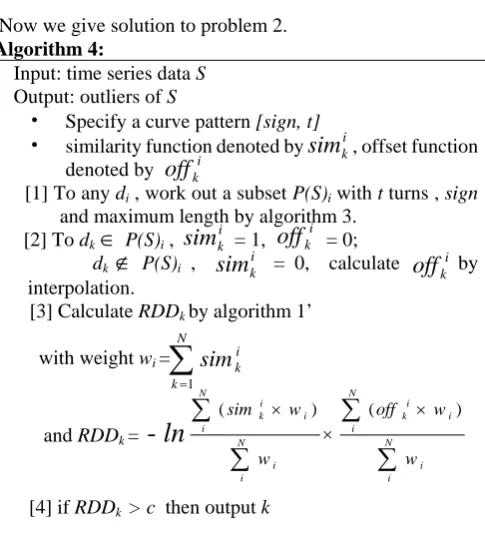
Fig. 3: Example curve-type sequence
Problem 2:
Given a sequence S of length N, {d1, d2, … dN }, which matches pattern “curve”, find outliers.
An example is shown in Fig. 3.
Though we might divide curve into several lines, it is not a satisfactory solution. By analysis to character of curves, we find that each smooth curve can be expressed by several ordered sets. We thus develop a dynamic programming algorithm to detect the order of curve typedata, which can be traced to the problem of longest increasing subsequence. We first give definitions, then present our algorithm.
Definition 4: Given a smooth curve, except for boundary points, each extremum point is called a “turn point”; the number of extremum points is called turns. We denote maximum point by sign “+”, and minimum point by sign “-”. If a sequence S has t turns and the 1st one is a maximum/minimum points, then it is denoted by [+/-, t ]. We then introduce a new problem, longest k-turn subsequence problem.
Problem 3: Given a curve-pattern series data S of length N, with k turns, and a specified view, searching a longest subsequence having k turns.
We give a simple specified view, passing a specified point i, and following algorithm.
Algorithm 2:
denote best[i][t], the longest subsequence from point 1 to point i with t turns;
P[i][t], predecessor point of i in the longest t-turn subsequence best[i][t].
Input: time series data S
Output: the longest t-turn subsequence starting from point 1. Input: time series data S
Output: outliers of S
• Let Vα be an evaluating view, e∈Vα.
• Given a similarity function sim: S×Sα-> [0,1], denoted by
• Given an offset function off: S×Sα-> , denoted by
• According to the dimension of Vα, define different
weight we and RDDkby sim and off functions. for any element e in Vα
calculate we calculate RDDk
if RDDk > c then output k 1 , ,
1 , 1
) ( ) (
+
0
R
e k
off
e k
Func route(S )
Initialize best to an array of 0’s, and T to k. for (t from 1 to T )
for (i from t +1 to N ) for( j from t to i-1) {
if (d[i], d[j], d[P[j][t]] is a monotonic sequence)
best[i][t]=max(best[i][t], best[j][t]+1)
else
best[i][t]=max(best[i][t], best[j][t-1]+1)
}
Return best[][T]
sine
-1.5 -1 -0.5 0 0.5 1 1.5
0 10 20 30 40 50
parabola
0 100 200 300 400 500 600 700
0 10 20 30 40 50
[image:4.595.311.543.59.133.2]A B Fig. 4: Synthetic sequences without outliers
sine-RDD
0 1 2 3 4 5
0 10 20 30 40 50
para-RDD
0 0.05 0.1 0.15 0.2 0.25 0.3
0 10 20 30 40 50
Algorithm 3 return the longest t-turn subsequence passing any point i.
A B
[image:4.595.50.293.360.628.2]Algorithm 3:
Fig. 5: RDD values for synthetic sequences of Fig.4 Input: time series data S
Output: the longest t-turn subsequence passing point i.
• Dividing the whole seriesdata into two parts, S1: di,
di-1,… d1; and S2: di, di+1,di+2, …, dN.
• Work out best1[][t] in S1 and best2[][t] in S2 on each t
• Combine them to identify the longest best[][T]
O(Nα+1) time (
α
>0), and in condition of parallelity, it decreases to O(N ).Robust simple regression, e.g. LTS, requires sorting of the squared residuals, which takes O(NlogN ) operations [14]. Considering operations needed by whole subsamples in data,
, total operations is O(N3logN ).
⎟⎟
⎠
⎞
⎜⎜
⎝
⎛
N
2
Now we give solution to problem 2.
Algorithm 4: Algorithm 2 can be done in O(N2
T ) time. And for the longest increasing subsequence problem is known to be solvable in time O(N log N ) [3], we may improve algorithm 2 to a quicker state in some way.
Input: time series data S
Output: outliers of S
• Specify a curve pattern [sign, t]
• similarity function denoted by , offset function denoted by
[1] To any di , work out a subset P(S)i with t turns , sign
and maximum length by algorithm 3. [2] To dk
∈
P(S)i , = 1, = 0;dk P(S)i , = 0, calculate by interpolation.
∉
[3] Calculate RDDkby algorithm 1’ with weight wi =
and RDDk=
-
ln
[4] if RDDk > c then output k
Note: To any series sets, since outliers deviate from others, it may disturb the order of sets. So we can use a kind or kinds of order to descript the pattern. Definition 2 and corresponding algorithms hold true to any kinds of order.
VI. COMPLEXITY AND EXPERIMENTS
To Algorithm 1, for each point should be evaluated by any other two ones, time consumption is O(N3) when number of data is N. But since each evaluating pairs are isolated, this algorithm is of parallelity, which makes it possible to be run in O(N ). Correspondingly, algorithm 1’ can be done in
Algorithm 4 can be done in O(N3T ) time and in O(N2T ) time in parallelity.
i k
sim
i k
off
i k
sim
off
ki∑
ik
sim
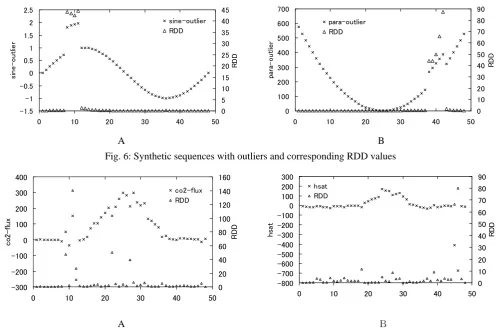
Following experiments are based on algorithm 4. Original sine data are got from function y=sin(x/47*2*PI); parabola data is from y=(x-24)^2
.
x is an integer in [0,47]. We first observe data without outliers (Fig.4) and then with outliers (Fig. 6).When there are no outliers in data series, we can get RDD
as Fig. 5, no point is identified as outlier:
When outlier patches are introduced, size +1 to the x index 7, 8, 9, 10 in sine data and size +100 to the x index from 37 to 41 in parabola data, we get corresponding RDDshown in Fig. 6. In A, points 8, 9, 10, 11 are identified; in B, angle order is adopted, and points 38, 39, 40, 41, 42 are detected rightly.
Next, we give results to two real time series data, which are one day data, measured every 30 minutes from 0 to 24 hours. One is CO2 flux data, the other is h-sat data, both achieved from Yucheng station, China in MODIS project by National Institute for Environmental Studies, Japan.
In A of Fig. 7, besides apparent points like 9, 11, 12, some inner points like 22 and 27 are detected successfully; in B, two continuous outliers 45 and 46 are identified.
Finally, we give a comparison to paper [9], where Jagadish et al presented an elegant algorithm for mining deviants. Their algorithm was thought fast and optimal. The complexity of their algorithm is O( ), where N is the length of sequence, Bm is a parameter chosen for buckets,
and km a parameter chosen for number of deviants. Here we
only discuss M1 data set, which is a time series showing the 2
2
m mk
B N
=
N
k 1
∑
∑
∑
∑
× i N i
i k
(
i k
sim
i k
off
× ×
i i N
i i k
N
i i
i
w w off
w w
sim ) ( )
-1.5 -1 -0.5 0 0.5 1 1.5 2 2.5
0 10 20 30 40 50
si
ne-o
ut
lier
0 5 10 15 20 25 30 35 40 45
0 10 20 30 40 50
RD
D
sine-outlier RDD
A
0 100 200 300 400 500 600 700
0 10 20 30 40 50
pa
ra
-o
ut
lie
r
0 10 20 30 40 50 60 70 80 90
0 10 20 30 40 50
RD
D
para-outlier RDD
B
-300 -200 -100 0 100 200 300 400
0 10 20 30 40 50
co
2-fl
ux
0 20 40 60 80 100 120 140 160
0 10 20 30 40 50
RD
D
co2-flux RDD
A
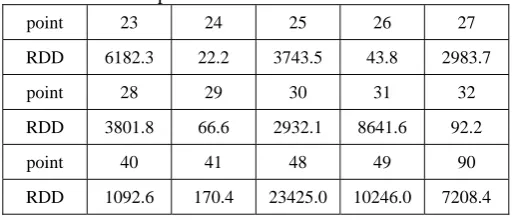
total number of hours worked by people of a given age in a year. Parameters are: N =100, Bm=40, km=10. Their result is the deviant clusters searched with size between 1 and 10 points.
Clusters c1, c2, c3 labeled in Fig. 10 were identified. In detail,
c1 contains points 23 to 30; c2 contains points between 48 and 51; and c3 at point 90. Meanwhile, our result is listed in Table 2. RDD values of points not listed are all less than 2.9, among them most are less than 0.2, the outlier with minimum
RDD is point 40. From Table 2, we can find that not only the three clusters are detected, but also an outlier at c4 (40). Note that our algorithm is O(N3T ) with T =1 and not considering parrellelity. Suppose km is ten percent of N, which is reasonable according to [9]. When N≥100, their algorithm takes time more than O(N3Bm ).
Both algorithms need to specify parameters in advance. But our algorithm only need one parameter concerned with pattern, and might be removed by following study. What is more, from respective theoretic foundation perspective, both are optimal.
VII. CONCLUSION AND FUTURE WORK
This work makes three new contributions. First, we have presented a supplementary definition to outlier, which lets us discuss outliers without vagueness. Second, we proposed efficient algorithms ― RDD for identification of deviant points. Third, we present “longest k-turn subsequence” problem and convert outlier problem to order-searching problem.
-800 -700 -600 -500 -400 -300 -200 -100 0 100 200 300
0 10 20 30 40 50
hs
a
t
0 10 20 30 40 50 60 70 80 90
0 10 20 30 40 50
RD
D
hsat RDD
Fig. 6: Synthetic sequences with outliers and corresponding RDD values
B
Fig. 7: Real sequences with outlie s an corresponding Rr d DD values
Experimentsshow the effectiveness of RDDalgorithm. By comparison to statistical method and a deviation-based algorithm, we find our algorithm is faster and more accurate. General speaking, our approach is based on pattern, and pattern is treated as relations between its elements, something what called structure. A relative mechanism is introduced to process this kind of relation, so in essence we build our method on equality of elements. Pattern can be divided into two classes: analytical pattern and non-analytical pattern. If a pattern can be expressed analytically, that is, relation among internal elements can be expressed in some form, we can use RDD formulation to extract outliers from normal sets. Non-analytical pattern will be discussed in another paper.
0 5000 10000 15000 20000 25000 30000 35000 40000
0 10 20 30 40 50 60 70 80 90 100
0 5000 10000 15000 20000 25000 30000 35000 40000 45000 50000 0 10 20 30 40 50 60 70 80 90 100
AgeHours
c1 c4 c2
c3
[image:5.595.47.547.64.397.2] [image:5.595.315.529.621.751.2]Table 2: Selected points and their RDD values for M1 data
point 23 24 25 26 27
RDD 6182.3 22.2 3743.5 43.8 2983.7
point 28 29 30 31 32
RDD 3801.8 66.6 2932.1 8641.6 92.2
point 40 41 48 49 90
RDD 1092.6 170.4 23425.0 10246.0 7208.4
Above all, pattern itself can be treated as a set, a non-disturbed set. If there is a set which includes abnormal elements, these elements may disturb the orders held by a pattern. To the curve pattern, we will study adapted algorithm in our future work so that we don’t need to specify a parameter in advance.
ACKNOWLEDGMENT
We thank Dr. Qinxue Wang for the real data, valuable help; Dr. Paul Velleman for useful suggestion; Dr. Hiroyuki Kitagawa for helpful discussion and the anonymous referees for the constructive remarks.
REFERENCES
[1] Ana Justel, Daniel Pena, and Ruey S. Tsay, “Detection of outlier patches in autoregressive time series”, Statistica Sinica Vol.11, No.3. p651-673, 2001
[2] Andreas Arning, Rakesh Agrawal and Prabhakar Raghavan, “A linear method for deviation detection in Large databased”, In KDD-96 Proceedings, Second International Conference on Knowledge Discovery and Data Mining, 1996.
[3] C.Schensted, “Longest increasing and decreasing subsequence”, Canad. J. Math., 13(1961), pp.179-191.
[4] D.M. Hawkins, “Identification of outliers”, Chapman and Hall, London, 1980
[5] David Hume, “A treatise of human nature”, 1739-1740
[6] E. Knorr and R.Ng, “Finding Intensional Knowledge of Distance-based Outliers”, VLDB Conference Proceedings, 1999
[7] Eamon Keogh, Stefano Lonardi and Bill ‘Yuan-chi’ Chiu, “Finding surprising patterns in a time series database in linear time and space”, SIGKDD, Edmonton, Alberta, Cannada July 23-26, 2002
[8] Edgeworth, F. Y., “On observations relating to several quantities”, Hermathena, 6, 279-285. [1.2], 1887
[9] H.V. Jagadish, Nick Koudas and S. Muthukrishnan, “Mining Deviants in Time Series database”, Proceedings of the 25th VLDB conference, 1999 [10] Huber, P. J., “Robust regression: Asymptotics, conjectures and Monte Carlo”, Ann. Stat., 1, 799-821, 1973
[11] Jerome T. Connor, R.Douglas.Martin and L.E.Atlas, “Recurrent Neural Networks and Robust Time Series Prediction”, IEEE Transactions on Neural Networks,Vol.5, No.2, March 1994
[12] John Stuart Mill, “A system of logic: ratiocinative and inductive”, 1843 [13] M.M.Breunig, H.-P.Kriegel, R.Ng,J.Sander. “LOF:Indentifying Density-Based Local Outliers. In ACM SIGMOD Conference Proceedings, 2000.
[14] Peter J. Rousseeuw, “Least Median of Squares Regression”, Journal of the American Statistical Association, Volume 79, 1984
[15] Ricardo A. Maronna, R.Douglas Martin and Victor J. Yohai, “Robust Statistics: Theory and Methods”, John Wiley & Sons, page 5, 2006 [16] Robert J.Bullen, Dan Cornford, Ian T. Nabney, “Outlier detection in scatterometer data: neural network approaches”, Neural Networks 16, 2003 [17] Roberto Baragona, “A simple genetic algorithm to discrete potential outlying obserations in vector time series”. Concluding meeting of MURST research group, April 5-6, 2001.
[18] Rousseeuw, P. J., and Yohai, V., “Robust regression by means of S-estimators, in Robust and Nonlinear Time Series Analysis”, edited by J.Franke, W. Hardle, and R.D. Martin, Lecture Notes in Statistics No.26, Springer Verlag, New York, pp.256-273, 1984
[19] Sung-Soo Kim, W.J. Krzanowski, “Detecting multiple outliers in linear regression using a cluster method combined with graphical visualization”, Computational Statistics, 22:109-119, 2007
[20] Vic Barnett and Toby Lewis, “Outliers in statistical data”, John Wiley & Sons, 1978.