Abstract—this paper proposes a multi agent and fuzzy logic based DSS for stock market. This system will help investors of the stock market to take the correct buy/sell/hold decisions. The results obtained from the proposed fuzzy logic model were satisfactory but not accurate. A fuzzy tuning methodology was introduced to enhance the accuracy of the decisions. The tuning methodology which uses genetic algorithms is presented also in this paper. A multi agent framework is proposed for the implementation of the system. Experimental simulation using actual price data form NASDAQ index is carried out to demonstrate the power of the proposed model.
Index Terms— Fuzzy logic, Genetic algorithms, Multi-agent systems, Stock market prediction, Technical analysis.
I. INTRODUCTION
The stock market is one of the most attractive places for investment, because of its expected high profit. Stock trading is affected greatly by the existence of the Internet. The Internet makes it easier to exchange stock information and to make stock transactions. Today, there are millions of investors who use the Internet to trade securities. Those investors will increase more and more as the network performance and security issues are enhanced. The internet provides the investors with a great amount of different types of information (Financial historical information, real time information and economical information).
Stock trading is very risky; decision making process in stock trading is a very critical and important process because it must be taken correctly and in the right time. As the investor gets more stock information his task is getting more difficult because he has to collect, filter, evaluate the available information, and come up with a right decision in the right time. Using new Artificial Intelligence techniques to help the non-experienced investors to take the stock decisions is very useful and important mission.
At the heart of the implemented system is a decision-making methodology that will help investors of the stock market. It uses fuzzy logic technique to perform the decision making process. The fuzzy logic rules were tuned and modified using Genetic Algorithms to get better results. We made our experimental simulation using actual price data from NASDAQ index. Simulation results demonstrated the power of the proposed methodology.
II. TECHNICAL ANALYSIS
In this section we will give an overview about the technical analysis, an approach that is used to make decisions in the stock market.
Technical analysis was developed around 1900 by Charles Dow [ 1]. It is based on analyzing security prices. The price of a security is the price at which one investor agrees to buy and another one agrees to sell. This price depends on the expectations of investors. If the investor expects the security's price to rise, he will take a buy decision; if the investor expects the price to fall, he will take the sell decision. These simple statements are the cause of a major challenge in forecasting security prices.
Technical analysis depends on the fact that history repeats itself. We can define technical analysis as the process of analyzing a security's historical prices in an effort to determine probable future prices. This effort is done by comparing current price action with comparable historical price action to predict a reasonable outcome.
A. Stock Terminology
Technical analysis is based almost entirely on the analysis of price and volume. The fields which define a security's price and volume are explained below:
o Open - This is the price of the first trade for the period. o High - This is the highest price that the security traded during the period.
o Low - This is the lowest price that the security traded during the period.
o Close - This is the last price that the security traded during the period.
o Volume - This is the number of shares that were traded during the period..
B. Technical Analysis Tools
Here we will describe one of the most common and efficient technical indicators, used in technical analysis [ 1].
o Moving Averages
A moving average is the average price of a security at a given time. When calculating a moving average, we specify the time span to calculate the average price (e.g., 25 days).
A "simple" moving average is calculated by adding the security's prices for the most recent "n" time periods and then dividing by "n." .This calculation is done for each period in the chart.
Stock Technical Analysis using Multi Agent and
Fuzzy Logic
Fig. 1.Moving Average [[1]] III. FUZZY LOGIC DECISION SUPPORT SYSTEM
As mentioned before, this paper proposes a fuzzy logic decision support system for technical analysis of stock market, and its tuning method for improving the decision accuracy.
In stock market prediction, many methods for technical analysis have been developed and are being used, some of them are based on statistical models, and others use AI techniques.
Many statistical methods have been proposed, but the results are insufficient in decision accuracy. Some researchers used neural network for solving this problem [ 17, 25], others used genetic programming [ 5, 8, 10].Their results were more satisfactory and more efficient than statistical models.
Fuzzy Logic was used by Halina et al. [ 5] to perform fundamental analysis of stock trading. Fuzzy logic was chosen as basis of technical analysis for the following reasons:
1. Fuzzy rules are expressed in English-like sentences using vague propositions and/or consequences that correspond more to the human way of thinking.
2. A fuzzy system is more flexible than an expert system. Fewer rules or combinations of rules are needed to cover more possible outcomes.
3. Fuzzy inferences can handle overlap or ambiguity between rules.
4. A fuzzy system is more modular and amenable to modification than neural-based trading systems.
5. Trading systems designed on the basis of fuzzy logic are capable of explaining the trading recommendations made by the system.
In the following section, a description of the fuzzy logic model design, its inputs, outputs and rules is first given. Next a description of the tuning scheme used to enhance its performance is illustrated.
A. Fuzzy Logic Model
Fuzzy logic was developed in the 1965 by Dr. Lotfi A. Zadeh, Professor of Computer Science at the University of California at Berkeley. Fuzzy logic can be used to mathematically formulate imprecise concepts (like tall, warm, and cool) so they
can be understood and processed by computers. Fuzzy logic has been successfully incorporated into many applications as control systems for subways and complex industrial processes, entertainment and household electronics, artificial intelligence, and other expert systems.
B. Fuzzy Variables
Fuzzy variables define the language that will be used to discuss a fuzzy concept. The concept in this work is directed towards handling stock information needed for technical analysis. To design the model, one defines the input and output fuzzy variables. For each fuzzy variable, one must define its units, the universe of discourse, and a set of membership functions that will be used to describe the specific fuzzy concepts associated with the fuzzy variable.
The first problem is the choice of technical indicators that will be used as inputs to the decision support system. Sotiris et al. [ 16] examined moving averages rule, with different methods and they showed that the policies with short long-term moving average are more efficient. Blake et al. [2] analyzed the behavior of moving average technical trading rules applied to over 100 years of the Dow Jones Industrial Index. According to these results it was decided to use moving averages with different variations to cover short term, medium term, and long term prices. The following table summarizes the technical indicators used as inputs to the decision support system.
Table 1.Input Technical Indicators Technical indicator Description
MA-200 Long term indicator which
represents the moving average of the prices of the last 200 trading days.
MA-100 Long term indicator which
represents the moving average of the prices of the last 100 trading days.
MA-70 Medium term indicator which
represents the moving average of the prices of the last 70 trading days.
MA-50 Medium term indicator which
represents the moving average of the prices of the last 50 trading days.
MA-20 Short term indicator which
represents the moving average of the prices of the last 20 trading days.
MA-10 Short term indicator which
represents the moving average of the prices of the last 10 trading days.
[image:2.612.311.566.372.689.2]In the following table we are summarizing the fuzzy variables we used in our system.
Table 2.Fuzzy Variables
Fuzzy variable Description
NMA-200 Normalized MA-200 is calculated by the following formula:
ice MA ice
Pr 200 Pr −
NMA-100 Normalized MA-100 is calculated by the following formula:
ice MA ice
Pr 100 Pr −
NMA-70 Normalized MA-70 is calculated by the following formula:
ice MA ice
Pr 70 Pr −
NMA-50 Normalized MA-50 is calculated by the following formula:
ice MA ice
Pr 50 Pr −
NMA-20 Normalized MA-20 is calculated by the following formula:
ice MA ice
Pr 20 Pr −
NMA-10 Normalized MA-10 is calculated by the following formula:
ice MA ice
Pr 10 Pr −
Decision Buy/Sell/Hold signal
From the above table, we can notice that we have made normalization to each technical indicator to include the relation between it and the current price of the stock symbol.
Each fuzzy variable has the universe of discourse from -∞Æ∞.
C. Fuzzy Membership Functions
The membership functions are mappings of a set of real numbers (xi) onto membership values (ui) in the range [0, 1].
]
1
,
0
[
:
S
→
F
(1)F(x) is interpreted as the degree of membership of element x in fuzzy set F for each x in S.
•1 is used to represent complete membership. •0 is used to represent complete non-membership. •All values in between are used to represent intermediate degrees of membership.
We have defined initial membership functions for each fuzzy variable.
Example:
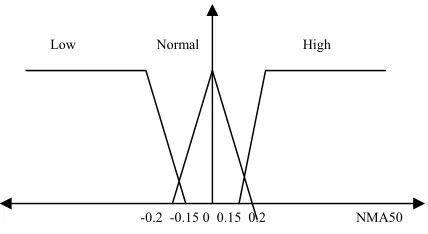
[image:3.612.47.300.78.451.2]The NMA50 input fuzzy variable
Fig. 2 Membership functions for NMA50
Using Triangular membership functions for inner membership functions were chosen for simplicity and as we seek the speed of the decision, because the changes in stock prices are very fast and critical.
D. Fuzzy Rules
After defining the membership functions of the fuzzy variables, we have defined the rules which will be used by the inference engine to produce the final result; these rules were extracted from the knowledge of stock trading experts.
Example:
If NMA50 is High then Decision is Buy If NMA50 is Normal then Decision is Hold If NMA50 is Low then Decision is Sell
E. Inference
Under inference, the degree of truth for the premise of each rule is determined using the rule inference methods for working with logical operations on fuzzy subsets. This result is then assigned to the conclusion part of each rule. Inference results in one fuzzy value being assigned to the fuzzy subset in the conclusion part of each rule. Mamadani Max-Min inference technique which is suitable for simple rules has been used.
IV. FUZZY TUNING USING GENETIC ALGORITHMS Many techniques were used to evolve fuzzy rules and membership functions [6, [10], [14], [15]].Genetic Algorithms was one of the efficient methodologies in tuning fuzzy rules and have been used in this work.
Genetic algorithms, first proposed by Holland in 1975, are a class of computational models that mimic natural evolution to solve problems in a wide variety of domains. Genetic algorithms are particularly suitable for solving complex optimization problems and for applications that require adaptive problem solving strategies.
A genetic algorithm emulates biological evolution to solve optimization problems. It is formed by a set of individual elements (the population) and a set of biological inspired operators that can change these individuals. According to evolutionary theory only the individuals that are the more suited in the population are likely to survive and to generate
Normal High
off-springs, thus transmitting their biological heredity to new generations.
The algorithm operates through a simple cycle: 1. Creation of a population of strings. 2. Evaluation of each string.
3. Selection of the best strings.
4. Genetic manipulation to create a new population of strings.
The following assumptions have been adopted:
o The membership functions number is defined for each fuzzy
variable.
o The membership function shape is defined (Triangle for
inner membership functions).
o Each fuzzy variable has 3 membership functions for the
following linguistic values (Low, Normal, and High).
o The output signal has 3 membership functions for the
following linguistic values (Buy, Hold and Sell).
A. Chromosome Encoding
Each Chromosome in the generation consists of the following genes:
1. 5 genes for every input fuzzy variable. (7 X 5=35) 2. 5 genes for the output fuzzy variable.(5)
3. We have 40 genes per chromosome. 4. Each gene has the values from (-1..1)
Fig. 3 Chromosome structure Sample genes:
01010000 = -0.2 01111000 = 0.2
B. Genetic Evolution
Each generation consists of 200 chromosomes.
The following operations were used to produce the new generations:
1. Cross Over. 2. Mutation. 3. Duplication.
We evaluated the fitness of each chromosome by decoding it into fuzzy membership functions then calculate the output result using the training data. We calculated the error resulting from that chromosome using the following formula:
∑= −
= =iN
i
result sult actual
Error 1
2
) Re
( (2)
Where N is the number of stocks used for training.
Then we calculated the fitness of the chromosome using the following formula:
Error
Fitness
=
1
/
(3) The genetic operations are applied to each generation toproduce the new generation and the process repeated until the error is less than a threshold of 0.01. Actual results were obtained from stock experts for the training data set. As training data, we have used stock data for NASDAQ index symbols for the period from 1/6/2002 to 1/1/2003.
V. MULTI AGENT INTEGRATION
Intelligent software agents are defined as being a software programs that can perform specific tasks for a user and posses a degree of intelligence. This intelligence permits them to execute parts of its tasks autonomously and to interact with its environment in a useful manner.
The multi agents is very important for the real implementation of the system, because gathering the stock information which used for the stock prediction needs many entities to gather different information from different information sources, second the processing needed to predict the buy/sell decisions need more processing power to do the job efficiently so using different agents for decision support is very useful. The ability of the agents to be propagated across the network makes it easier for them to handle the request of the users according to the location of the user. The multi agent system also adds more robustness to the system because if any of them is down another one can do the job instead. The agent system makes it possible to detect any up normal change in the stock prices and alerts the investor with that change.
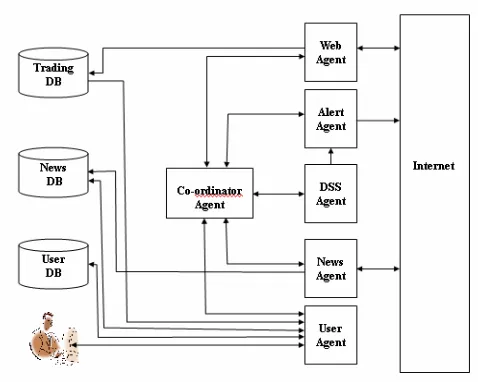
[image:4.612.319.558.397.588.2]A. Framework Components
Fig. 4 Framework Components
-Trading database (TDB): Contains information about trading data, historical data and real time data, and always updated by the Web Agent, Also it contains the latest decisions produced by DSS Agent.
-News database (NDB): Contains latest news about stocks of interest in the system ,and always updated by the News Agent. -User database (UDB): Contains information about system users, their personal information, and their trading profile.
-User Agent (UA): Interacts with the user, receiving user information and stores them into UDB, get user requests for Gene1 Gene2 Gene3 Gene40
decision support and news and retrieves the results from TDB and NDB.
-Web Agent (WA): Interacts with trading information sources in the Internet , retrieves the latest information and stores it into TDB, also contacts the DS Agent to make the latest decision based on the latest updates.
-Decision Support Agent (DSA): Retrieves the latest information from TDB and make decisions based on it, stores the latest decisions in the TDB. It contacts the Alert Agent if there is a decision with high confidence.
-Alert Agent (AA): Contacts the SMS gateway to send SMS alert to the user if an alert generated for him by DS Agent.
VI. SYSTEM RESULTS
We have used data for NASDAQ index symbols for the period from 1/1/2003 to 1/6/2003 as our testing data set.
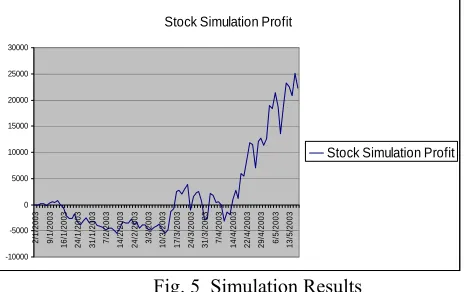
The following figure illustrates the result of the simulation system using the input stock data of NASDAQ symbols.
Stock Simulation Profit
-10000 -5000 0 5000 10000 15000 20000 25000 30000 2/ 1/ 20 03 9/ 1/ 20 03 1 6 /1 /2 0 0 3 2 4 /1 /2 0 0 3 3 1 /1 /2 0 0 3 7/ 2/ 20 03 1 4 /2 /2 0 0 3 2 4 /2 /2 0 0 3 3/ 3/ 20 03 1 0 /3 /2 0 0 3 1 7 /3 /2 0 0 3 2 4 /3 /2 0 0 3 3 1 /3 /2 0 0 3 7/ 4/ 20 03 1 4 /4 /2 0 0 3 2 2 /4 /2 0 0 3 2 9 /4 /2 0 0 3 6/ 5/ 20 03 1 3 /5 /2 0 0 3
[image:5.612.49.281.277.423.2]Stock Simulation Profit
Fig. 5 Simulation Results
The following section presents some of the results we obtained by analyzing the decisions made by the system. To be specific analysis of the decisions made by the system for short-term (one or two days), medium-tem (one week) and long-term (2 weeks) periods are illustrated.
A. Short Term Results
1) Adc Telecommunications, Inc.
The decision for January 02, 2003 was Buy 40%. The price for that date was 2.3.
When we look at the price changes we will find the following:
January 03, 2003 2.65
January 06, 2003 2.84
The price rises from 2.3 to 2.84.
On January 15, 2003 the price reaches 3.06.
2) Altera Corporation
The decision for January 02, 2003 and January 03, 2003 was HOLD.
On January 06, 2003 the decision was Buy 76%.
January 06, 2003 14.04
January 07, 2003 14.18
By looking to the price changes we find that the price rises from 14.04 to 14.18.
3) Apollo Group, Inc.
The decision for January 02, 2003 was Buy 41%. The price for that date was 45.26.
When we look at the price changes we will find the following:
January 02, 2003 45.26
January 03, 2003 45.77
The price rises from 45.26 to 45.77
4) Intel Corporation
The decision for January 02, 2003 was Sell.
January 16, 2003 17.2
January 17, 2003 16.34
January 21, 2003 16.29
January 22, 2003 16.25
By looking at the price for this period we find that it changed from 17.2 to 16.25
B. Medium Term Results 1) Yahoo
The decision for January 2, 2003 was Buy 57%.
January 02, 2003 17.6
January 09, 2003 19.44
The price changes from 17.6 to 19.44 for the first week of January.
2) Sigma-Aldrich Corporation
The decision for January 01, 2003 and January 14, 2003 was HOLD.
On January 15, 2003 the decision was Sell 52%.
January 15, 2003 45.21
January 22, 2003 44.66
The price changes from 45.21 to 44.66 for the period of one week.
C. Long Term Results
1) Compuware Corporation
The decision for January 02, 2003 to January 15, 2003 was Hold.
The decision for January 16, 2003 was Sell 41%.
January 16, 2003 4.33
January 30, 2003 3.44
The price changes from 4.33 to 3.44 for the period of two weeks.
2) Comverse Technology, Inc.
The decision for January 2, 2003 was Buy 38%.
January 2, 2003 10.6
January 16, 2003 10.93
The price changes from 10.6 to 10.93 for the period of two weeks.
Results seem satisfactory with respect to the decision support system.
• 100% successful prediction for samples of 13 stock symbols for short term analysis.
• 90% successful prediction for samples of 10 stock symbols for medium term analysis.
• 80% successful prediction for samples of 10 stock symbols for long term analysis.
VII. CONCLUSION
This paper proposed a multi agent and fuzzy logic model for stock market decision making based on technical analysis. The model was tuned and modified using genetic algorithms. The DSS was integrated into an agent based frame work to enhance the stock information retrieval process, and to be accessible through the Internet.
The model was verified and tested using real data form NASDAQ stock symbols. The results were satisfactory. As future enhancements it is suggested to use more complicated technical indicators in the fuzzy system as candlesticks.
REFERENCES
[1] Achelis, S.B. Technical Analysis from A to Z, Second Printing, New York, NY: McGraw-Hill, 1995.
[2] Blake LeBaron, “The Stability of Moving Average Technical Trading Rules on the Dow Jones Index”, Derivatives Use, Trading and Regulation, Vol. 5, No. 4.
[3] Christian Setzkorn, “Evolving Rule-Based Trading Systems”, 36th Annual Meeting of the CEA Thursday, May 30 - Sunday, June 2, 2002. [4] GA Java Implementation Toolkit World Wide Web,
http://www.angelfire.com/ca/Amnesiac/gajit.html
[5] Halina Kwasnicka, Marcin Ciosmak: Intelligent Techniques in Stock Analysis. Intelligent Information Systems 2001: 195-208
[6] J. Gomez Marin-Blazquez, Q. Shen and A. Tuson. Tuning Fuzzy Membership Functions with Neighbourhood Search Techniques: A Comparative Study. Proceedings of the 3rd IEEE International Conference on Intelligent Engineering Systems, pages 337-342, 1999. [7] Korczak J., Kustner P., "A Stock Trading System Using Genetic
Approach and Object-Oriented Database Technology", Proceedings of Workshop on Artificial Intelligence for Financial Time Series Analysis, 10th Portuguese Conference on Artificial Intelligence, Porto, Portugal, 2001.
[8] Li, J. & Tsang, E.P.K., Improving technical analysis predictions: an application of genetic programming, Proceedings, The 12th International FLAIRS Conference (FLAIRS-99), USA, 1999
[9] Luo, Y. Multi-Agent System Approach in E-Commerce -- A MASST Framework for Decision Support in Stock Trading. Ph.D. Thesis, University of Stafford, UK, 2001.
[10] M. Maniadakis, H. Surmann, “A Genetic Algorithm for Structural and Parametrical Tuning of Fuzzy Systems”, European Symposium on Intelligent Techniques, ESIT99.
[11] Melanie Mitchell. “An Introduction to Genetic Algorithms”, the MIT Press, London, 1996.
[12] Mendel J., "Fuzzy Logic Systems for Engineering: A Tutorial", Proceedings of the IEEE, vol. 83, No. 3, March 1995, pp. 345-377. [13] NRC FuzzyJ Toolkit World Wide Web,
http://ai.iit.nrc.ca/IR_public/fuzzy/
[14] Oscar Cordón, Francisco Herrera, Luis Magdalena, and Pedro Villar. A Genetic Learning Process for the Scaling Factors, Granularity and Context of the Fuzzy Rule-Based System Data Base, Information Science, Vol 136, Num 1-4, pp 85-107. 2001.
[15] R. Alcalá, J. Casillas, O. Cordón, F. Herrera, J.S.I. Zwir. Techniques for Learning and Tuning Fuzzy Rule-Based Systems for Linguistic Modeling
and Their Application Knowledge Engineering. Systems, Techniques and Applications, C.T. Leondes (Ed.), Academic Press, 1999.
[16] Sotiris Zontos, Skiada Christos, Jiannis Valvis, "Technical Analysis and Mutual Funds". Testing Trading Rules”, European Symposium on Intelligent Techniques, Orthodox Academy of Crete, Greece, June 3-4, 1999
[17] Tan, C.N.W, "Hypothetical Trading Result with a Simple Artificial Neural Network-based Financial Trading System", The Third International Workshop on Artificial Intelligence in Economics and Management, Portland State University, Portland, Oregon, USA, August 25-27, 1993, Publication of Proceedings TBA.
[18] Walter Brenner, Rudiger Zarnekow, Hartmut Writting .Intelligent Software Agents.
[19] World Wide Web, http://www.pro-fundity.com [20] World Wide Web, http://www.stockcharts.com [21] World Wide Web, http://www.stockdr.com [22] World Wide Web, http://www.trade10.com [23] World Wide Web, http://www.tradetrek.com [24] World Wide Web, http://www.tradingsmarts.com