Abstract— The biological nitrification–denitrification process is used extensively for removal of ammonia nitrogen from wastewaters. In this paper the results obtained by both batch & continuous reactor studies on denitrification using pure culture of Pseudomonas stutzeri are presented. Batch fermentations (suspended culture) were carried out to denitrify the waste water containing different concentrations of nitrates. Growth kinetics was studied at room temperature and methanol is used as the sole carbon source. By using linear technique it was observed that the logistic model was suitable at these conditions for the growth of Pseudomonas stutzeri. At a given temperature, the specific denitrification rate appeared to depend on the initial nitrogen concentration, while the specific carbon consumption rate was a function of the initial carbon content. Furthermore, a C:N ratio of 3:1 was sufficient for complete denitrification.
In the case of continuous recirculation studies using fluidized reactor, the performance of reactor was investigated for denitrification of waste water using immobilized pure culture of Pseudomonas stutzeri on glass beads (attached growth). Kinetics and mass transfer studies were conducted for various initial nitrate concentrations and flow rates. Developing Monod’s growth kinetics to these conditions, it was observed that denitrification follows zero order reaction. The experimental results were used to simulate biofilm model. Knowing the concentrations of biofilm at the surface, the external mass transfer coefficient was calculated. The majority of models developed, however, assumed external mass transfer limitation to be negligible, and therefore its effects were ignored. To reflect the real situation in microbial aggregate systems, both external and internal mass transfer limitations, and their dependence on the particle size distribution, have to be taken into account.
Index Terms —Biofilm, Biomass, Denitrification, Mass Transfer Coefficient, Pseudomonas stutzeri.
Nomenclature—
A: Area of reactor, m2
Ap: Area of particle, m2
D: Diffusivity of substrate in biofilm, m2/s
hf: Height of expanded bed, m
KL: Overall external mass transfer rate, m/s
Manuscript received July 3, 2007. This work was supported in part by Management and principal SDM College of Engineering. & Technology, Dharwad, Karnataka India.
Keshava Joshi is with the SDM College of Engineering & Technology, Dharwad, India. (Phone: +91-836-2447465; fax: +91-836-2464638; e-mail: [email protected]).
Prakash Binnal is with Shridevi Institute of Engineering & Technology Tumkur, India. (e-mail: [email protected]).
Dr. G. Srinikethan is with National Institute of Technology Surathkal, India. (e-mail:[email protected]).
Ko: Rate constant, 1/s
l: Biofilm thickness, m
np: No of particles
rm: Radius of media particle, m
Robs: Observed reaction rate, Kg/m3 ·s
Sb: Bulk concentration of Substrate, mg/L
Sf: Final concentration of Substrate, mg/L
Ss: Surface concentration on Biofilm, mg/L
T: Time, hr
Vs: Volume of reactor, m3
Vb: Volume of bed, m3
X: Biomass concentration, mg/L
η; Effectiveness factor
ρ: Biofilm dry density, Kg/m3
Є: Bed porosity.
фom : Modified Thiele modulus
I. INTRODUCTION
Nitrate contamination of ground water is becoming a problem in many parts of the world. Nitrogen in various forms (Particulate Organic-N, Soluble Organic – N, Ammonia – N, Nitrite - N Nitrate - N) is most common pollutant from various industries, like fertilizers production, explosives manufacture, coking, refining, food processing, organic chemical manufacturing, alcohol production, starch industry, metallurgy, petrochemical industries, and many. More than 10mg/L leads to health hazards like methemoglobinemia [1] in infants and also serious problems including eutrophication of lakes and rivers, deterioration of the ground water quality, heavy sludge formation in treatment. Further, transformation of nitrogen- containing compounds by microbial species leads to the production of gaseous intermediates such as nitric and nitrous oxides, which are considered as major contributors to ozone depletion in the stratosphere [2],[3]. Biological denitrification involves the microbial reduction of nitrates to
nitrogen[3],[4] gas that can be safely released to environment
and these methods are found to be efficient and less expensive for removal of nitrogen compounds from wastewater. The
process proceeds through a series of four steps[5]
NO3−→NO2−→NO→N2
Denitrification is considered to be an anoxic process, occurring when nitrate or nitrogen is used instead of oxygen as a terminal electron acceptor and requires an organic and
Denitrification: Mass Transfer and Kinetic
Studies
inorganic substrate for energy (electron donor) and cell synthesis. Due to this the addition of an external substrate is necessary for complete denitrification and for this methanol [6] served as most economical and effective electron donor and has been widely used. Denitrification can be achieved by
several facultative bacteria (Pseudornonas, Achromobacter
and Bacillus). However, many facultative anaerobic bacteria
are nitrate respiring[7], i.e., they use nitrate but cannot further
reduce nitrite species. Denitrification, as all biological processes, is a function of pH. A number of experimental studies summarized, have shown that the optimal pH for the process is in between 7.0 to 8.2.
Fluidized-bed bioreactors have received sustained attention due to a number of advantages associated with their use. Most of the fluidized-bed reactors developed for
biological processes involve cells as biocatalyst[8], [9], [10],
[11] and include three phases: solid, liquid and gas. Gas is
present either because of aeration requirements of the cells or as a product of their metabolism. An intrinsic characteristic is that fluidized-bed bioreactors necessarily use immobilized biocatalyst.
The transport and utilization of substrate within a
microbial aggregate can be divided into three steps[12]: firstly
transport from the bulk liquid to the external aggregate surface (external mass transfer), secondly diffusion within the aggregate matrix (internal mass transfer), and lastly substrate consumption by the microorganisms. Because the steps are sequential in nature, each one is important for determining the overall substrate reaction rate within the aggregate. The first step, external mass transfer, can be viewed as transport by convection and diffusion through a concentration boundary layer outside the aggregate. This step can be very important in determining the rates of the two following steps since it defines the maximal substrate concentration on the surface of the microbial aggregate. The external mass transfer can be expressed by the thickness of the concentration boundary layer, which is a function of the hydrodynamics, the geometry of the aggregate and the diffusion properties of the substrates in the liquid phase. In the case of high fluidization the external mass transfer resistance can be neglected. In order to formulate external mass transport (which was not considered in earlier models) to the bioparticle a stagnant film between biofilm surface and liquid phase is assumed in which all external resistance resides. Then the flux can be expressed as
)
(
S ScK
NA= L b−
In this paper denitrification studies in a fluidized bed reactor using a synthetic substrate, methanol, as the carbon source and glass beads as the support for biomass growth are reported. The objectives of this work are (i) to study growth kinetics in suspended culture (ii) to study the mass transfer coefficient using biofilm model.
II. MATERIALS AND METHODS
A. Microorganisms and Materials
Pseudomonas stutzeri (NCIM 5136, ATCC 17588) was procured from NCIM, a division of National Chemical Laboratories, Pune, India. The strain was periodically sub cultured once in fifteen days on agar slants and was stored at
40C. All chemicals were procured from Nice Chemicals;
Cochin, India. Glass beads of average size 3 mm size were used for fluidized bed process.
B. Growth Medium Used For the Inoculum Preparation Potassium nitrate(as per requirement), Methanol (80mg/L), Magnesium sulphate (6mg/L), Ferric chloride(0.2mg/L), Sodium phosphate dibasic(430mg/L), Potassium dihydrogen orthophosphate(320mg/L), Sodium sulphite(100mg/L) in distilled water.
C. Inoculum Preparation (For Batch Fermentation)
A loop full of test organism from a freshly sub cultured slant was inoculated into a 200ml of sterile media, containing known amount of nitrate and all the required nutrients with
salts. The culture was incubated at 31.50C till maximum
growth is attained. This forms the culture and about 5% inoculum was used for batch fermentation.
D. Acclimatization of Pseudomonas stutzeri
About 100 ml of media was taken in the conical flask and
sterilized in autoclave at 1.25 Kg/cm2 at 1210C for 20 min and
cooled to room temperature. A loop full of test organism from the freshly sub cultured slant was inoculated into the above medium. The culture was incubated in a shaker for 48hrs at 180 rpm in room temperature. This formed the acclimatized culture.
E. Cell immobilization
Cell suspension cultured for 48 hrs with acclimatized inoculum was prepared. To every gram of glass beads 5 ml of
cell suspension was added and it was refrigerated at 40C for 2
days. The immobilized glass beads were then filtered, washed and used in the experiment.
F. Estimation of Biofilm Thickness
The Biofilm thickness was estimated by an optical microscope equipped with a micrometer. The average Biofilm thickness was determined by measuring the Biofilm thickness of 10 to 15 bioparticles taken from the bioreactor.
III. EXPERIMENTATION
A. Batch Growth Kinetics
condition was maintained. To keep the dissolved oxygen (DO) level minimum sodium sulphite is added. The constituents in the batch reactor were mixed throughout the duration of the experiment in order to get homogeneity. Fermentation was allowed to proceed up to 96 hours. The pH remained uncontrolled during fermentation.
For every 12 hrs samples were removed and then centrifuged and supernatant is analyzed for Nitrate, pH, DO and residue was analyzed for biomass.
B. Fluidized Bed Reactor (Continuous Recirculation Process)
The lab scale fluidized bed (0.00224 m3 of volume) has a height of 0.8m, OD 0.063m and ID of 0.06m and consists of one inlet of 0.015m at bottom and one outlet of 0.015m at top. The Immobilized beads were placed on metallic wire mesh with initial bed height of 0.04m. The synthetic wastewater was introduced at the bottom of the reactor using centrifugal pump capacity of 1/2hp. The concentration of nitrate in the effluent from the column was analyzed at regular intervals (1 hr)
The performance of the fluidized bed for biodegradation of nitrate in a synthetic wastewater containing of different nitrate concentrations (250, 500, 750 and 1000 mg/L) was
studied for inlet flow rates 1.8 m3/hr and 2.3m3/hr. Continuous
biodegradation studies were conducted in the reactor at these operating conditions, to study the effect of above mentioned parameters on the biomass concentration and there on nitrate reduction at the measured pH level. To keep the DO level minimum the sodium sulphite is added.
C. Nitrate Analysis
Nitrate analysis was carried out using Ion Analyzer (Orion Make).
D. Estimation of Biomass Dry Weight
The residue was analyzed for biomass. The residue was
taken on to filter paper then dried at 1000C in an oven, till
constant weight was achieved.
IV. RESULTS AND DISCUSSION
A. Batch Growth Kinetics
The pattern of nitrate reduction and biomass growth with
respect to time for Pseudomonas stutzeri are shown in Fig.
1(A), 1(B), & 1(C) for different initial Nitrate concentrations. These figures indicate that at initial stage of fermentation there was small lag phase observed, which was due to number of different biochemical reactions involved in substrate utilization including their terminal hydroxylation and
oxidation till 12th hr. Thereafter it was observed that it attains
the exponential phase where in growth increases rapidly, due to more biochemical reactions in which microbes utilize more substrate, this leads to decrease in nitrate concentration
rapidly. As per the batch growth phenomena, small stationary phase was observed followed by death phase during which denitrification rate was very slow since activity of microorganisms decreased maximum at this stage.
B Fluidized Bed Reactor (Continuous Recirculation Studies) The Fig. 2(A), 2(B), 2(C), & 2(D), indicate the results of denitrification rate and biomass growth. It can be observed that nitrate reduction rate is more at first half and it becomes slow for the second half of the experiment for all cases. This may be explained by the fact that at the initial stage more
0 5 10 15
0 12 24 36 48 60 72 84 96 T ime (hr)
N
itr
at
e C
onc
ent
ra
tion
(mg
/L)
0 200 400 600 800 1000
B
ioma
ss
C
onc
(
m
g/
L
)
Nitrate Biomass
Fig.1 (A) Profile of Biomass Concentration & Nitrate Concentration for initial Substrate Concentration of 15mg/L
0 5 10 15 20
0 12 24 36 48 60 72 84 96
T ime (hr)
N
itr
at
e C
onc
(
m
g/
L
)
0 500 1000 1500
B
iom
as
s C
onc
(m
g/
L)
Nitrate Biomass
Fig.1 (B) Profile of Biomass Concentration & Nitrate Concentration for initial Substrate Concentration of 20mg/L
0 5 10 15 20 25
0 12 24 36 48 60 72 84 96108 T ime (hr)
N
itr
at
e C
on
cen
tr
at
io
n
(m
g/
L)
0 500 1000 1500 2000
B
iom
as
s C
on
c
(m
g/
L
)
Nitrate Biomass
Fig.1 (C) Profile of Biomass Concentration & Nitrate Concentration for initial Substrate Concentration of 25mg/L
well as lower initial substrate concentration produces thick biofilm. Thick biofilms yield higher biomass, which can result in higher conversion rates.
0 50 100 150 200 250
1 2 3 4 5 6 7 8 9
T ime (hr)
N itr at e C on c (m g/ L ) 0 0.5 1 1.5 2 B io m ass C on c. (m g/ L )
Nitrate 2.3 m3/hr Nitrate 1.8m3/hr Biomass 2.3m3/hr" Biomass 1.8 m3/hr
Fig.2 (A) Profile of Biomass Concentration & Nitrate Concentration for Initial substrate concentration of 250mg/L
0 100 200 300 400 500
1 2 3 4 5 6 7
T ime (hr)
N itr at e C onc ( m g/ L ) 0 0.2 0.4 0.6 0.8 1 1.2 1.4 B iom as s C onc (m g/ L )
Nitrate 2.3m3/hr Nitrate 1.8 m3/hr Biomass 2.3m3/hr Biomass 1.8 m3/hr
Fig.2 (B) Profile of Biomass Concentration & Nitrate Concentration for Initial substrate concentration of 500mg/L
0 250 500 750
0 1 2 3 4 5 6 7
T ime (hr)
N itr at e C onc (m g/ L) 0 0.5 1 1.5 B iom as s C onc (m g/ L)
Nitrate 2.3m3/hr Nitrate 1.8 m3/hr
Biomass 2.3 m3/hr Biomass 1.8m3/hr
Fig.2 (C) Profile of Biomass Concentration & Nitrate Concentration for Initial substrate concentration of 750mg/L
0 250 500 750 1000
1 2 3 4 5 6 7 8 9 T ime (hr)
N itr at e co nc ( mg /L ) 0 0.5 1 1.5 2 B ioma ss C onc (mg /L )
Nitrate 2.3m3/hr Nitrate 1.8m3/hr
Biomass 2.3m3/hr Biomass 1.8m3/hr
Fig.2 (D) Profile of Biomass Concentration & Nitrate Concentration for Initial substrate concentration of 1000mg/L
C. External Mass Transfer Coefficient Using Biofilm Model
1. Cross sectional area of the reactor, A=0.00283 m2
2. Diffusivity of substrate in the biofilm (from literature),
D=8.15×10⁻¹⁰m2 s
3. Reaction rate constant (from literature), s 1 10 32 . 3
ko = × −5
Based on the experimental results the following parameters required for simulation were calculated as given below.
i. Biofilm Dry Density
Having determined the biofilm thickness, the biofilm dry density was calculated by an empirical relation.
l 1245 . 0 3 . 104 − =
ρ (l in µm) (1)
ii. Bed Porosity
The bed porosity can be defined as ratio of void volume to total volume of bed. The void volume can be calculated by the difference in total volume and total volume of all bioparticles.
f s Ah V 1− =
ε (2)
For spherical bioparticles the influence of geometric
differences like dependence on the ratio
p m
r r
can be eliminated
by replacing the bioparticle radius of conventional Thiele modulus r with a characteristic dimension as,
area surface exterior Biofilm volume Biofilm r=
(
)
2 p 3 m 3 p r 4 r r 3 4 r ⋅ π − π= (3)
Modified zero order Thiele modulus can be defined as,
5 . 0 b o om DS k r ⎟⎟ ⎠ ⎞ ⎜⎜ ⎝ ⎛ρ =
By numerical solution an explicit relationship between effectiveness factor and modified Thiele modulus can be obtained as,
9 . 0 om
132 .
0 φ −
=
η (5)
iii. Observed Reaction Rate and Mass Transfer Coefficient
Knowing initial and final concentration of substrate and time of operation of fluidized bed reactor, the observed reaction rate (i.e., substrate removal rate) is calculated as,
(
)
T S S
R f b
obs = − (6)
or the substrate to be consumed, first it has to diffuse through a thin stagnant liquid film surrounding the bioparticle and then into the microorganism layer. The substrate consumption rate in the fluidized bed can be related to the overall external mass transfer rate as,
(
b s)
p p L o
el mod ,
obs V k XV K A n S S
R =η = − (7)
From (7) we can develop
(
b s)
p p
el mod , obs L A n S S
V R
K
−
= (8)
[image:5.595.64.530.296.427.2]
By (8) we can calculate the external mass transfer coefficient.
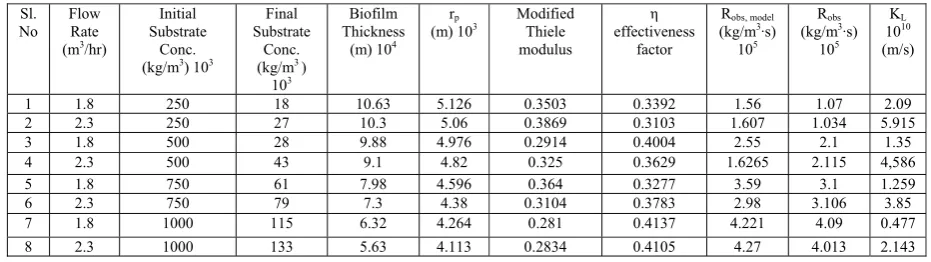
Table I. Data for External Mass Transfer Coefficient at Different Nitrate Concentrations and Flow Rates.
Sl. No
Flow Rate (m3/hr)
Initial Substrate
Conc. (kg/m3) 103
Final Substrate
Conc. (kg/m3 )
103
Biofilm Thickness
(m) 104 rp
(m) 103 Modified Thiele modulus
η
effectiveness factor
Robs, model (kg/m3·s)
105
Robs (kg/m3·s)
105 KL 1010 (m/s)
1 1.8 250 18 10.63 5.126 0.3503 0.3392 1.56 1.07 2.09
2 2.3 250 27 10.3 5.06 0.3869 0.3103 1.607 1.034 5.915
3 1.8 500 28 9.88 4.976 0.2914 0.4004 2.55 2.1 1.35
4 2.3 500 43 9.1 4.82 0.325 0.3629 1.6265 2.115 4,586
5 1.8 750 61 7.98 4.596 0.364 0.3277 3.59 3.1 1.259
6 2.3 750 79 7.3 4.38 0.3104 0.3783 2.98 3.106 3.85
7 1.8 1000 115 6.32 4.264 0.281 0.4137 4.221 4.09 0.477
8 2.3 1000 133 5.63 4.113 0.2834 0.4105 4.27 4.013 2.143
D. Discussions
The Biomass Concentration is one of the parameters which affect the performance of Fluidized Bed Reactor. As biomass concentration increases the denitrification rate increases. The effects of various parameters on biomass concentration were studied and are reported below.
i. Effect of Initial Nitrate Concentration
From the Fig.3 it was observed that as initial nitrate concentration increases biomass production decreases. The decrease is more up to the initial nitrate concentration 500mg/L for both the flow rates, and then decrease rate becomes almost constant. Increase in initial nitrate concentration leads to decrease in percentage reduction of nitrate concentration. This is clearly due to decrease in the activity of microorganism at higher nitrate concentration, which results in lesser biomass production. Since biomass production is less, substrate consumption by them is also less hence the denitrification rate becomes slow.
ii. Effect of Flow Rate
It can be observed from figures that flow rate affects biomass concentration differently at various values. This may be due to the expansion of fluidized bed resulting in increase in porosity leading to higher biomass concentration, since
space availability was more. Further increase in flow rate leads to more expansion of bed but gives less residence time and also increases collision between particles which may also result in decreased biomass concentration. Hence optimum flow rate has to be maintained for maximum growth.
iii. Effect of Biofilm Thickness on Mass Transfer Coefficient
0 0.5 1 1.5 2
0 250 500 750 1000
Initial Nitrate Concentration (mg/L)
B
io
m
as
s C
on
cen
tr
at
io
n
(mg
/L)
1.8 m3 /hr 2.3m3/hr
Fig.3 Profile of Maximum Biomass Concentration & Initial different substrate concentration at different flow rate
0 1 2 3 4 5 6 7
5 7 9 11
Biofilm T hickness (m*10-4)
Mas
s t
ran
sf
er
C
oef
fi
ci
en
t
(
m
/s
*10
-1
0)
1.8m3/hr 2.3m3/hr
Fig.4 Profile of Mass Transfer Coefficient & Biofilm Thickness at different flow rates
V. CONCLUSIONS
From the Batch fermentation studies, it was observed that the maximum denitrification achievable was 80.5% for an initial nitrate concentration of 20mg/L.The logistic model was found suitable at these conditions for the growth of Pseudomonas stutzeri.
In the continuous denitrification studies using fluidized bed bio reactor, experimental results indicate that biological denitrification follows the zero order reaction. The maximum denitrification (92.8%) was observed for the flow rate of 2.3
m3/hr with an initial nitrate concentration of 250 mg/L. The
maximum biomass was produced under these conditions. The results were simulated using biofilm model, from which it was observed that external mass transfer coefficient increases with an increase in biofilm thickness. In previous models it was assumed that external mass transfer resistance was low and hence neglected. In this study, the effect of external mass transfer was considered, and found to be significant to affect overall rate. During the simulation it was found that the biofilm surface concentration of substrate was nearly 60% of bulk concentration. Hence it can be concluded that external mass transfer resistance although less, cannot be neglected.
ACKNOWLEDGMENT
Mr. Keshava Joshi thanks Mr. Raghavendra Kulkarni and project students for their valuable assistance. He is also thankful to Dr. Y. S. Rai, Dr. R. D. Kulkarni, and staff of Microbiology Dept., S. D. M. College of Medical Sciences and Hospital, Dharwad for providing their laboratory facilities.
REFERENCES
[1] U. S. National Research Council. 1972. Accumulation of nitrate. National Academy of Sciences, Washington, DC.
[2] Klingensmith, K. M., Alexander, V. (1983). Sediment nitrification, denitrification, and nitrous oxide production in a deep arctic lake. Appl. Environ. Microbiology. Vol 46: pp 1084-1092.
[3] Payne, W. J. Denitrification. Wiley, New York (1981).
[4] J.H. Wang, B. C. Baltzis, and G. A. Lewandowski Fundamental Denitrification Kinetic Studies with Pseudomonas denitrificans, Biotechnology and Bioengineering, Vol. 47, (1995), pp. 26-41.
[5] Payne, W.. Reduction of nitrogenous oxides by microorganisms. Bacterial. Rev. Vol 37, (1973), pp 409-452.
[6] Narjari, N., Khilar, K., Mahajan, S. Biological denitrification in a fluidized bed. Biotechnology and Bioengineering. Vol 26, (1984), pp 1445-1448.
[7] Isabel Coelhoso, Rui Boaventura, and Alirio Rodriguest, Biofilm Reactors: An Experimental and Modeling Study of Wastewater Denitrification in Fluidized-Bed Reactors of Activated Carbon Particles” Biotechnology and Bioengineering, Vol. 40, (1992), pp. 625-633. [8] Denac, M., Dunn, I. Packed and fluidized-bed biofilm reactor
performance for anaerobic wastewater treatment. Biotechnology and Bioengineering. Vol 32, (1988), pp 159-173.
[9] Fan, L., Leyva-Ramos, R., Wisecarner, K., Zehner, B. Diffusion of phenol through a biofilm grown on activated carbon particles in a draft-tube three-phase fluidized-bed bioreactor. Biotechnology and Bioengineering. Vol 35, (1990), pp 279-286.
[10] Ster. C., Boyes.A, Hay. B., Butt. J, An aerobic fluidized bed reactor for wastewater treatment. Chem. Eng. Res. Des. Vol 64, (1986), pp 425-430.
[11] Vingstone, A, Chase, H, Modeling phenol biodegradation in a fluidized-bed bioreactor, AIChE J. Vol 35(12), 1989), pp 1980-1992
[12] Francese Godia and Carles Sola, Fluidized Bed Bioreactors-Review Biotechnology Progress, Vol1, (1995) pp 479-497.
[13] Britt-Marie Wile´n, Daniel Gapes, Jurg Keller. Determination of External and Internal Mass Transfer Limitation in Nitrifying Microbial Aggregates (2004) Wiley Periodicals, Inc
[14] Kornaros M and Lyberatos, G. Kinetic modeling of Pseudomonas Denitrificans growth and denitrification under aerobic, anoxic and transient operating conditions. Water. Res.Vol 32 (6), (1998), pp 1912-1922.
[15] Metcalf & Eddy, Inc. "Chapter 11: Advanced Wastewater Treatment" in: Wastewater Engineering: Treatment, Disposal, and Reuse, Third Ed. McGraw-Hill, Inc., New York, NY (1991).
[16] Leo.T.mulchay et al, “Simplified Mathematical Models for a Fluidized Bed Biofilm Reactor”. The American Institute of Chemical Engineers, (1981), pp 273-284.
[17] H. Ted Chang, Bruce E. Rittmann, D. Amar, R. Heim, O. Ehlinger, Y.
Lesty “Biofilm Detachment Mechanisms in a Liquid-Fluidized Bed”.
Biotechnology and Bioengineering, Vol 38, (1991), pp 499-506. [18] Denac and Dunn, “Bed Biofilm Reactor performance for anaerobic
waste water treatment”. Biotechnology and Bioengineeing, Vol 32, (1988), pp 160-173.