Combining Textual and Speech Features in the NLI Task
Using State-of-the-Art Machine Learning Techniques
Pavel Ircing, Jan ˇSvec, Zbynˇek Zaj´ıc
University of West Bohemia Univerzitn´ı 8
306 14 Plzeˇn Czech Republic
{ircing, honzas, zzajic}@kky.zcu.cz
Barbora Hladk´a, Martin Holub
Charles University Malostransk´e n´am. 25
118 00 Prague 1 Czech Republic
{hladka, holub}@ufal.mff.cuni.cz
Abstract
We summarize the involvement of our CEMI team in the “NLI Shared Task 2017”, which deals with both textual and speech input data. We submitted the results achieved by using three differ-ent system architectures; each of them combines multiple supervised learning models trained on various feature sets. As expected, better results are achieved with the systems that use both the textual data and the spoken responses. Combining the input data of two different modalities led to a rather dramatic improvement in classification performance. Our best performing method is based on a set of feed-forward neural networks whose hidden-layer outputs are combined to-gether using a softmax layer. We achieved a macro-averaged F1 score of 0.9257 on the evaluation (unseen) test set and our team placed first in the main task together with other three teams.
1 Native Language Identification
We think of learning a second language L2 by peo-ple with their native language L1. The Native Lan-guage Identification (NLI) task is to recognize the L1 of an L2 author’s text or speech. Most work in the NLI field has focused on identifying the native language of students learning English as a second language, which is also reflected in the very first experiments with written responses and spoken re-sponses, see (Koppel et al.,2005) and (Schuller et al.,2016), respectively.
With respect to the form of analyzed responses, written ones and spoken ones, we distinguish be-tween text-based NLI and speech-based NLI, re-spectively. In text-based NLI, all experiments
per-formed so far are based on searching patterns in texts that are common to groups of speakers of the same L1. This idea naturally arises from general awareness that L1 speakers use typical grammat-ical constructions or make typgrammat-ical mistakes when using L2.
Speech-based NLI is naturally being ap-proached differently, mainly by analyzing the acoustic properties of a speech utterance by the acoustic signal processing methods. Very re-cently (Schuller et al.,2016) organized theNative Language Sub-Challengewith spoken responses.
While most NLI research has focused on En-glish as L2, there is also a growing trend to apply the techniques to other L2 languages, e.g. Norwe-gian (Malmasi et al., 2015a), Chinese (Malmasi and Dras, 2014a), Finnish (Malmasi and Dras, 2014b).
NLI has a wide variety of potential applica-tions and both its techniques and findings can be used in areas such as Second-Language Acquisi-tion (Ortega,2009), author profiling (Rangel et al., 2013), and authorship contribution (Halvani et al., 2016). Typically, NLI is employed as a starting point for investigations into crosslinguistic influ-ence, see e.g. (Jarvis and Paquot,2012).
In this paper, we summarize the involvement of the CEMI team in the NLI Shared Task 2017 co-located with the12th Workshop on Innovative Use of NLP for Building Educational Applications
held in September 2017 in Copenhagen, Denmark. The NLI task is typically framed as a classification problem where the set of L1s is known a priori. The NLI Shared Task 2017 deals with 11 output classes C = {ARA, CHI, FRE, GER, HIN, ITA, JPN, KOR, SPA, TEL, TUR},1 and defines three
sub-tasks that differ in data sources available: 1The classes correspond to 11 different L1 languages, namely Arabic, Chinese, French, German, Hindi, Italian, Japanese, Korean, Spanish, Telugu, and Turkish, respectively.
ICLEv2 Lang-8 TOEFL11
Granger et al.(2009) Mizumoto et al.(2011) Blanchard et al.(2013)
number of documents 6,085 154,702 12,100
average document length 617 150 348
number of L1s 16 65 11
number of topics variation variation 8
proficiency level inter, high variation low, inter, high
Table 1: Some of the NLI English textual datasets.
• ESSAYTask – the L1 identification is based
solely on the written essays
• SPEECH Task – the L1 identification is
based on the speech utterances (their tran-scripts and/or extracted i-vectors captur-ing the acoustic properties of the recorded speech)
• (Main)FUSIONTask– the NLI system is
al-lowed to use both sources listed above We participated in each track and used only the available labelled data. The data collection con-sists of 13,200 English essays (written texts) and spoken responses (written transcriptions and pre-processed i-vectors) and its pairwise disjoint sub-sets of 11,000 training examples, 1,100 devel-opment test examples, and 1,100 evaluation test examples. Both training and development test sets were provided to the shared task participants, while the evaluation test set was the unseen data portion kept only for the final evaluation per-formed by the organizers. The i-vectors are com-puted from 45-second audio files corresponding to orthographic transcriptions. The results of the NLI Shared Task 2017 are reported in Malmasi et al. (2017).
In the rest of this paper, we first review related works in Section 2. Other works on feature en-gineering inspired us to choose features for our experiments. More details about the features we used are provided in Section 3. Our approach focuses mainly on different machine learning al-gorithms explained in Section 4. We design a two-step procedure consisting of training stand-alone classifiers (see Section 4.1), and training additional parameters of fused models (see Sec-tion 4.2). In total, we submitted three different system architectures described in Section4.3. In Section5we present and discuss our results, and in the last Section 6 we make some final com-ments.
2 Related work
Text-based NLI has been addressed since 2005 and speech-based NLI since 2016. We give a pic-ture of which results have been produced since the very beginning to date. Given the scope of the NLI Shared Task 2017, we focus on studies having En-glish as a second language.
2.1 Text-based NLI
An exhaustive overview of NLI until 2014 has been provided by Massung and Zhai (2016). In Table 1 we show the basic characteristics of the datasets widely used so far. Now we mention only some works with respect to three milestones. The very beginning Koppel et al. (2005) im-plemented a fully automated method to address text-based NLI for the first time ever. They ex-perimented with the sub-part of the ICLEv2 cor-pus containing only five L1s.2 Their feature set
included relative frequencies of function words, character n-grams, error types and rare POS bi-grams so that each document was represented as a vector of 1,035 features. Their SVM-based method achieved just above 80% accuracy. Seven years later There were three papers alone on text-based NLI at the COLING 2012 confer-ence: Brooke and Hirst (2012) developed a ro-bust model that works with 79.3% accuracy when used across the ICLEv2 and Lang-8 corpora. They extracted a set of 800,000 features,3 which was
extremely large in comparison to the set used by Koppel et al. (2005). They also discuss the inadequacy of ICLEv2 as a training corpus and recommended to pay more attention to the over-all validity of NLI experiments, rather than to
2Bulgarian, Czech, French, Russian, Spanish
specific technical approaches. Bykh and Meur-ers (2012) experimented with ICLEv2 as well but their seven target classes were different from those used in (Brooke and Hirst, 2012). They explored recurring word and POS n-grams and they achieved 89.71% accuracy that was later sur-passed byTetreault et al. (2012) who used (Kop-pel et al., 2005)’s feature set enriched with the Tree Substitution Grammar features (Swanson and Charniak, 2012), the Stanford dependency fea-tures (de Marneffe et al., 2006) and language model perplexity scores to achieve an accuracy of 90.1%.
The TOEFL11 corpus available The First Native Language Identification Shared Task in 2013 (Tetreault et al., 2013) marks an important stage in the text-based NLI research mainly be-cause of making available the TOEFL11 corpus. This corpus consists of essays on eight different topics written by non-native speakers of three pro-ficiency levels (low/medium/high); the essays’ au-thors have 11 different native languages listed in Section 1. The corpus contains 1,100 essays per language with an average of 348 word tokens per essay. A corpus description and the motivation to build such corpus can be found in (Blanchard et al.,2013). The report byTetreault et al.(2013) summarizes the techniques used and the results achieved by the competing teams in the shared task.
TOEFL11 has become a common evaluation re-source for the text-based NLI task. Nicolai et al. (2013) used a subset of the corpus with only five L1s to train probabilistic graphical models.4 Bykh
and Meurers(2014) systematically explored non-lexicalized and non-lexicalized context-free grammar production rules. They combined them with word-based and POS-word-basedn-grams and they achieved accuracy of 84.8%, the best result reported by that time. Later on, Ionescu et al. (2014) obtained a new state-of-the-art result, 85.3% accuracy, so that they combined several string kernels using multi-ple kernel learning to do feature selection. Their method is completely language independent, and texts are treated as a sequence of characters.
Kr´ıˇz et al. (2015) measure similarity between general English and English used by L1 speak-ers using cross-entropy scores, which then serve as features for an SVM classifier. It requires 12 lan-guage models of English – one model of general
4Chinese, French, German, Japanese, and Turkish.
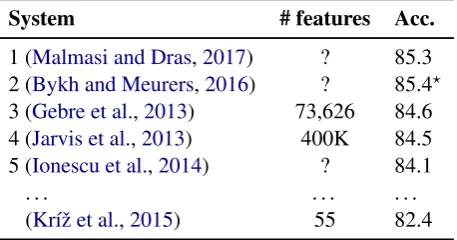
System # features Acc. 1 (Malmasi and Dras,2017) ? 85.3 2 (Bykh and Meurers,2016) ? 85.4? 3 (Gebre et al.,2013) 73,626 84.6 4 (Jarvis et al.,2013) 400K 84.5 5 (Ionescu et al.,2014) ? 84.1
. . . .
[image:3.595.309.538.64.184.2](Kr´ıˇz et al.,2015) 55 82.4
Table 2: Top 5 written NLI systems on TOEFL11, and for comparison the system with the lowest number of (entropy-based) features. A 10-fold cross-validation accuracy is provided (Acc. in %). ?The authors report the 85.4% accuracy on the evaluation test set.
English based on Wikipedia data and eleven spe-cial models, each based on a particular L1 group. The best classification accuracy of 82.4% has been achieved by a combination of language models built upon four different n-gram types -– tokens, characters, suffixes, and POS tags. These 44 (= 4x11) cross-entropy scores completed with other nine numerical and two categorical features result in the final set of 55 features. In fact, this compact feature set comprises a big amount of statistical in-formation about a huge number ofn-grams hidden in the language models consisting of smoothed lin-earn-grams combinations.
In contrast, (Malmasi and Cahill, 2015) ex-tracted a much bigger feature set and they focused on measuring association between two feature sets through classification errors.
The very last work on text-based NLI focuses on systematic examination of ensemble methods for addressing NLI with three L2s, namely En-glish, Norwegian, and Jinan Chinese (Malmasi and Dras,2017).
Table 2presents the top 5 text-based NLI sys-tems on TOEFL11. We also provide the same fig-ures for the system (Kr´ıˇz et al.,2015) with an ex-tremely low number of features. Here is a brief de-scription of the algorithms and the features used:
• (Malmasi and Dras, 2017) – ensemble clas-sifier, bagging, linear discriminant analysis;
n-grams of lemmas, words, function words, POS tags, dependencies, CFG rules, Adaptor Grammar, TSG fragments
where1 ≤ n ≤ 10, dependencies, suffixes, verb subcategorization patterns
• (Gebre et al., 2013) – SVM; tf-idf of word unigrams and bigrams, df ≥ 5, normalized feature vectors
• (Jarvis et al., 2013) – SVM; {1,2,3}-grams of words, lemmas, POS tags, df≥2, normal-ized feature vectors
• (Ionescu et al.,2014) – Kernel-based learn-ing; character{5-8}-grams
• (Kr´ıˇz et al., 2015) – SVM; entropy-based features using language modeling (tokens, characters, POS, suffixes)
Malmasi et al. (2016) analyze the results of the Discriminating between Similar Languages
shared task and they state that numerous teams attempted to use new deep learning-based ap-proaches, and that most of them ended with a poor performance compared to traditional classi-fiers. To the best of our knowledge, there has been no published paper on using deep learning in text-based NLI yet. We can only speculate that re-searchers have already applied deep learning tech-niques to text-based NLI but they did not beat tra-ditional classifiers.
2.2 Speech-based NLI
The speech-based NLI shared task was orga-nized under the name Native Language Sub-challenge as one of the subtasks of the IN-TERSPEECH 2016 Computational Paralinguistics Challenge (Schuller et al.,2016).
The ETS Corpus of Non-native Spoken English was provided for the task consisting of 5,132 ex-amples in total – 3,300 exex-amples were selected for training, 965 examples for the development test set, and 867 examples for the evaluation test set. The corpus includes spoken responses from non-native speakers of English drawn from 11 dif-ferent L1 backgrounds that are identical to the TOEFL11 L1s. The recorded utterances are 45-second long for each speaker. The participants were provided with the audio files (amplitude nor-malized) and were also pointed to the toolkit that was used to extract the audio features for the base-line system provided by the sub-challenge orga-nizers. It is obvious that the extracted features did not reflect only the actual content of the utterances but also – and possibly more prominently – the
System UAR (%)
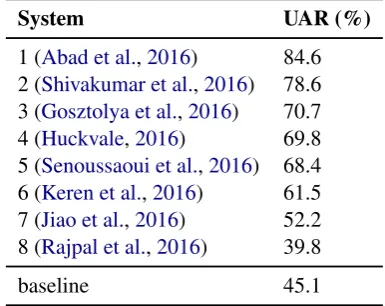
1 (Abad et al.,2016) 84.6 2 (Shivakumar et al.,2016) 78.6 3 (Gosztolya et al.,2016) 70.7 4 (Huckvale,2016) 69.8 5 (Senoussaoui et al.,2016) 68.4 6 (Keren et al.,2016) 61.5 7 (Jiao et al.,2016) 52.2 8 (Rajpal et al.,2016) 39.8
[image:4.595.319.512.64.217.2]baseline 45.1
Table 3: Spoken NLI systems submitted to the 2016 NLI shared task. UAR stands for Un-weighted Average Recall.
acoustic properties of the speech that are suppos-edly and significantly influenced by the speaker’s native language. Given the usual background of the INTERSPEECH attendees, it is only natural that most participants of the sub-challenge had a strong background in speech signal processing and (at least the top teams) concentrated on their own sophisticated methods for feature extraction.
According to our knowledge, no transcriptions of the recorded utterances were provided and none of the participants attempted to use an automatic speech recognition system in order to create tran-scripts that could be used as the source of textual features. Given the poor performance of the sys-tem based solely on the (manual) speech transcrip-tions in the NLI Shared Task 2017, it seems that ignoring the textual content of the utterances was a wise decision.
Table 3 presents the systems submitted to the sub-challenge. Since the top two teams, whose systems outperformed the rest by a large margin, employed the i-vector feature representation, the organizers have decided to provide the i-vectors directly to the NLI Shared Task 2017 participants, supposedly in order to lower the entry thresh-old for participants without the speech processing background. A short high-level description of the i-vector principles is given in Section3.
3 Feature extraction
features that have been proven to be effective in the experiments performed by other researchers previously, being mostly inspired byGebre et al. (2013). We have employed n-grams of various lengths from the following “data streams”:
• Word unigrams, bigrams and trigrams ex-tracted from both essays and speech tran-scriptions.
• Character n-grams withnranging from 3 to 5, extracted from the essays only.
• POS n-grams withnranging from 1 to 5, also extracted only from the essays.
All features were weighted using the well-knowntf-idfweighting scheme, with the sublinear
tf scaling and the standard idf, that is, the weight
wof each featureiin the documentjis given by:
wi,j = (1 + log(tfi,j))·logNn
i (1) where N denotes the total number of documents and ni the number of documents containing the feature i. Then the resulting feature vectors are normalized to unit length. Quick experiments on the development data have shown that:
• Sublinear tf scaling substantially outper-forms the unscaledtf.
• The number of n-gram based-features used in the classification can be reduced to top 30,000 features (ordered by decreasing tf) without hurting the performance.5 The
fea-ture vector dimension was thus limited to 30k for all textual features described above. Speech features Here we did not have any other choice than using the i-vectors provided by the Shared Task organizers. The i-vectors were orig-inally developed as a representation of speech ut-terances in a low-dimensional subspace, which ef-ficiently conveys speaker’s “vocal” characteristics and is therefore suitable for speaker recognition (Dehak et al.,2011). The i-vectors of course con-tain also the information about the acoustic envi-ronment, transmission channel or phonetic content of the utterance. Intuitively, the phonetic content appears to be an important factor distinguishing 5Note that the total number of features would exceed 2.5 million in the case of word trigrams.
the L1 of the speaker as the native language nat-urally influences the way the speaker pronounces English phonemes. The i-vectors were extracted from the 45-second audio files by the task orga-nizers, employing a state-of-the-art approach and using the Kaldi6 toolkit. The dimension of the
i-vectors is 800, reduced by factor analysis from su-pervector of statistics accumulated on the univer-sal background model with 1,024 components.
Several experiments (and the description of the the state-of-the-art NLI in (Malmasi and Dras, 2017)) confirmed our intuition that simply con-catenating the individual feature vectors and train-ing a strain-ingle classifier does not yield the best re-sults. We therefore concentrated mainly on the velopment of the fused (ensemble) classifiers, de-scribed in details in the following section.
Finally, let us point out that we have decided not to use the character and POS n-grams from the speech transcription data in our final systems. The reason is the fact that 1) word n-grams are by far the best performing textual features, yet their per-formance was rather poor on the speech transcrip-tions, and 2) any performance gain from charac-ter and POS n-grams was clearly overshadowed by the i-vectors contribution in both speech and fusion tasks.
4 Prediction model
We used multiple supervised models to process each type of input features. Then, we fused the predictions of such models, i.e. we combined the
outputsof the classifiers instead of combining the input features and training one joint model. This approach consists of two steps: (1) training the stand-alone classifiers, and (2) training the addi-tional parameters of the fused model. Opaddi-tionally, the step (2) could employ additional retraining of the stand-alone classifiers.
4.1 Stand-alone classifiers
The term “stand-alone classifiers” is herein used for the systems whose internal parameters are trained with a standard supervised machine learn-ing algorithm (e.g., gradient descent) and which take the input feature vector and output a vector of|C|probabilities. The decision about the class membership is then determined solely by the index of the maximum value of such output vector.
Linear models To perform the classification us-ing textual features, we widely used linear mod-els. The training procedure of such model var-ied – we experimented with a linear SVM and stochastic gradient descent training implemented using the LinearSVC and SGDClassifier
classes from the scikit-learn toolkit (Pedregosa et al.,2011). Both implementations support sparse feature representation and therefore in our experi-ments the full feature vector could be used.
Non-linear models We also used non-linear models implemented as feed-forward neural net-works (FFNN) containing hidden layers with non-linear functions. In our experiments we also tried the very deep architectures such as ResNets and DenseNets, but they were outperformed by a rel-atively simple FFNN with one hidden layer. This is probably caused by a relatively low number of training examples and a high number of parame-ters of deeper networks. The FFNNs were used to classify both textual and speech-related features. The size of the textual feature vectors was reduced to 30k as explained in Section 3. The FFNNs were implemented in the Keras system (Chollet et al., 2015). To optimize the FFNNs, we used the ADAM algorithm (Kingma,2015) with a cat-egorical cross-entropy loss.
Probabilistic Linear Discriminant Analysis (PLDA) is a state-of-the-art system for i-vector based speaker verification (Kenny,2005) and can by easily used for representation of another infor-mation, the L1 in our case. I-vectors also con-tain some noisy information not relevant to the L1 identity (e.g. influence of the channel, speaker etc.). If structured training data (more than one session for each L1) are available, PLDA can be trained to model L1 and session variability sepa-rately. Then, only the L1 domain is used for iden-tification. Moreover, the PLDA model itself can be used as a powerful tool for compute the simi-larity between two i-vectors (only in L1 domain). In our case, the test i-vector is compared to |C| L1 i-vectors representing the models of particu-lar L1 languages. The simiparticu-larities are normalized to sum up to one. The L1 i-vector is computed as the mean of all i-vectors belonging to a given class. The PLDA classifier was used to classify i-vector features in theensemblesystems used in the SPEECHand FUSIONtasks.
4.2 Model combinations
To combine the outputs of the stand-alone clas-sifiers, we experimented with three different schemas: (1) discriminative logistic regression, (2) softmax combination of hidden layer’s outputs, and (3) softmax combination of classifier’s out-puts. Since the development data set provides an additional valuable source of labelled data, special attention has to be paid to the correct estimation of the fusion parameters, as described below.
Discriminative logistic regression for fusing system’s outputs was implemented using an open-sourceFoCal Multi-class toolkit(Br¨ummer, 2007). This MATLAB toolkit allows evaluation, calibration and fusion of, and decision-making with, multi-class statistical pattern recognition scores. This toolkit is different from, but similar in design principles to the original FoCal Toolkit that was used by several NIST Speaker Recogni-tion EvaluaRecogni-tion 2006 participants to fuse and cali-brate their scores (Br¨ummer et al.,2007). For the fusion we used the tool based on calibration and discriminative logistic regression ofKclassifiers
ˆ
y(x) =XK k=1
αkyk(x) +β, (2)
whereyk(x)∈ <|C|is a vector of posterior proba-bilities obtained fromk-classifier,yˆ(x)is a vector of fused probabilities and vectors α ∈ <K and
β ∈ <|C| are parameters of the fusion. These
parameters were first estimated on the held-out data (data not used to train the stand-alone classi-fiers), then the classifiers were retrained to employ all available labelled data (train and development) and the previously estimated vectorsαandβwere used.
Softmax combination The softmax combina-tion is implemented as a neural network without hidden layers. The vector of fused probabilities
ˆ
y(x)is given by:
a(x) =W ·
y1(x) ...
yK(x)
+b (3)
ˆ
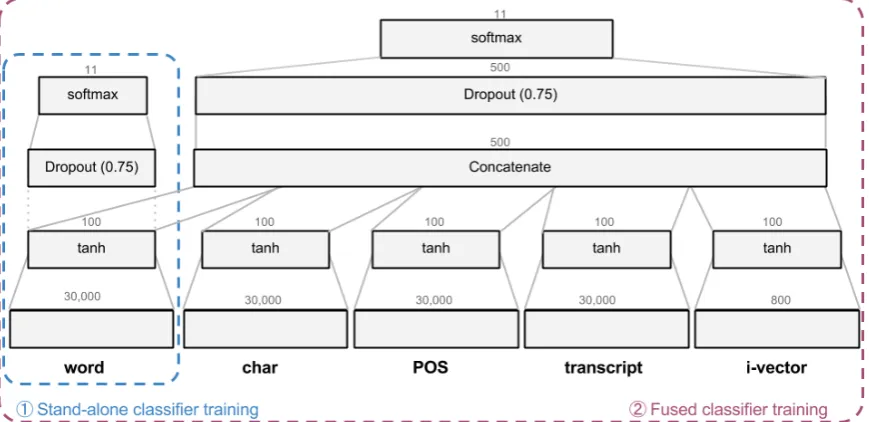
Figure 1: Architecture of thehomogeneousneural network for the FUSIONtask.
the ADAM algorithm and the categorical cross-entropy loss. We experimented with two different choices ofyk:
• The output of the hidden layer from the FFNN corresponding to a specific feature set. In this case, we merged the trained stand-alone FFNNs to form a fused FFNN ac-cording to Figure 1 and the parameters of the stand-alone FFNNs were trained using the back-propagation errors. The stand-alone FFNNs and the fused FFNN were trained on the union of train and development datasets. • The |C|-dimensional output of the
stand-alone classifier. For the linear models the out-put consists of the values of decision func-tions, for the FFNN such output is the po-tential of the output layer before applying the softmax activation. In this case, we first trained the stand-alone classifiers on the train dataset, and then we trained just the fu-sion parametersW andbon the development dataset.
4.3 Submitted systems
Based on the experiments with the development data set, we finally decided to submit three dif-ferent system architectures. Each architecture is a combination of multiple systems trained on differ-ent features, even in the ESSAYand SPEECHtasks. • Classical model ensemble(“ensemble”) con-sists of different stand-alone models trained
separately and combined using the discrimi-native logistic regression.
• Homogeneous FFNN(“homogeneous”) uses a set of stand-alone FFNNs trained sepa-rately. The number of hidden layers, num-ber of neurons in hidden layers, and activa-tion funcactiva-tions are identical for each stand-alone FFNN. The outputs of hidden layers in the trained FFNNs are combined using soft-max combination. The resulting network is retrained. To avoid overfitting, we used the dropout layer before the softmax layer. • Heterogeneous FFNN (“heterogeneous”)
employs a set of FFNNs with different architectures. The stand-alone classifiers are trained separately using different objec-tives. The|C|-dimensional outputs are then combined using softmax combination. The resulting network is not retrained during estimating the softmax weights and biases.
For different tasks we used the following different sets of features and classifiers:
ESSAY task – the ensemble system used
word, char and POS features and FFNN and
SGDClassifiermodels for each feature set (= 3×2stand-alone models). Thehomogeneous sys-tem used word, char and POS features and FFNN with 1 hidden layer containing 100 neurons. The
heterogeneoussystem used the same features and
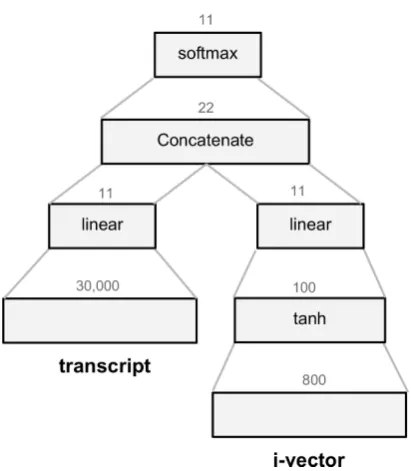
Figure 2: Architecture of theheterogeneousneural network for the SPEECHtask.
SPEECH task – the ensemble system used
FFNN classifiers trained on word and char features extracted from transcripts and PLDA and FFNN trained from i-vectors. Thehomogeneoussystem used word features from transcripts and i-vectors and FFNN (1 hidden layer, 100 neurons). The het-erogeneous system containedSGDClassifier
trained from transcript word features and FFNN (1 hidden layer, 100 neurons) trained on i-vectors (see Figure2).
FUSIONtask – for each system we used a
com-bination of the stand-alone classifiers used in the ESSAYand SPEECHtasks. An example of such a
combination for thehomogeneoussystem is given in Figure1.
5 Results and discussion
The final results of the submitted systems mea-sured on the unseen evaluation test set are shown in Table4. In this paper, all F1 values are macro-averaged over all 11 output classes. It should be noted that the relatively low number of test exam-ples combined with a higher number of classes re-sulted in quite wide confidence intervals. For ex-ample, we evaluated the F1 measure for the ho-mogeneous system on the FUSION task. Using
the development data set and a bootstrapping ap-proach with 550 samples and 1,000 repetitions we found that the resulting average F1 0.9112 has as-sociated a 95 % confidence interval of <0.8850;
Task System F1 ensemble 0.8536 ESSAY homogeneous 0.8491
heterogeneous 0.8464 ensemble 0.8570 SPEECH homogeneous 0.7987
heterogeneous 0.8607 ensemble 0.9238 FUSION homogeneous 0.9257
heterogeneous 0.9244
Table 4: Summary of the results for each task and our three architectures. The macro-averaged F1 value was measured on the unseen evaluation test set by the shared task organizers.
Figure 3: Confusion matrix for the FUSION task,
homogeneous system. Measured on the unseen evaluation test set.
0.9345> (!). Even the variations caused by the random seed selection are noticeable: for ten dif-ferent seeds the F1 value varies between 0.9075 and 0.9166. For proper perspective, it is important to keep in mind that the difference of 0.001 in F1 evaluated on test data means that the systems mis-match in approximately 1 correctly classified test example.
Table 4 also shows another interesting fact that the F1 value in the SPEECH task is higher
than in the ESSAY task. We assume this is
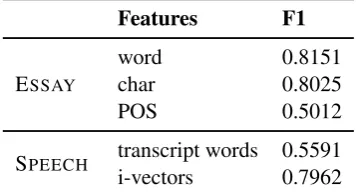
[image:8.595.333.500.63.222.2] [image:8.595.310.523.300.485.2]achieved an F1 value of only 0.8080, while the classifier trained solely on transcribed text fea-tures achieved only 0.5787. In this case, the combination of a relatively weak predictor with a strong model further improved the performance to 0.8610. We also observed that training classifiers on the union of the training and development data sets consistently improves performance – the in-crease in the F1 value (evaluated on the unseen test data) is approximately 0.004. To illustrate the performance on different feature types, we eval-uated the stand-alone classifiers of the homoge-neous system trained for the FUSION task on the
development data. The results are summarized in Table5.
We also used the Local Interpretable Model-agnostic Explanations (LIME) method (Ribeiro et al., 2016) to extract the most informative fea-tures for a given L1 class. The results showed that just the presence of certain words very of-ten leaks significant information about the L1 lan-guage (this effect was already observed by (Ge-bre et al.,2013)) – for example essays labelled as JPN contain words Japan, Japanese, KOR men-tion KoreaandKorean. Also, there are some ty-pos that have origin in the L1 language (e.g., ITA:
pubblicfrom Italianpubblico– 52 examples in the training data, FRE:exemplefrom Frenchexemple
– 174 examples). The confusion matrix in Fig-ure3shows that 40 % of all errors are confusions between the HIN and TEL classes. This is proba-bly caused by the fact that the L1 speakers of these languages have gone through the same educational system of India. In addition, the geographic refer-ences mentioned above do not allow to discrimi-nate between them. During the system develop-ment, we also experimented with the advanced architectures of neural networks, such as convo-lutional networks, recurrent networks, ResNets, DenseNets and pretrained word embeddings but none of them performed better than the linear SVM baseline.
6 Conclusion
Malmasi et al. (2015b) previously showed that even NLI systems working with just written es-says can outperform human decisions. Our exper-iments revealed that adding information extracted from the spoken responses of non-native English speakers results into a substantial improvement in
Features F1
word 0.8151
ESSAY char 0.8025
POS 0.5012
SPEECH transcript words 0.5591
[image:9.595.327.506.64.160.2]i-vectors 0.7962
Table 5: Performance of five stand-alone classi-fiers used in the homogeneous FUSION system
measured on the development test set. The stand-alone classifiers are FFNNs, 1 hidden layer with 100 neurons. In the FUSIONmodel they were
fur-ther trained by the softmax combination training.
classification performance (about 5 % relative7). It
corroborates our initial intuition that the textual and spoken data really complement well as the source of information about the L1 language.
To sum up our results measured on the un-seen evaluation test set, we attained the following macro-averaged F1 scores:
• ESSAYtask: 0.8536
– shared second place in the task, • SPEECHtask: 0.8607
– shared first place in the task, • mainFUSIONtask: 0.9257
– shared first place in the task.
Let us stress out that those results were achieved by rather straightforward (yet at the same time in-formed and careful) application of state-of-the-art machine learning algorithms, using feature extrac-tion methods that have already been proven effi-cient both in previous NLI shared tasks and in our NLP and speech processing research.
7 Acknowledgements
We really appreciate the hard work done by the organizers. They prepared the high-quality data that motivated the participants to work on an in-teresting project. This research was supported by the Grant Agency of the Czech Republic, projects No. GA ˇCR GBP103/12/G084 and ID 16-10185S, and by the Charles University project No. SVV 260 333.
References
Alberto Abad, Eug´enio Ribeiro, F´abio Kepler, Ramon Astudillo, and Isabel Trancoso. 2016. Exploiting Phone Log-Likelihood Ratio Features for the Detec-tion of the Native Language of Non-Native English Speakers. InInterspeech 2016. pages 2413–2417.
Daniel Blanchard, Joel Tetreault, Derrick Hig-gins, Aoife Cahill, and Martin Chodorow. 2013. TOEFL11: A Corpus of Non-Native English. ETS Research Report Series2013(2):i–15.
Julian Brooke and Graeme Hirst. 2012. Robust, Lexi-calized Native Language Identification. In Proceed-ings of COLING 2012. Mumbai, India, pages 391– 408.
Niko Br¨ummer. 2007. Focal Multi-Class: Toolkit for Evaluation, Fusion and Calibration of Multi-Class Recognition Scores. InSpescom DataVoice.
Niko Br¨ummer, Luk´aˇs Burget, Jan ˇCernock´y, Ondˇrej Glembek, Frantiˇsek Gr´ezl, Martin Karafi´at, David Leeuwen van, Pavel Matˇejka, Petr Schwarz, and Albert Strasheim. 2007. Fusion of hetero-geneous speaker recognition systems in the stbu submission for the nist speaker recognition evalu-ation 2006. IEEE Transactions on Audio, Speech, and Language Processing15(7):2072–2084.
Serhiy Bykh and Detmar Meurers. 2012. Native Lan-guage Identification using Recurringn-grams – In-vestigating Abstraction and Domain Dependence. In Proceedings of COLING 2012. Mumbai, India, pages 425–440.
Serhiy Bykh and Detmar Meurers. 2014. Exploring Syntactic Features for Native Language Identifica-tion: A Variationist Perspective on Feature Encod-ing and Ensemble Optimization. InProceedings of COLING 2014: Technical Papers. Dublin City Uni-versity and ACL, Dublin, Ireland, pages 1962–1973.
Serhiy Bykh and Detmar Meurers. 2016. Advancing Linguistic Features and Insights by Label-informed Feature Grouping: An Exploration in the Context of Native Language Identification. InProceedings of COLING 2016, the 26th International Conference on Computational Linguistics: Technical Papers. The COLING 2016 Organizing Committee, Osaka, Japan, pages 739–749.
Franc¸ois Chollet et al. 2015. Keras. https:// github.com/fchollet/keras.
Marie-Catherine de Marneffe, Bill MacCartney, and Christopher D. Manning. 2006. Generating Typed Dependency Parses from Phrase Structure Parses. In
Proceedings of the Fifth International Conference on Language Resources and Evaluation. pages 449– 454.
Najim Dehak, Patrick J Kenny, R´eda Dehak, Pierre Du-mouchel, and Pierre Ouellet. 2011. Front-End Fac-tor Analysis for Speaker Verification. IEEE Trans-actions on Audio, Speech, and Language Processing
19(4):788–798.
Binyam Gebrekidan Gebre, Marcos Zampieri, Peter Wittenburg, and Tom Heskes. 2013. Improving Na-tive Language Identification with TF-IDF Weight-ing. InProceedings of the Eighth Workshop on In-novative Use of NLP for Building Educational Ap-plications. ACL, Atlanta, Georgia, pages 216–223. G´abor Gosztolya, Tam´as Gr´osz, R´obert Busa-Fekete,
and L´aszl´o T´oth. 2016. Determining Native Lan-guage and Deception Using Phonetic Features and Classifier Combination. InInterspeech 2016. pages 2418–2422.
Sylviane Granger, Estelle Dagneaux, Fanny Meu-nier, and Magali Paquot. 2009. International Corpus of Learner English v2 (Handbook + CD-ROM). Presses universitaires de Louvain, Louvain-la-Neuve.
Oren Halvani, Christian Winter, and Anika Pflug. 2016. Authorship Verification for Different Languages, Genres and Topics. Digital Investigation 16, Sup-plement:S33 – S43. {DFRWS} 2016 EuropePro-ceedings of the Third Annual{DFRWS}Europe. Mark Huckvale. 2016. Within-Speaker Features for
Native Language Recognition in the Interspeech 2016 Computational Paralinguistics Challenge. In
Interspeech 2016. pages 2403–2407.
Radu Tudor Ionescu, Marius Popescu, and Aoife Cahill. 2014. Can Characters Reveal Your Native Language? A Language-Independent Approach to Native Language Identification. InProceedings of the 2014 Conference on EMNLP. ACL, Doha, Qatar, pages 1363–1373.
Scott Jarvis, Yves Bestgen, and Steve Pepper. 2013. Maximizing Classification Accuracy in Native Lan-guage Identification. InProceedings of the Eighth Workshop on Innovative Use of NLP for Building Educational Applications. ACL, Atlanta, Georgia, pages 111–118.
Scott Jarvis and Magali Paquot. 2012. Exploring the Role ofn-grams in L1 Identification. In Scott Jarvis and Scott A. Crossley, editors, Approaching Trans-fer through Text Classification: Explorations in the Detection-based Approach, Bristol, UK: Multilin-gual Matters, pages 71—-105.
Yishan Jiao, Ming Tu, Visar Berisha, and Julie Liss. 2016. Accent Identification by Combining Deep Neural Networks and Recurrent Neural Networks Trained on Long and Short Term Features. In In-terspeech 2016. pages 2388–2392.
Gil Keren, Jun Deng, Jouni Pohjalainen, and Bj¨orn Schuller. 2016. Convolutional Neural Networks with Data Augmentation for Classifying Speakers’ Native Language. InInterspeech 2016. pages 2393– 2397.
Diederik P Kingma. 2015. ADAM: A Method for Stochastic Optimization pages 1–15.
Moshe Koppel, Jonathan Schler, and Kfir Zigdon. 2005. Determining an Author’s Native Language by Mining a Text for Errors. InProceedings of the Eleventh ACM SIGKDD International Conference on Knowledge Discovery in Data Mining. ACM, New York, NY, USA, KDD ’05, pages 624–628.
Vincent Kr´ıˇz, Martin Holub, and Pavel Pecina. 2015. Feature Extraction for Native Language Identifica-tion Using Language Modeling. In Galia Angelova, Kalina Boncheva, and Ruslan Mitkov, editors, Pro-ceedings of Recent Advances in Natural Language Processing. Hisarja, Bulgaria, pages 298–306.
Shervin Malmasi and Aoife Cahill. 2015. Measuring Feature Diversity in Native Language Identification. InProceedings of the Tenth Workshop on Innovative Use of NLP for Building Educational Applications. ACL, Denver, Colorado, pages 49–55.
Shervin Malmasi and Mark Dras. 2014a. Chinese Na-tive Language Identification. InProceedings of the EACL-14. ACL, Gothenburg, Sweden, pages 95–99.
Shervin Malmasi and Mark Dras. 2014b. Finnish Na-tive Language Identification. In Proceedings of the Australasian Language Technology Workshop (ALTA). Melbourne, Australia, pages 139–144.
Shervin Malmasi and Mark Dras. 2017. Native Lan-guage Identification using Stacked Generalization.
CoRRabs/1703.06541.
Shervin Malmasi, Mark Dras, and Irina Temnikova. 2015a. Norwegian Native Language Identification. InProceedings of RANLP 2015. ACL, Hissar, Bul-garia, pages 404–412.
Shervin Malmasi, Keelan Evanini, Aoife Cahill, Joel Tetreault, Robert Pugh, Christopher Hamill, Diane Napolitano, and Yao Qian. 2017. A Report on the 2017 Native Language Identification Shared Task. In Proceedings of the 12th Workshop on Building Educational Applications Using NLP. Association for Computational Linguistics, Copenhagen, Den-mark.
Shervin Malmasi, Joel Tetreault, and Mark Dras. 2015b. Oracle and Human Baselines for Na-tive Language Identification. In Proceedings of the Tenth Workshop on Innovative Use of NLP for Building Educational Applications. Association for Computational Linguistics, Denver, Colorado, pages 172–178.
Shervin Malmasi, Marcos Zampieri, Nikola Ljubeˇsi´c, Preslav Nakov, Ahmed Ali, and J¨org Tiedemann. 2016. Discriminating between Similar Languages and Arabic Dialect Identification: A Report on the Third DSL Shared Task. InProceedings of the Third Workshop on NLP for Similar Languages, Varieties and Dialects (VarDial3). The COLING 2016 Orga-nizing Committee, Osaka, Japan, pages 1–14. Sean Massung and ChengXiang Zhai. 2016.
Non-Native Text Analysis: A Survey. Natural Language Engineering22(2):163–186.
Tomoya Mizumoto, Mamoru Komachi, and Masaaki Nagata. 2011. Mining Revision Log of Language Learning SNS for Automated Japanese Error Cor-rection of Second Language Learners. In In Pro-ceedings of the Fifth International Joint Conference on Natural Language Processing. pages 147–155. Garrett Nicolai, Md Asadul Islam, and Russ Greiner.
2013. Native Language Identification Using Proba-bilistic Graphical Models. InInternational Confer-ence on Electrical Information and Communication Technology (EICT). Khulna, Bangladesh, pages 0–1. Lourdes Ortega. 2009. Understanding Second Lan-guage Acquisition / Rod Ellis. Hodder Education, Oxford, UK.
F. Pedregosa, G. Varoquaux, A. Gramfort, V. Michel, B. Thirion, O. Grisel, M. Blondel, P. Pretten-hofer, R. Weiss, V. Dubourg, J. Vanderplas, A. Pas-sos, D. Cournapeau, M. Brucher, M. Perrot, and E. Duchesnay. 2011. Scikit-learn: Machine learning in Python. Journal of Machine Learning Research
12:2825–2830.
Avni Rajpal, Tanvina B. Patel, Hardik B. Sailor, Maulik C. Madhavi, Hemant A. Patil, and Hiroya Fujisaki. 2016. Native Language Identification Us-ing Spectral and Source-Based Features. In Inter-speech 2016. pages 2383–2387.
Francisco Rangel, Paolo Rosso, Moshe Moshe Kop-pel, Efstathios Stamatatos, and Giacomo Inches. 2013. Overview of the Author Profiling Task at PAN 2013. In CLEF Conference on Multilin-gual and Multimodal Information Access Evalua-tion. CELCT, pages 352–365.
Marco Tulio Ribeiro, Sameer Singh, and Carlos Guestrin. 2016. ”Why Should I Trust You?”: Ex-plaining the Predictions of Any Classifier. In Pro-ceedings of the 22Nd ACM SIGKDD International Conference on Knowledge Discovery and Data Min-ing. ACM, New York, NY, USA, KDD ’16, pages 1135–1144.
Mohammed Senoussaoui, Patrick Cardinal, Najim De-hak, and Alessandro L. Koerich. 2016. Native Lan-guage Detection Using the I-Vector Framework. In
Interspeech 2016. pages 2398–2402.
Prashanth Gurunath Shivakumar, Sandeep Nallan Chakravarthula, and Panayiotis Georgiou. 2016. Multimodal Fusion of Multirate Acoustic, Prosodic, and Lexical Speaker Characteristics for Native Lan-guage Identification. In Interspeech 2016. pages 2408–2412.
Ben Swanson and Eugene Charniak. 2012. Native Lan-guage Detection with Tree Substitution Grammars. In Proceedings of the 50th Annual Meeting of the Association for Computational Linguistics: Short Papers - Volume 2. Association for Computational Linguistics, Stroudsburg, PA, USA, ACL ’12, pages 193–197.
Joel Tetreault, Daniel Blanchard, and Aoife Cahill. 2013. A Report on the First Native Language Iden-tification Shared Task. InProceedings of the Eighth Workshop on Innovative Use of NLP for Building Educational Applications. ACL, Atlanta, Georgia, pages 48–57.