Sven Müller PhD, Steen H. Matthiesen PhD and Kirsten V. Nielsen MS
tumor tissue analysis by fluorescence in situ hybridization (FISH) is a well-established method for identification of genetic aberrations like gene copy number changes and translocations. the method has been used as a research tool for more than 20 years and due to the prognostic and predictive value of some FISH markers, e.g.
TOP2A and HER2, the method has been implemented in the clinic. In clinical pathology, the quantitative nature of analysis results has made FISH an attractive supplement or alternative to IHC-based analysis. although promising substitutes have been identified (1, 2), tissue preservation practice is still largely dominated by the classic method of fixation in neutral-buffered formalin, followed by paraffin embedding (FFPe). the FFPe tissue preservation method is fully compatible with FISH, but technically valid FISH results require that tissue preparation match the fixation history of the individual tissue sample. this article focuses on preparation of FFPe tissue slides for FISH analysis and how sub-optimal stains can be identified.
Composition of a Solid Tumor FISH Probe
Mixture
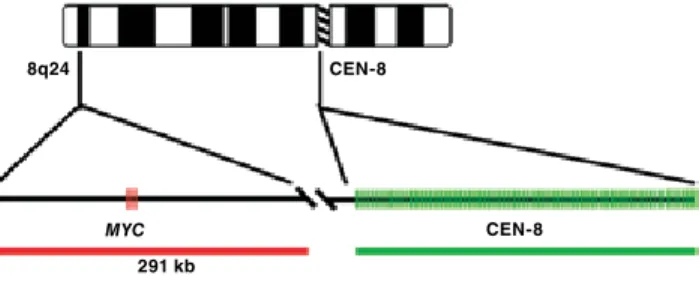
the optimal composition of a FISH probe mixture for detection of changes in gene copy number in solid tumors includes two labeled probes. one probe directed towards the gene of interest and one probe directed towards a reference sequence for the chromosome on which the target gene is located. traditionally, the reference probes are directed towards the non-coding centromere sequences.
8q24 CEN-8
MYC 291 kb
CEN-8
Figure 1. Example of a FISH probe mixture. A 291 kb long Texas Red-labeled
gene-directed probes are based on genomic clones — typically CoS or BaC clones — and cover the genomic area where the coding sequences of the gene of interest are located. Labeling of the genomic clones, e.g. by nick translation, includes labeling of introns and gene flanking sequences. thereby the repetitive sequences interspersed in the human genome are labeled as well. the resulting unspecific staining can be blocked by addition of unlabeled competitive sequences. the first consistently efficient blocker identified was the Cot-1 dna fraction (3). It has, subsequently, been demonstrated that a mixture of unlabeled peptide nucleic acid (Pna) oligonucleotides directed towards the dominating alu repeat sequences is comparable to or better than Cot-1 dna fraction for blocking (4).
Tissue Sample Preparation
Specimens from biopsies, excisions or resections must be handled as soon as possible to preserve the tissue for FISH. Specimens should be preserved in 10% neutral-buffered formalin (nBF), preferably as 3-4 mm blocks fixed for 18-24 hours followed by dehydration and embedment in paraffin. Sections should be cut into 4-6 µm, mounted on positively charged slides (e.g. SuperFrost Plus, Mentel-gläser, thermo Scientific) and adhered to the slide by baking at 60°C for approximately 1 hour.
Fixation in formalin is suitable because the induced protein-protein and protein-nucleic acid cross-links preserve the tissue efficiently while retaining morphology relatively intact. However, the macromolecular network introduced by formalin significantly reduces the access of FISH probes to target dna. Consequently, the initial steps in a FISH staining must address suitable breakdown of this network.
FFPE Slide Preparation
Deparaffinization
the need for deparaffinization of FFPe slides for FISH analysis does not differ from standard preparation of slides for histological staining methods like H&e, special stains or IHC. Following mounting by
Pre-treatment
the aim of pre-treatment is to ease the subsequent protease digestion by breaking the formalin-induced disulphide bonds (6). Correct pre-treatment, therefore, has a huge impact on final FISH staining quality. Inadequate pre-treatment results in increased autofluorescence level due to intact proteins and ultimately reduced FISH probe signal intensity, whereas excessive pre-treatment distorts tissue morphology. It is important to adjust pre-treatment methods to tissues that have been fixed in weaker fixatives than nBF, otherwise pre-treatment may induce significant harm to the nuclear membrane. degraded nuclear membranes will show as a blurred membrane demarcation (Figure 3.d). degradation of the nuclear membrane and areas close to the membrane may reduce the presence of the non-coding (centromere) reference target sequences as non-coding sequences have a preference for localization at the nuclear envelope (7). Some of the more intense pre-treatment methods combine incubation in acidic solution (e.g. HCl) with exposure to chaotropic agents (e.g. sodium thiocyanate). a pre-treatment which can be harsh for both morphology and tissue slide attachment. However, very efficient results can be obtained solely by incubation in 2-(n-morpholino) ethanesulfonic acid (MeS) at 95-99 °C for 10 minutes. the MeS-based pre-treatment is relatively tolerant to variations in nBF fixation times, but in order for this simple approach to bring consistent results, it is crucial that incubation is performed at no less than 95 °C.
Enzymatic digestion
Proper protease digestion is by far the most decisive step in order to obtain technically valid FISH results. the breaking of peptide bindings by protease digestion directly affects signal quality as it eases access of the FISH probes to the genomic target dna and reduces autofluorescence generated by intact proteins. Some protocols are based on enzymatic digestion by the very active serine protease, proteinase K, but gentler and still adequate digestion can be achieved by use of a carboxyl protease called pepsin.
enzymatic digestion time must be adapted to the tissue fixation time. For tissues that have been fixed in nBF for 6-72 hours, the enzymatic digestion time can be between 30 seconds and 12 minutes at 37 °C using dako Ready-to-Use Pepsin. the digestion can also be performed at room temperature (20-25 °C), but will require 3-4 times longer incubation time.
In general terms, longer fixation time requires longer enzymatic digestion time. typically, 2-3 minutes at 37 °C will be an optimal enzymatic digestion time for the majority of routine FFPe samples fixed in nFB for 12- 24 hours. However, present hospital routines, in accordance with which fixation time can vary significantly or even be unknown to the FISH laboratory, present a challenge for proper digestion. It is important that the FISH laboratory recognizes when a sample is unsuitable for analysis and accordingly reprocess the sample using a digestion intensity-adapted protocol.
Identification of Sub-optimal Digestion
to verify the digestion quality of a stained slide several evaluation parameters must be examined, the most important being inspection of:
autofluorescence level daPI staining pattern Signal distribution
Autofluorescence
Heavily under-digested samples may be identified by inspection of the sample in the relevant double filter (e.g. texas Red/FItC), see Figure 2.a. Under-digested samples are often characterized by apparent green autofluorescence in the cytosol as well as the extracellular matrix (Figure 2.a and C).
When under-digestion is pronounced, probe hybridization is hampered by the high presence of proteins and peptide chains. this reduces signal intensity as a consequence of the higher autofluorescence and lower probe hybridization, thereby reducing the signal to noise ratio. the use of labeled Pna oligos or dna as reference probes towards highly repetitive sequences (e.g. centromeric sequences) may result in the presence of green signals despite sub-optimal (under-) digestion of the sample (Figure 2.a).
FISH stains with under-digestion of tissue can be recognized due to autofluorescence in the cytosol and extracellular matrix and potential lack or reduced presence and intensity of red signals from the gene of interest (single locus).
In properly digested cells, the autofluorescence is mainly restricted to the nuclei, and the level does not disturb red and green signals (Figure 2.e). Visual inspection of autofluorescence level may help identify under-digested samples, but for over-digested samples the autofluorescence level does not differentiate properly-digested samples from over-digested samples.
DAPI staining pattern
daPI (4’,-6-diamidino-2-phenylindole) forms fluorescent complexes with double-stranded dna and this ability makes it possible to use the daPI staining pattern as a tool to evaluate digestion status. Insufficient enzymatic digestion impedes the dna daPI complex formation and makes the nuclei staining appear heterogeneous. this is seen when the staining pattern of an optimally digested sample (Figure 3.a) is compared to an under-digested sample (Figure 3.B). over-digestion can also be seen in the daPI staining pattern as doughnut formation or damaged nuclei membranes (Figure 3.C and Figure 3.d, respectively).
Figure 3. Nuclei DAPI counter stains of FFPE breast tissue at different digestion times. (a) Optimal digestion time, homogenous staining (arrow). (b) Under-digested, heterogenous staining (arrow). (c) Over digested, some nuclei with doughnut formation (arrow). (d) Heavily over-digested, “ghost” nuclei (long arrow) and damaged nuclei membranes (short arrow).
However, using the daPI staining pattern for evaluation of under-digested samples is very coarse as many lightly fixed tissues appear homogenously stained despite insufficient digestion. a well digested tissue will often morphologically, depending of tissue type, result in a more spherical nucleus with a light swollen appearance compared to an under-digested tissue.
over-digestion of a tissue section results in destroyed tissue, cell and nuclei morphology as well as loss of dna. as binding of daPI to double-stranded dna results in an approximately 20-fold fluorescence enhancement (8), the reduced presence or absence of dna is reflected in the daPI staining pattern. Partly over-digested nuclei may be identified by the absence of daPI staining in the center of the nucleus, giving rise to a doughnut-like appearance (Figure 3.C). In case of intense over-digestion, degradation of the nuclei becomes quite easy to spot with almost empty “ghost” nuclei and destroyed nuclear morphology (Figure 3.d).
Caution should be taken not to conclude cases of under-digestion as over-digested based solely on a daPI staining pattern. In under-digested samples, the daPI molecule will only slowly enter the core of the nuclei (Figure 2.B and d) and this effect may result in lack of core staining and the doughnut-like appearance seen for over-digested samples.
Signal distribution
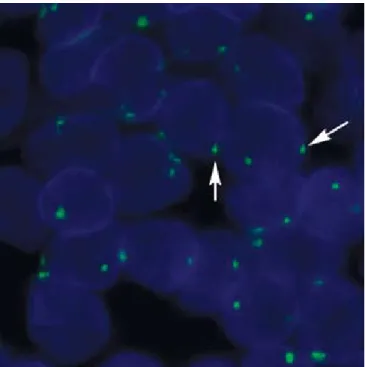
the digestion pattern as shown by daPI staining (Figure 3.a-d) indicates that enzymatic digestion of material in the nucleus is heterogeneous. according to the daPI staining pattern, the center of the nucleus is the most affected area. Loss of genomic dna as a consequence of over-digestion compromises the technical validity of a FISH staining as the number of probe target sequences may be reduced. a study by Bolzer, et al. (7) showed that localization of genomic dna in human nuclei correlates to gene density. poor domains form a layer beneath the nuclear envelope and gene-dense domains are enriched in the nuclear interior. the centromere-based reference probes used in solid tumor FISH probe mixes are per definition targeted to gene-poor domains and should — according to the observations by Bolzer, et al. — have a preference for localization close to the nuclear envelope. this is supported by the signal distribution that can be seen when centromere sequence-based probes are used for interphase stains, see Figure 4.
Figure 4. Staining with CEN-18 FITC-labeled PNA probe (green signals). Arrows illustrate the localization preference close to the membrane of gene-poor DNA domains.
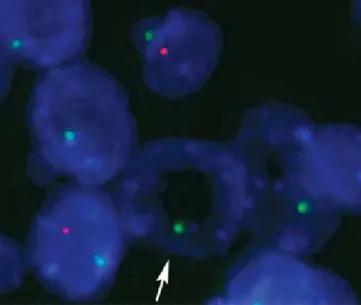
FISH probe target genes are often located in gene-dense domains enriched in the nuclear interior, thus a heterogeneous enzymatic degradation affecting the center of the nucleus may bias probe signals towards a reduced presence of gene targeted signals versus centromere probes closer to the envelope. a possible outcome of over-digestion is shown in Figure 5.
Figure 5. Over-digested (8-minute enzymatic digestion) FFPE breast tissue stained with gene probe (red), a centromere reference PNA probe (green) and DAPI (blue). The image shows doughnut formation and uneven DNA counter stain (blue). The arrow points to a nuclei with loss of red signal. The tissue specimen has a normal 1:1 gene to reference ratio at its optimal digestion time (3-minute enzymatic digestion — data not shown).
Probe Hybridization and Stringency Wash
Following pre-treatment and digestion, a two-step process is required to ensure efficient marking of the target sequences. First the genomic target dna and the labeled probes (when double-stranded) must be denaturated by heating. then the temperature is lowered to start a hybridization competition in which unlabeled repetitive sequences in the probe mix hybridize to complimentary sequences in the target dna to block unspecific signals. Simultaneously, the labeled probe sequences hybridize to complimentary sequences in the target dna and thereby mark the target sequences. the denaturation and hybridization events take place in the presence of formamide, and the optimal temperature profile depends mainly on the concentration of this chaotrope. In a 45% formamide solution, optimal results are obtained by denaturation at 82 °C for 5 minutes followed by hybridization at 45 °C over night (14-20 hours). the reaction should be covered and sealed and the humidity kept at saturation (100%
relative humidity) as evaporation during hybridization can change the probe composition or even dry out the solution thereby compromising signal quality.
Unspecific hybridization events are washed away at stringent conditions prior to mounting. optimal temperature of the post-hybridization wash depends mainly on the salt concentration in the buffer. High salt concentration decreases dna backbone repulsion and thereby increases the dna duplex melting temperature. Wash using a saline-sodium citrate (SSC) buffer with a detergent for 10 minutes at 65 °C efficiently removes mismatch hybrids, but if this temperature is exceeded, it may result in a reduction of signal intensity or loss of the specific signals.
Mounting and Visualization
after mounting, the slides should be left in the dark for at least 15 minutes for daPI to stain the nuclear material. Slides are inspected in a fluorescence microscope. It is important to use the recommended filter sets since use of sub-optimal filters significantly reduces signal intensity (see Chapter 12, Filters for FISH Imaging).
Table 1. Possible Staining Patterns*
Preparation Autofluorescence DAPI Pattern Possible Effects
Under-digestion excessive autofluorescence heterogeneous staining some doughnut nuclei reduced target gene signal in some cells Over-digestion autofluorescence
level does not differentiate properly digested samples from over-digested samples doughnut nuclei “ghost” nuclei destroyed tissue morphology
loss of target gene
signal in some cells Optimal digestion non-disturbing autofluorescence intact nuclei intact tissue morphology homogeneous DAPI staining
all signals will
show reference signals, typically, near membrane target gene signals, typically, in interior *These effects may not be seen in all cells or in all slides.
Conclusion
Correct pre-treatment of FFPe slides is very important to obtain valid FISH staining results. the key factor is to adjust the enzymatic digestion to the fixation history of the tissue. Inspection of autofluorescence level, daPI staining pattern and nuclear morphology are informative tools for an initial evaluation of sample digestion. the signal distribution pattern may add valuable information to assess, if digestion has been optimal. an optimally processed sample is characterized by intact nuclear membranes, non-disturbing autofluorescence and homogeneous daPI staining. Reference signals are expected to be present near the nuclear membrane, whereas the gene targets are predominantly expected in the nuclear interior when arising from gene-dense domains. Finally, areas of normal cells may serve as a control for proper tissue treatment. In normal cells, the target/reference signal ratio should match the ratio which is expected in a normal diploid cell. a prerequisite for use of normal cell areas as tissue treatment control is that the impact of fixation is similar in the normal and the malignant areas.
Acknowledgement
We wish to thank Dr. Martina Schmidt, Scientist, and Dr. Oliver Stoss, Project Manager, Biomarker Analytics and Bioinformatics, Targos Molecular Pathology Gmbh, Kassel, Germany, for providing the FISH images used in Figure 2-3.
References
1. Morales a R, nassiri M, Kanhoush R, Vicek V, nadji M. experience with an automated microwave-assisted rapid tissue processing method. Validation of histologic quality and impact on the timeliness of diagnostic surgical pathology. am J Clin Pathol 121: 528-36, 2004.
2. nassiri M, Ramos S, Zohourian H, Vinvek V, Morales a R, nadji M. Preservation of biomolecules in breast cancer tissue by a formalin-free histology system. BMC Clinical Pathology 8:1, 2008.
3. Landegent J e, Jansen in de Wal n, dirks R W, Baas F and van der Ploeg M. Use of whole cosmid cloned genomic sequences for chromosomal localization by non-radioactive in situ hybridization. Hum genet 77: 366-70, 1987.
4. nielsen K V, Müller S, Poulsen t S, gabs S and Schønau a. Combined Use of Pna and dna for Fluorescence In Situ Hybridization (FISH). In PePtIde nUCLeIC aCIdS — Protocols and applications. 2nd edition.
nielsen P e, eds. Horizon Bioscience, 2004.
5. nielsen K V, Müller S, agerholm I, Poulsen t S, Matthiesen S H, Witton C J, Schønau a. Pna suppression method combined with fluorescence in situ hybridization (FISH) technique. In PRInS and Pna technologies in Chromosomal Investigation. Frank Pellestor, eds. noVa Publishers, 2007.
6. Hopman a H n, Poddighe P, Moesker o and Ramaekers F C S. Interphase cytogenetics: an approach to the detection of genetic aberration in tumours. In diagnostic molecular pathology: a practical approach. M J o and H C S, eds. IRL Press, nY, 1991.
7. Bolzer a, Kreth g, Solovei I, Koehler d, Saracoglu K, Fauth C, Müller S, eils R, Cremer C, Speicher M R, Cremer t. three-dimensional Maps of all Chromosomes in Human Male Fibroblast nuclei and Prometaphase Rosettes. PLoS Biology 3, 826-842. 2005.
8. Barcellona M L, Cardiel g, gratton e. time-resolved fluorescence of daPI in solution and bound to polydeoxynucleotides. Biochem Biophys Res Commun. 170: 270-80, 1990.