Analysis of Environmental and Economic Efficiency:
Application of the Overseer model and simulated data
Thiagarajah Ramilan
Department of Economics, the University of Waikato
Frank Scrimgeour
Department of Economics, the University of Waikato
Dan Marsh
Department of Economics, the University of Waikato e-mail: [email protected]
Paper presented at the 2009 NZARES Conference
Tahuna Conference Centre – Nelson, New Zealand. August 27-28, 2009.
Copyright by author(s). Readers may make copies of this document for non-commercial purposes only, provided that this copyright notice appears on all such copies.
Analysis of Environmental and Economic Efficiency:
Application of the Overseer model and simulated data
Thiagarajah Ramilan, Frank Scrimgeour and Dan Marsh* Department of Economics, the University of Waikato
Summary
New Zealand’s success in raising agricultural productivity has been accompanied by higher input use, leading to adverse effects on the environment. Until recently, analysis of farm performance has tended to ignore such negative externalities. The current emphasis on environmental issues has led dairy farmers to target
improvements in both environmental performance and productivity. Therefore measuring the environmental performance of farms and integrating this information into farm productivity calculations should assist informed policy decisions which promote sustainable development. However this is a challenging process since conventional environmental efficiency measures are usually based on simple input and output flows but nitrogen discharge is a complex process which depends on climate variability, pasture and cow physiology and geophysical variability. Furthermore the outdoor, pastoral nature of New Zealand farming means that it is difficult to control input and output flows, particularly of nitrogen. Therefore this paper proposes a novel approach to measure environmental and economic efficiency of farms using the Overseer nutrient budget model and a spatially micro-simulated virtual population data. Empirical analysis is based on dairy farms in the Karapiro catchment, where nitrogen discharge from dairy farming is major source of nonpoint pollution.
Keywords: Data Envelopment Analysis, Economic, Efficiency, Environment
1. Introduction
Increasing agricultural productivity has been a policy objective in New Zealand, but higher productivity has been accompanied by higher input use, creating negative externalities. Dairy sector has growing pressure from communities concerning its impact on environment. Particularly nitrate leaching from grazed pasture contribute to nutrient enrichment of water bodies. Therefore measuring the environmental performance of dairy farms and integrating this information into farm productivity calculations is important for informed policy decisions which promote sustainable development. To date, analysis of dairy farm performance in New Zealand has ignored undesirable effects on the environment (Jaforullah & Whiteman, 1999; Neal, 2004). This study incorporates farm nitrogen discharges into farm production
measures to identify farms which are efficient economically and environmentally. Efficient farms can be used to benchmark progress and help in the design of policy that promotes sustainable farm efficiency.
2. Method of analysis
This paper proposes a novel approach to measure environmental and economic efficiency of dairy farms using spatially micro-simulated virtual population data. The methodology used for empirical analysis is a two stage process. The first stage involves solving a data envelopment analysis (DEA) problem. In the second stage, the efficiency scores from the first stage are regressed on other explanatory variables using the maximum likelihood approach to identify the reasons for differences in performance.
DEA has been used in many studies to analyse environmental oriented efficiencies (Coelli, Lauwers, & Van Huylenbroeck, 2007; Fare, Grosskopf, & Pasurka Jr, 2007; Tyteca, 1996; Wossink & Denaux, 2006). It does not require the assumption of functional form to specify the relationship between inputs and outputs and the distributional assumption of the inefficiency term. This avoids unnecessary restrictions about functional form, which are likely to distort efficiency measures (Coelli, 1995). The approach can, however, be criticised for not accounting for the possible influence of measurement error and other noise in the data (Coelli, Rao, O'Donnell, & Battese, 2005). Since a virtual population of farms is used to construct the frontier in this study, it is not necessary to consider sampling variability - the data can be considered to be noise free. In fact, in this study efficiency is measured rather than estimated.
3. Modeling environmental performance
The incorporation of environmental impact into productivity analysis provides an opportunity to measure environmental performance. Environmental effects are often brought into the model as either undesirable outputs or undesirable inputs. In recent literature two novel approaches have been adopted. One approach (Coelli, Lauwers, & Van Huylenbroeck, 2007) uses the concept of nutrient surplus to derive
environmental efficiency in agricultural applications. Nutrient surplus is simply calculated as a linear function of input and output using the material balance concept. When output is fixed, nutrient surplus is minimized by decreasing the nutrient
content in the inputs. In the second approach (Asmild & Hougaard, 2006), enhancing the nutrient content of the output is modelled as a mean of minimizing nutrient into environment. It measured economic and environmental efficiency by incorporating economic output variables along with the nutrient content of the output in the output matrix. Asmild & Hougaard use a two step sub-vector DEA approach to quantify efficiency measures. First the combined economic and environmental improvement potential is calculated by incorporating the economic output variable along with the nutrient content of the output (the environmental variable) in the output matrix. Secondly, the economic improvement potential is determined by incorporating only the economic output variables in the output matrix. Thirdly, the environmental improvement potential is calculated by including only environmental variables (nitrogen content of the milk) in the output matrix. Fourthly, the efficiency of economic improvements followed by environmental improvement is reckoned. Finally, the efficiency of environmental improvements followed by economic improvement is calculated. Since the nutrient content of the output is an additional variable to estimate combined economic and environmental efficiency, it is likely to suffer from the dimensionality problem as increasing the number of variables inflates the efficiency.
The concept of material balance has been applied to measure the environmental efficiency of Belgian pig finishing farms by Coelli, Lauwers, & Van Huylenbroeck (2007). They quantified environmental efficiency by determining the combination of inputs that result in the lowest level of nutrient surplus to produce a specified amount of output. Nutrient surplus (z) is simply calculated as a linear function of input and output using the material balance concept (z=a`x-b`q). a and b are the nutrient content of inputs and outputs respectively. When output is fixed, nutrient surplus is minimized by decreasing the nutrient content in the inputs. The input vector which involves minimum nutrient is denoted by xe. The minimum nutrient quantity is a` xe.
The nutrient quantity of observed input is a`x. The environmental efficiency is decomposed into two components: technical efficiency (TE) and environmental allocative efficiency (EAE). TE is measured as production of a given level of output from the minimum amount of inputs. TE is indicated by the ratio of the minimum level of inputs to produce to observed levels of input to produce the same.
4. Challenges to measure dairy farm environmental efficiency
The practical applications of environmental efficiency measures described above rely on simple input and output flow. However, the environmental impact of New
Zealand dairy farms on water quality is a complex process which depends on climate variability, pasture and cow physiology and geophysical variability. In addition to this, the outdoor, pastoral nature of New Zealand farming means that it is difficult to control input and output flows, particularly of nitrogen.
The approach adopted by Coelli (2007) is elegant with regard to policy analysis, but its application would be a challenge for dairy farming in New Zealand. Coelli et al’s model was applied to an intensive pig farming system, which is an indoor production activity where nutrient inflows and outflows are highly manageable and there are no uncontrollable environmental effects. In an intensive farming system of monogastric animals like pigs, calculating nutrient surpluses is straightforward, determined by subtracting the nutrients removed with the harvested crops from nutrient input through manure and fertiliser. The nature of extensive dairy farming means that it is not possible to estimate nitrogen surpluses directly, as part of nitrogen input and removal can be attributed to natural processes such as atmospheric nitrogen fixation and denitrification.
In New Zealand dairy farming the clover/atmospheric nitrogen contribution is difficult to control. The contribution of clover nitrogen is dependent on factors that affect the clover growth and persistence of dairy pastures, including climate, soil nitrogen levels, nitrogen fertilizer use, soil fertility, companion species, choice of cultivar, pasture establishment, grazing management, and pests and diseases. As a result, the clover content of pasture changes on a cyclical pattern, and also a low level of nitrogen fertilizer application tend to boost clover nitrogen fixation. Biologically fixed nitrogen in clover plants is converted into various forms and excreted into the soil. Excreted nitrogen is converted to nitrates through
ammonification and nitrification. According to reported farmlet trial results (Tillman, 2008) there is an inverse relationship between nitrogen fixation and the addition of nitrogen fertilizer. In addition to this, nutrient surpluses alone do not fully represent water quality damage from farming systems as there are other influences at work as well. These include soil type, topography, animal productivity, climate and winter management (Thomas, Ledgard, & Francis, 2005). Coelli et al (2007) and Asmild &
Hougaard (2006) modelled nutrient surpluses rather than environmental impact, and Asmild & Hougaard (2006) added constant atmospheric nitrogen deposit.
However, the environmental impact of New Zealand dairy farms on water quality is a complex process which depends on climate variability, pasture and cow physiology and geophysical variability. In addition to this, the outdoor, pastoral nature of New Zealand farming means that it is difficult to control input and output flows,
particularly of nitrogen. The measurement of environmental efficiency in this paper combines the merits of the efficiency measures described by Renihard et al (2000), Asmild & Hougaard (2006) and Coelli et al (2007) in order to apply to New Zealand farming context.
In this study farm nitrogen discharges are estimated by Overseer nutrient budget model (Agresearch, 2009). It is a farm gate balance approach providing a mean to evaluate the environmental impact of nutrient use (Wheeler, Ledgard, DeKlein, Monaghan, & Carey, 2003). In Overseer leached nitrogen is calculated from different sources of N including animal manure or urine (estimated from animal intake), fertiliser and effluent, and loss factors based on animal type, soil group, drainage status and rainfall. Farm nitrogen discharges are described by the following function.
) ,
, , ,
(FertiliserN StockingRate Feed Soiltype Topography f
z (1)
where z- indicates the nitrogen discharge per ha. In estimating nitrogen discharges, winter management and effluent disposal practices are assumed to be on a par with industry recommendations, and an average rainfall of 1100 mm for the Waikato region is used. Input oriented approaches are useful in situations where the
environmental focus is on reducing pollution while maintaining production (Wossink & Denaux, 2006). Technical efficiency is formulated as the ability of a farm to reduce input including nitrogen discharges for a given level of output. The mathematical formulation for input oriented technical efficiency under constant returns to scale as follows. z is the vector nitrogen discharge. Q is the output and x is the conventional input.
, Min subject to 0 qj Q 0 xj X 0 zj Z 0
(2)The total number of farms is N. Outputs of each (jth) farm are described by a column vector of outputs (qi). Inputs of each farm are described by column vector (xi).
Nitrogen discharge from each arm is described by (zi). Q can be elaborated as
N j j ij q 1 and X can be elaborated as
N j j ij x 1 j
, is a scalar and
is a N * 1 vector of constants. The estimated value of is the efficiency score for each of N farms. The estimate will satisfy the restriction <=1 with the value j=1 indicating the efficient farms. In other words, it is possible to reduce the input use of farms by (1- j). This formulation computes input oriented technical efficiency as the ability of a farm to reduce input, including nitrogen discharges, for a given level of output.Economic efficiency is formulated as the ability to minimize farm expenses ( x* ) for a given level of other variables. The mathematical formulation is similar to Equation 3. It is measured as the ratio of minimum cost to observed cost.
* ,* i i x cx Min i subject to 0 qj Q ; 0 * X xj 0 Z zj 0 (3)
Environmental efficiency is defined as the ratio of minimum nitrogen discharge to observed nitrogen discharge, conditional on observed levels of the desirable output and the conventional inputs. This is achieved by minimizing the nitrogen discharge for a given level of output and other conventional inputs.
, Min subject to 0 qj Q 0 X xj 0 zj Z 0
(4)Environmental–economic efficiency is modeled as minimizing nitrogen discharge and farm expenses simultaneously, given output level and other inputs. This overcomes the dimensionality problem in Ashmild’s approach,
, Min subject to 0 qi Q 0 x X
0 zj Z 0
(5)A two stage process is adopted to model economic improvements and then
environmental improvement. In the first stage, economic improvement potential is calculated by maximizing the farm income for a given level of other inputs including nitrogen discharges. Farm income is derived by multiplying milksolids produced by the payout received. The output orientation is used as it is easy to get the estimates for the subsequent stage, where economic efficiency is followed by environmental efficiency. Max subject to 0 ) * ( p qi Q 0 X x 0 Z zi 0 (6)
Farms are first made economically efficient through multiplying economic output (farm income) by economic efficiency scores. Then in the second step the
environmental efficiency is derived using economically efficient output, similar to that specified in Equation 6. Finally, two the step analysis carried out perform environmental improvements followed by economic improvement here farms are first made environmentally efficient by using the environmental efficiency scores. Then in the second step economic efficiency is derived using adjusted environmental output.
The above DEA efficiency measures are calculated using an open source software package, FEAR (Version 1.12) by Wilson (2009). It is implemented on R, which is a language and environment for statistical computing and graphics.
5. Analysis of environmental efficiency variation
Environmental efficiency is affected by many factors such as management, input use, topography, and soil type. Tobit regression using the maximum likelihood approach is used for regressing such variables on the efficiency estimates. This two stage approach was preferred for a number of reasons: its ability to accommodate multiple continuous and categorical variables; the requirement of no prior assumptions regarding the direction of influence of environmental variable and statistical inference on the influence upon efficiencies; computational convenience and transparency. In order to investigate the factors that explain environmental
efficiency, DEA environmental efficiency scores were regressed on other variables. The explanatory model can then be written as Equation 7
X
where Y is a DEA efficiency score, rescaled between 0 and 100, and used as a dependent variable. X is a vector of independent variables related to farm specific attributes. β is the unknown parameter vector associated with the farm specific attributes, and i is an independently distributed error term assumed to be normally distributed with 0 mean and constant variance, 2. Tobit regression is implemented
in Stata 10 (StataCorp., 2007).
6. Empirical analysis
The data used in this study consists of 210 virtual farms in the catchment. Physical and financial farm variables and estimated nitrogen discharges are used for analysis. In the Waikato 90% of farm revenue on average is derived from the sale of
milksolids, according to the DairyNZ’s Economic Farm Survey for 2003/04 and 2004/05, It is reasonable therefore to treat milksolids as the sole economic output of the farms. Given the virtual nature of the data, particular care was taken in the selection and definition of variables. Land, building and plant and machinery variables were avoided as they may not be representative of the farms in the
catchment. Land prices in particular are influenced by location as well as economic productivity, and variations in plant and machinery are affected by the particular type in use. The economic farm surplus variable was not used, as depreciation, labour, runoff and stock may not be applicable to the virtual population.
The choice of variables has to be limited to avoid the problems of dimensionality that can affect DEA analysis. Due to the nature of the technique the number of model variables may affect DEA results. DEA efficiency rating depends on the number of farms and the number of inputs and outputs specified (Ondersteijn, Lansink, Giesen, & Huirne, 2002). Adding more model variables for a given number of farms can yield higher efficiency scores for units in the sample. However, omitting necessary input or output may lead to misspecification of the production model. Therefore various inputs belonging to the same category and measured in the same physical units have been aggregated. Major types of supplementary feeds were aggregated using the energy content of the major ingredient in terms of Megajoules. Farm expenses are specified by aggregating variable and fixed costs. Farm expenses defined here are on average less than 20 percent of the average farm expenses reported in the Economic Farm Survey of Dairy Farms. This is due to the exclusion of some variables which would have been difficult to assign to farms in a virtual population. For the same reason dairy farm income also excludes other dairy income and net stock income.
Table 1 presents summary statistics of the variables for farms used in the efficiency analysis. Table 2 lists the variables used in the regression analysis. The geophysical environment which is likely to affect the nitrogen discharges is represented by dummies for soil type and topography. These dummy variables categories were merged into larger groups when there were only a small number of observations in a category, and they were similar in terms of nitrogen discharge potential. The market value of cows was used as a proxy for genetic merit and resultant feed conversion efficiency. It was assumed that the market value of stock included only the milking cows.
Table 1: Descriptive statistics of the data used in the efficiency analysis
Variable Units Mean Stdev Minimum Maximum
Milksolids Kg 97,870 52,699 30,891 350,957 Farm size Ha 107 63 26 570 Milking cows No 284 167 99 1200 Nitrogen discharge Kg 4133 2606 836 21090 Farm expenses $ 260,560 141,851 82,607 855,459 Farm income $ 434,541 233,982 137,155 1,558,249
Table 2: Explanatory variables used in Tobit regression
Variable Units Mean Stdev Minimum Maximum
Maize silage/cow Tones 0.21 0.29 0.00 1.33
Market value/cow $ 989.00 158.50 491.00 1224.49
Milksolids per cow No 351.07 45.46 246.37 464.49
Stocking rate Kg 2.72 0.48 1.80 4.51
Fertiliser nitrogen kg 135.22 64.00 20.00 290.00
Geo-physical variablesPodzol –rolling, Volcanic –easy, rolling, Pumice-easy
7. Results and discussion
Scale efficiency of farms was examined in terms of technical efficiency. The mean scale efficiency was 0.96, so farms are considered to be on constant returns to scale. New Zealand dairy farms are characterised by constant returns to scale in other studies as well (Jaforullah & Whiteman, 1999; Neal, 2004).
Efficiency measures are computed according to DEA models specified in Equations 1 to 6. The results are summarized in Table 3. Substantial differences are found in efficiencies among farms. The average level of technical efficiency of 0.82 means that in principle the farms can reduce their input use by 1- 0.82 (18 percent) and still maintain the existing level of output. In effect, the level of output can be enhanced by keeping the level of inputs constant. However, the perceptions of risk and the skill level of farmers might have an impact on their ability and desire to achieve this sort of efficiency. The measure of technical efficiency found here is similar to the technical efficiency of dairy farms (0.83) estimated by Jaforullah & Whiteman in 1999. Mean economic efficiency of 0.72 suggests that the average farm could reduce costs by 28 percent and still produce the same output. The mean allocative efficiency is quite high, at 0.89. This suggests that most farms are using an input mix that approximates the cost minimizing the input mix. The high mean allocative efficiency scores are most likely due to the production technology, which is well known and adopted by farms (Coelli et al, 2007).
Table 3: DEA efficiency scores Efficiency measure Efficient
farms
Mean Stdev Min Max
Technical efficiency 16 0.82 0.09 0.57 1.00 Economic efficiency 13 0.72 0.13 0.49 1.00 Environmental efficiency 3 0.64 0.12 0.42 1.00 Allocative efficiency 5 0.89 0.19 0.41 1.00 Environmental-economic efficiency 12 0.80 0.11 0.55 1.00 Economic efficiency followed
by environmental efficiency 19 0.75 0.10 0.57 1.00 Environmental efficiency followed by economic efficiency 10 0.78 0.08 0.67 1.00
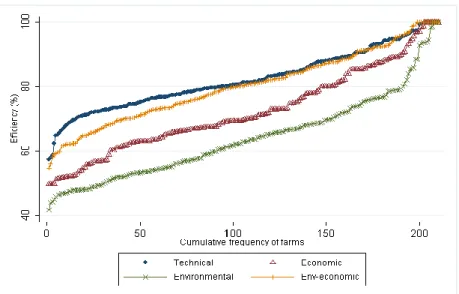
Figure1 shows the cumulative frequency distributions of the different efficiency measures. Approximately 80 percent of farms achieved less than 80 percent environmental efficiency. In contrast, more than 60 percent of farms achieved more than 80 percent technical efficiency. Environmental-economic efficiency seems to be similar to technical efficiency.
Figure 1 Cumulative distribution of efficiency
The mean environmental efficiency of 0.64 indicates that the average farm may be able to produce their current level of output with 36 percent less nitrogen discharge. Extrapolating from this across the catchment would suggest that 552, 962 kgof nitrogen discharged per year could be avoided if all farms achieve environmental efficiency. However, natural geophysical factors such as soil type and topography are likely to make this difficult to achieve. Agri-environmental policies need to consider differences in the inherent
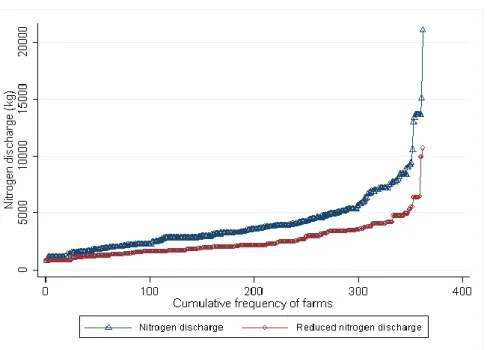
efficiency of farms. Figure 2 compares the cumulative nitrogen discharge levels between the status quo and the environmentally efficient scenario. This indicates the potential for very significant nitrogen discharge reduction in dairy farming, without any need to find extra and expensive new technologies for pollution reduction. However, there is a cost associated with operating at the emission minimizing point. Table 7.4 shows average
nitrogen discharge and expenditure in relation to economic and environmental efficiency. Achieving environmental efficiency costs on average $757 per ha. Moving from an
economically efficient nitrogen discharge level to an environmentally efficient discharge level reduces the mean nitrogen discharge by 38 percent. This information can be used to determine the shadow cost, which is (2534-1777)/(39-24)= $50.50 per kg for this nitrogen discharge reduction. Appropriate environmental policies may be required in order to move farms towards an environmentally efficient point.
Economic efficiency followed by environmental efficiency scores reveal the additional environmental improvements potential after efficiency with respect to the economic output variable has been attained. In other words: Even if the primary focus for the farmers is on realizing their economic improvement potential, the environmental improvements found here have to be realised.
Figure 2 Comparison of nitrogen discharges
Table 4: Average nitrogen discharge and expenditure for economic and environmental efficiency
Economic efficiency Environmental efficiency
Nitrogen discharge (kg/ha) 44 19
Farm expenses ($/ha) 1777 2534
Environmental efficiency variation
Factors affecting environmental efficiency are shown in Table 5. The pseudo R2 of 0.068 reported may not be the best measure of fit, so R2 is based on predicted and observed efficiency values. The calculated value is 0.44, which is similar to OLS R2. The model, therefore, explains 44 percent of the variation. Given the cross sectional nature of the data, the fit can be considered reasonable.As might be expected, stocking rate has a negative and significant effect on environmental efficiency, indicating that lowering the stocking
rate has the potential to significantly improve environmental efficiency. The effect of the production potential of each dairy cow is negative (but not significant). This may be contradictory to the expectation. Likely cause is the positive correlation between stocking rate and production potential in the data set. However Ondersteijn et al (2002) found a higher milk production per cow is concomitant with fewer cows and increased efficiency in terms of conversion of feed into milk. Reinhard, Lovell, & Thijssen (2002) showed that a more productive breed of cows could contribute to environmental efficiency by reducing the stocking rate and increasing the feed conversion efficiency. The market value of cows has been used as a proxy for breed quality and seems to have a slight positive effect on efficiency. Supplementary feed has a positive effect on efficiency but it is not significant, which may be due to low levels of usage (on average 0.2 tons per head per year).
According to farmlet trials feeding maize silage tends to reduce nitrogen discharge by 10 percent because of a higher conversion of nitrogen to milk in low protein supplementary feed (Ledgard, Penno, & Sporsen, 1999).
Table 5: Parameter estimates for environmental efficiency
Variables Estimate Standard error t-value p-value
Intercept 85.45 8.57 9.97 0.000
Production environment
Supplemetary feed/cow 0.61 2.74 0.22 0.82
Market value/cow 0.02 0.01 3.34 0.01
Milksolids per cow -0.01 0.01 -0.77 0.44
Stocking rate -4.39 1.51 -2.92 0.00 Physical environment Dummy variables Volcanic-easy*(0.24)+ -17.10 2.77 -6.18 0.00 Volcanic-rolling*(0.18)+ -19.16 2.89 -6.63 0.00 Pumice_rolling*(0.33) + -25.39 2.69 -9.37 0.00 Pumice_easy* (0.14) + -25.19 2.97 -8.54 0.00 Ó 10.05 0.50 Pseudo R2 0.07
* Podzol- rolling is used as base and captured by the intercept term
Log-likelihood -772.12 + The values in parenthesis behind the dummy variables indicate the percentage of the total observations that are described by each dummy variable.
Number of observations 210
The integration of low-protein forage (e.g. feeding cows with maize silage) to reduce
use efficiency (Luo, Ledgard, De Klein, Lindsey, & Kear, 2008). There are concerns over feeding maize silage, however, because feed cost is higher and there are additional
nitrogen discharges from growing the extra maize.
The Podzol soil group is used as the base to interpret the coefficients on the dummy variables. It is represented by the regression intercept. The estimates on the three dummy variables thus measure the proportionate difference in environmental efficiency in relation to Podzols. The effect of pumice soil on environmental efficiency is significant and
negative, since pumice soils are prone to nitrogen leaching. However, the negative impact of volcanic and Podzol soils is less pronounced than with pumice soils, showing the
importance of considering geophysical variations when designing policies for water quality
7. Implications
This paper presents an analytical framework to measure environmental and economic efficiency. The second stage parameter estimates reflect the impact of variables that can guide policy to improve environmental efficiency. The farms studied are shown to be technically efficient producers, but there is still significant room for improvement in terms of environmental efficiency. In order to realize the environmental improvement potential, it would be useful to identify the characteristics of those farms that are environmentally efficient. Economic efficiency can be viewed as a private good for farms. Environmental efficiency, on the other hand, is a public good, important from a social point of view. It may, therefore, be necessary to provide further incentives through regulatory initiatives (Asmild & Hougaard, 2006).
In the efficiency measurements, it is assumed that farms do not adopt any best
management practices. A range of such options are proposed, such as limiting external nitrogen input, increasing nitrogen use efficiency via lower protein feed resources, reducing farm dairy effluent losses, avoiding direct deposition of excreta to land in autumn/winter by using grazing off or feed pad systems or herd homes and nitrification inhibitors. However, these best management practices may need additional inputs such as extra capital for building feed pads or herd homes.
Environmental efficiency measures enable impact analysis of various environmental policies such as use of pollution standards, taxes or tradable emission permits. Given adequate data, this approach can be extended to analyse other environmental issues such as efficiency of Greenhouse Gas foot print.
Further research on the socio-economic characteristics of farms is needed to identify the reasons for variations in environmental efficiency. Farmer characteristics such as
education, experience and ownership structure can play a major role in farm efficiency. For instance, the management ability of the farmer is affected by personal characteristics (Nuthall, 2001), and owner-operated farms are reported to be more efficient (Wossink & Denaux, 2006).
Finally, farm level environmental-economic efficiency scores should not be directly interpreted as representing the amount of environmental harm caused by farms, since the location of farms in relation to a water body may influence the damage to the water body. In addition, some farms could be taking measures to abate pollution through the adoption of best management practices such as using nitrification inhibitors and winter pads.
Therefore an extension of the model to incorporate these could be of interest, given ready availability of data on abatement activity.
References
Asmild, M., & Hougaard, J. L. (2006). Economic versus environmental improvement potentials of Danish pig farms. Agricultural Economics, 35(2), 171-181.
Coelli, T. (1995). Recent developments in frontier modeling and efficiency measurement.
Australian Journal of Agricultural and Resource Economics, 39(3), 219-245.
Coelli, T., Lauwers, L., & Van Huylenbroeck, G. (2007). Environmental efficiency measurement and the materials balance condition. Journal of Productivity Analysis, 28(1-2), 3-12. Coelli, T. J., Rao, D. S. P., O'Donnell, C. J., & Battese, G. E. (2005). An Introduction to Efficiency
and Productivity Analysis (2nd ed.). New York: Springer.
Fare, R., Grosskopf, S., & Pasurka Jr, C. A. (2007). Pollution abatement activities and traditional productivity. Ecological Economics, 62(3-4), 673-682.
Jaforullah, M., & Whiteman, J. (1999). Scale Efficiency in the New Zealand dairy industry: a non-parametric approach. The Australian Journal of Agricultural and Resource Economics, 43(4), 523-541.
Ledgard, S. F., Penno, J. W., & Sporsen, M. S. (1999). Nitrogen input and losses from grass/clover pastures grazed by dairy cows, as affected by nitrogen fertiliser application. Journal of Agricultural Science, 132, 215-225.
Luo, J., Ledgard, S. F., De Klein, C. A. M., Lindsey, S. B., & Kear, M. (2008). Effects of dairy farming intensification on nitrous oxide emissions. Plant Soil, 309, 227–237.
Neal, M. (2004). Re -ranking of individual firms using alternative performance measures: the case of New Zealand dairy farms. Paper presented at the Asia-Pacific Productivity Conference, Brisbane.
Nuthall, P. L. (2001). Managerial ability — a review of its basis and potential improvement using psychological concepts Agricultural Economics 24(3), 247-262.
Ondersteijn, C. J. M., Lansink, O. A., Giesen, G. W. J., & Huirne, R. B. M. (2002). Nutrient Efficiency and Nutrient Productivity Growth on Dutch Dairy Farms. Wageningen: Department of Business Economics Wageningen University.
Reinhard, S., Lovell, C. A. K., & Thijssen, G. (1999). Econometric estimation of technical and environmental efficiency: an application to Dutch dairy farms. American Journal of Agricultural Economics, 81(1), 44-60.
Reinhard, S., Lovell, C. A. K., & Thijssen, G. (2000). Environmental efficiency with multiple environmentally detrimental variables; estimated with SFA and DEA. European Journal of Operational Research, 121(2), 287-303.
StataCorp. (2007). Stata Statistical Software: Release 10: College Station, TX: StataCorp LP. . Tyteca, D. (1996). On the measurement of the environmental performance of firms - A literature
review and a productive efficiency perspective. Journal of Envrionmental Management, 46(3), 282-308.
Wheeler, D. M., Ledgard, S. F., DeKlein, C. A. M., Monaghan, R. M., & Carey, P. L. (2003 ). OVERSEER® nutrient budgets – moving towards on-farm resource accounting, Proceedings of the New Zealand Grassland Association 65, 191-194.
Wilson, P., W. (2009). FEAR: A software package for frontier efficiency analysis with R. Socio-Economic Planning Sciences, DOI:10.1016/j.seps.2009.02.001.
Wossink, A., & Denaux, Z. S. (2006). Environmental and cost efficiency of pesticide use in transgenic and conventional cotton production. Agricultural Systems, 90(1-3), 312-328.